I. INTRODUCTION
In recent years, perovskite-type oxide nanomaterials have gained a great deal of research interest owing to vast technological demand that require components with one or more useful properties, such as ferroelectric, piezoelectric, dielectric, and pyroelectric responses. As compared to many other perovskite materials, Pb-based perovskite system, e.g., lead titanate (PT, PbTiO3), has its own importance on account of its high Curie temperature (T C = 490 °C),Reference Lemos, Longo, Leite, Melo and Silva1 high pyroelectric constant,Reference Sirera and Calzada2 substantially high spontaneous polarization (P s = 75 μC/cm2),Reference Sun, Chen, Ma, Wang, Yu, Zhang and Ming3 and low dielectric constant.Reference Ikegami, Ueda and Nagata4 At a low temperature (<490 °C), PT remains in ferroelectric phase exhibiting a tetragonal crystal structure (space group of P4mm) and tetragonality (c/a ratio) as high as 1.06. It undergoes a tetragonal-to-cubic phase transition at T C. The cubic phase (space group of Pm3m) does not possess a net moment and thus characterizes a paraelectric state. Owing to its high T C value, PT is often regarded as a deserving candidate over BaTiO3, which loses its ferroelectricity at T C= 120 °C.
As far as processing techniques are concerned, numerous reports are found in the literature that appeared in the recent past. Spherical as well as one-dimensional PT nanostructures have been synthesized by using sol–gel,Reference Jacob, Panicker, Selvam and Kumar5 hydrothermal,Reference Moon, Li, Randall and Adair6 and solid-state/mechanochemicalReference Szafraniak, Połomska and Hilczer7 routes. The fabrication of high-quality PT as mechanically robust, dense, monolithic ceramic still remains an issue due to associated problems like Pb loss, porosity, microcracking, etc. The volatilization of Pb as PbO increases remarkably when temperature is raised to 800 °C, and PbO-rich PT may form a liquid phase above 838 °C.Reference Kim, Jun and Hwang8
An appropriate level of doping is always desired in the modification and optimization of structural and electronic properties. Earlier works demonstrate that properties, such as crystal anisotropy, dielectric and piezoelectric responses, etc., can be substantially modified by the concentration of dopants and additives present in the host.Reference Kumar and Yadav9–Reference Erdem, Jakes, Parashar, Kiraz, Somer, Rudiger and Eichel12 To improve electronic, piezoelectric, and ferroelectric properties, several attempts have been made to dope PT system with various rare earth impurities (e.g., Ce, Er, Y, etc.)Reference Iakovlev, Solterbeck, Souni and Zaporojtchenko10, Reference Lemos, Melo and da Silva11, Reference Lemos, Melo and da Silva13 and transition metal elements (e.g., Cu, Fe, Zr, etc.).Reference Erdem, Jakes, Parashar, Kiraz, Somer, Rudiger and Eichel12, Reference Ren, Xu, Wei, Liu, Hou, Du, Weng, Shen and Han14, Reference Xiao, Ren, Liu, Wei, Xu, Liu, Li, Shen and Han15
In this work, we show that how optical characteristics can be interrelated with ferroelectric responses of PbO-free nanoscale PT derived by a cost-effective homogeneous solid-state process. In particular, the influence of Mn substitutional doping on PT is being discussed with regard to structural, optical emission, and polarization switching aspects.
II. EXPERIMENTAL DETAILS
A. Synthesis of nanoscale PT systems
An appropriate amount of solid lead nitrate [Pb(NO3)2, 99.5% pure, LobaChemie] and titanium dioxide (TiO2, 99.5% pure, LobaChemie, India) were mixed together (1:1 molar ratio) and heated at 100 °C for 5 min for making it moisture free. Then, the mixture was transferred to an agate mortar and subjected to soft but unidirectional grinding at room temperature (∼26 °C) for 2 h and then open air sintering (∼600 °C) in a muffle furnace. The procedure was repeated for several times to facilitate homogeneous mixing and, finally, to obtain PbO-free product. The formation of PT nanopowder was characterized by a gradual color change from gray to faint yellow. The corresponding chemical reactions associated with the formation of PT specimens are as below:
 $${\rm{2Pb(NO}}_{\rm{3}} )_2 {\rm{(s)}} \to {\rm{2PbO(s)}} + {\rm{4NO}}_{\rm{2}} {\rm{(g)}} + {\rm{O}}_{\rm{2}} {\rm{(g)\quad,}}$$
 $${\rm{PbO(s)}} + {\rm{TiO}}_{\rm{2}} ({\rm{s)}} \to {\rm{PbTiO}}_{\rm{3}} \,{\rm{(undoped \,\,\,PT)}}{\rm{\quad.}}$$
To incorporate Mn into the host lattice, Mn to Ti ratio (Mn/Ti) was varied as 0.01, 0.03, 0.05, 0.1, and 0.3 (i.e., up to a maximum of 30 at.%). Anhydrous MnO2was added to the reaction mixture at the time of initiation of reaction. The rest of the steps remained same as the case for synthesizing PT-only specimens. The relevant chemical equation will be:
 $${\rm{PbO(s)}} + x{\rm{MnO}}_{\rm{2}} + (1 - x){\rm{TiO}}_{\rm{2}} \to {\rm{PbTi}}_{1 - x} {\rm{Mn}}_x {\rm{O}}_{\rm{3}} \,{\rm{(Mn {\hbox-} doped}}\,\,{\rm{PT)}}{\rm{\quad.}}$$
B. Characterization techniques
The crystallographic phase of the as-synthesized PT nanoparticles was investigated by studying diffraction patterns obtained from an x-ray diffraction (XRD) machine (Rigaku D/max-2000 diffractometer, Japan) and using radiation (λ = 1.54 Å). The diffraction angle 2θ was in the range of 20° and 75°. The morphological aspects of nano-PT were studied by a scanning electron microscope (SEM) (JEOL JSM-6390LV, Singapore) and a high-resolution transmission electron microscope (HRTEM) (JEOL JEM-2100). The elemental study was performed through an energy dispersive spectroscopy attached to the microscope. The optical absorption study was performed by an ultraviolet (UV)–visible absorption spectroscopy (UV 2450, Shimadzu Corporation, Japan), whereas room temperature photoluminescence (PL) patterns were obtained from a PerkinElmer LS 55 spectrophotometer (PerkinElmer, Singapore, with Xe lamp as the excitation source, λex = 325 nm). Finally, to check the P-E hysteresis loop, 0.03 g of PT nanopowder was dispersed in the dielectric media (polyvinyl alcohol), and thin solid films were casted on borosilicate slides. Properly dried films of area 0.3 × 2 cm2 were gently removed and used as a capacitive element between the two parallel plates of aluminum. Consequently, P-E loops were obtained using a custom-made modified Sawyer–Tower circuit.Reference Sawyer and Tower16
III. RESULTS AND DISCUSSION
The structural, morphological, optical, and ferroelectric properties of the as-synthesized nano-PT samples are discussed as below.
A. Structural, morphological, and tetragonality features
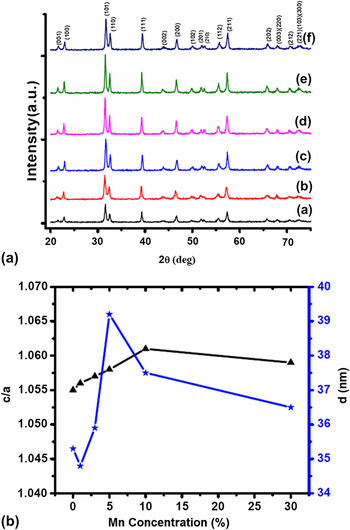
The characteristic XRD patterns are shown in Fig. 1(a). Different peaks corresponding to (001), (100), (101), (110), (111), (002), (200), (102), (201), (210), (112), (211), (202), (003), (212), and (221) crystallographic planes were found to be located at the Bragg angles (2θ) of 21.5°, 22.9°, 31.6°, 32.5°, 39.2°, 43.7°, 46.6°, 49.8°, 51.9°, 52.5°, 55.5°, 57.3°, 65.7°, 68.0°, 70.5°, and 72.5°, respectively. The diffraction peaks of PT nanoparticles (trace a) illustrates that it is free from PbO and other intermediate or unreacted elements. A clear splitting of (001) and (100) peaks ensures that the PT nanoparticles have a tetragonal crystal structure.Reference Paris, Gurgel, Boschi, Joya, Pizani, Souza, Leite, Varela and Longo17
(a) XRD patterns of as-synthesized nano-PT products. Trace (a) represents PT-only sample, whereas plots (b)–(f) depict diffractograms of samples with 1%, 3%, 5%, 10%, and 30% Mn incorporation. (b) Variation of c/a and average crystallite size (d) with Mn content.

The dependency of crystallite size, microstrain, and tetragonality with Mn incorporation can be assessed using Bragg’s law and, consequently, Williamson–Hall plot to every set of XRD profile. In Fig. 1(a), trace (a) represents the XRD pattern of PT-only system, whereas traces (b), (c), (d), (e), and (f) characterize diffractograms for systems with 1%, 3%, 5%, 10%, and 30% of Mn incorporation, respectively. As can be found, the diffraction signals become more intense with an increase of Mn/Ti ratio and up to a value of 0.1, i.e., when concentration of Mn is below 10%. The intensities of split (001) and (100) peaks were also maximum when Mn/Ti = 0.1. The variation of tetragonality and average crystallite size with Mn concentration is shown in Fig. 1(b). The estimated tetragonality values were 1.055, 1.056, 1.057, 1.058, 1.061, and 1.059, respectively. Thus, maximum tetragonality (1.061) was achieved by a specimen having 10% Mn incorporation. The tetragonal symmetry of PT nanoparticles is believed to be affected by insertion Mn ions. The chemical incompatibility, owing to different ionic radii (R Ti ∼0.147 nm, R Mn ∼0.127 nm), is the chief reason behind the display of maximum tetragonality while maintaining the perovskite structure intact. Beyond a critical limit, instead of substituting Ti ions, the extra Mn ions would form a thin layer of neutral MnO2. The XRD patterns did not show any extra peak (due to other by-products) except characteristic peaks due to PT. The formation of MnO2 layer in other titanate system has already been witnessed.Reference Izumi, Konishi, Nishihara, Hayashi, Shinohara, Kawasaki and Tokura18 It was proposed that the tetragonality of perovskite ferroelectrics can vary with the particle size.Reference Kumar and Yadav9 In our case, the average crystallite size for pure and Mn-incorporated PT systems was estimated as 35.3, 34.8, 35.9, 39.2, 37.5, and 36.5 nm for different Mn levels of 0%, 1%, 3%, 5%, 10%, and 30%, respectively. As a general trend, the tetragonality has an increasing trend with the increase of average crystallite size. It is worth mentioning here that, although the crystallite sizes of specimens with 10% and 30% Mn levels are very close, the later exhibited a low value of tetragonality. Consequently, the formation of a MnO2overlayer is unavoidable and was also predicted in an earlier work.Reference Roy and Mohanta19
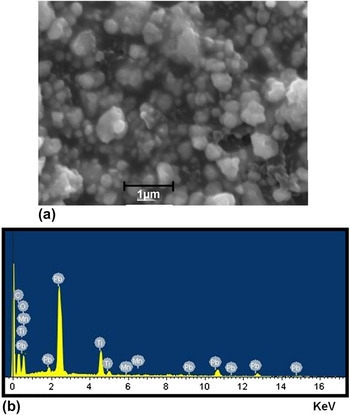
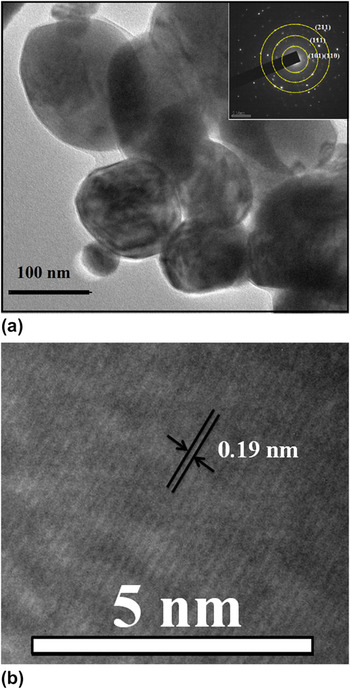
The morphological features of the nano-PT products were also analyzed by scanning electron microscopy (SEM) and transmission electron microscopy (TEM). The SEM image, shown in Fig. 2(a), depicts formation of nanostructures with particle size varying in the range of ∼70–200 nm. By using energy dispersive x-ray (EDX) spectroscopy, the elemental analysis was performed on a PT sample containing 3% Mn ions. The spectrum ensured the presence of Mn in the test specimen. Ti and Mn atoms, corresponding to the lowest ground state energy, were found to be located at the same position, as evident from Fig. 2(b). The tetragonal symmetry of the nanoparticles, having a lateral dimension of ∼65 nm, was also evident from the electron micrograph [Fig. 3(a)]. Note that the particle size measured by HRTEM is somewhat larger than that of the average size predicted from the XRD analysis. This is because each of the particles may be consisting of more than one crystallites. The presence of equispaced crystalline planes is apparently observable in the HRTEM micrograph with an interplanar spacing estimated as 0.19 nm, which is attributed to the (211) planes [Fig. 3(b)]. The selective area electron diffraction pattern (SAED) of the specimen is shown in the inset of Fig. 3(a). It characterizes indistinct unclear diffraction rings, thus demonstrating the presence of a substantial amount of polycrystallinity in the nano-PT system.
(a) SEM of Mn-free PT system. (b) EDX spectrum of 3% Mn-incorporated PT nanosystem.

(a) HRTEM and SAED image of as-synthesized PT nanosystem. (b) Lattice fringe pattern (crystal planes) along (211) plane.

B. Optical transition and radiative emission characteristics
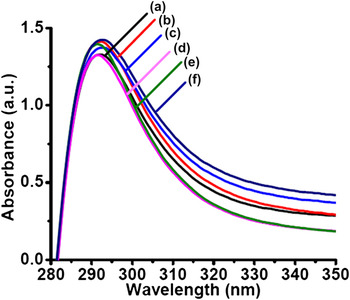
Optical absorption spectra of nano-PT samples are shown in Fig. 4. The absorption peak located at ∼292 nm was ascribed to the absorption across the extended band gap (∼4.23 eV). The traces (a–f) corresponded to 0%, 1%, 3%, 5%, 10%, and 30% of Mn concentrations in the PT host.
UV–visible absorption spectra of Mn-free and Mn-incorporated PT nanosystems.

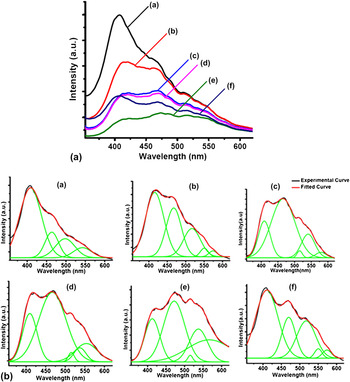
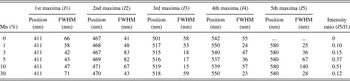
The room temperature PL emission spectra of as-synthesized PT nanosystems (excited at ∼325 nm) are shown in Figs. 5(A) and 5(B). In Fig. 5(A), the curve “a” depicts the PL spectrum of nano-PT system without Mn incorporation, whereas traces (b)–(f) depict PL responses of 1%, 3%, 5%, 10%, and 30% of Mn concentration in PT systems. As the nature of the PL profile is highly dependent on the nature of radiative transitions, comparison of different peaks is extremely important for all the specimens. Figure 5(B) [plots (a–f)] depicts a set of deconvoluted PL spectra obtained as a result of Gaussian fitting. The characteristic parameters obtained are shown in Table I. It was revealed that each of the spectra is consisting of five bands in the violet, blue, yellow, and orange–red region. de Lazaro et al.Reference de Lazaro, Longo, Sambrano and Beltran20 have theoretically calculated the band gap of bulk PT, which is ∼3.18 eV, but the experimental value was predicted within 3–4.5 eV.Reference Mousavi, Abolhassani, Poorahmad, Javid-Jam and Poorhabib-yekta21, Reference Leite, Santos, Carreno, Longo, Paskocimas, Varela, Lanciotti, Campos and Pizani22 The first peak, upon deconvolution, was observed at ∼411 nm (3.01 eV). In comparison to the established value of the band gap, we ascribe the first peak to the direct electron deexcitation from the conduction band to the valance band. The second band was found to be centered at ∼467 nm (2.65 eV). This blue emission band is associated with a nonuniform band gap structure with a tail of localized states and possible mobile states. The recombination of trapped electrons and holes in the tail and gap states is accompanied by a blue emission band, which is in consistency with others’ report.Reference Gu, Hu, You, Hu, Yuan and Zhang23 The localized tail states of PT mainly arise due to structural disorder in the lattice of PT.Reference Leite, Paris, Pontes, Paskocimas, Longo, Sensato, Pinheiro, Varela, Pizani and Campos24
(A) PL spectra of Mn-free and Mn-incorporated PT nanosystems (excited at 325 nm). (B) Plots (a–f) depict overall and deconvoluted PL spectra (upon Gaussian fitting) for PT-only and 1%, 3%, 5%, 10%, and 30% Mn-incorporated PT nanosystems.

Deconvoluted PL peaks obtained from experimental curves.

It has been proved both theoretically and experimentally that in PT, there could be two kinds of Ti coordination, 5-fold oxygen–Ti combination (TiO5 square base pyramid) and 6-fold oxygen–Ti coordination (TiO6 octahedron). The coexistence of TiO5 and TiO6 clusters would produce a charge imbalance that enforces hole trapping in the tail states. The oxygen vacancies and surface defects will consequently produce gap states. The PL maxima observable in the range ∼501–518 nm has been attributed to the recombination of these trapped electrons and holes.Reference Liu, Ning, Ren, Sun, Wang, Zhou, Xie, Song, Luo, Liu, Shen, Ma and Zhou25 The semiempirical intermediate neglect of differential overlap calculation performed by Eglitis et al.Reference Eglitis, Kotomin, Trepakov, Kapphan and Borstel26 supports that the green luminescence (∼542 nm) of PT is due to the recombination of self-trapped electrons and holes resulting in the self-trapped excitonic emission (STE).
Apart from the above mentioned four peaks, the 5th peak maxima due to Mn doping was observed at ∼580 nm. This can be attributed to the orange–red emission response by the octahedrally coordinated Mn+2 ions. It is universally accepted that the octahedrally coordinated Mn+2 ions are mainly responsible for the orange–red emission band due to 4T 1g(G) → 6A 1g(S) spin-forbidden transitions, whereas the tetrahedrally coordinate Mn+2 ions give rise to green emission.Reference Yan, Liu, Chen, Da and Wondraczek27 Thus, the 5th peak of the PL spectra, observed at ∼580 nm, corresponded to the orange–red emission of Mn2+. Note that this peak is absent for Mn-free PT sample. The intensity ratio of 5th and 1st peak maxima increases with Mn concentration and was maximum (∼0.51) for 10% level beyond which it drops substantially (e.g., the intensity ratio is 0.12 for 30% Mn level). Referring to 5th maxima, and compared to 1% level, the full width at half maxima (FWHM) was found to be significantly improved (∼140 nm) for 10% level of Mn incorporation. The broadened peak accounts for the radiative transitions accompanied via nonradiative pathways, which might have generated due to the incorporation of Mn ions into the interstitial sites or antisites.
C. Polarization switching and ferroelectric response
In a ferroelectric material, the domain walls, which separate regions with mutually perpendicular polarizations, are called 90° walls and the walls, which separate segments with oppositely oriented polarizations, are called 180° walls. Usually, a square loop is obtained when all the grains of a material system are oriented along the c-axis; however, for a randomly oriented system, the loop suffers tilting.Reference Wang, Zhong, Zhang and Kong28 The coercive field, spontaneous (and remnant) polarizations, and shape of the hysteresis loop generally depend on the thickness of the ferroelectric layer, presence of charged defects, intergrain mechanical stress, thermal treatment, etc.Reference Damjanovic29 Earlier it was proposed that polarization reversal could take place by the growth of existing antiparallel domains, domain wall motion, and by nucleation and growth of newly generated antiparallel domains.Reference Shur and Rumyantsev30 Second, the tilt of the loop depends largely on the extent of the surface dielectric layer on the top of the ferroelectric nanograins. In fact, this layer separates bound charges arising due to the ferroelectric polarization from the compensating charges on the contact electrode. If ds and d f represent the thickness of the dielectric and ferroelectric layers, respectively, and P being the polarization of the ferroelectric layer, then the presence of a surface dielectric layer would induce a depolarizing field given byReference Tagantsev, Landivar, Colla and Setter31: E dp = −P(d s/d f)1/εd. Here, εd is the dielectric permittivity of the surface layer. Considering E aas the applied field, the net field across the ferroelectric system will be:
 $$ & E_{\rm{f}} = E_{\rm{a}} + {\rm{ }}E_{{\rm{dp}}} \quad, \cr $$
The tilt of the hysteresis loop can be defined as the slope of the measured loop at E c:
 $$\left( {{{\partial E_{\rm{a}} } \over {\partial P}}} \right)_{E_{\rm{c}} } - \left( {{{\partial E_{\rm{f}} } \over {\partial P}}} \right)_{E_{\rm{c}} } = \;\,{1 \over {{\rm{\varepsilon }}_{\rm{d}} }}\left( {{{d_{\rm{s}} } \over {d_{\rm{f}} }}} \right)\quad.$$
Note that maximum tilt will correspond to minimum slope and vice versa. As the 2nd term on the left-hand side vanishes for a perfectly square hysteresis loop, the slope of the loop would be solely dependent on the magnitude of d s/d f.
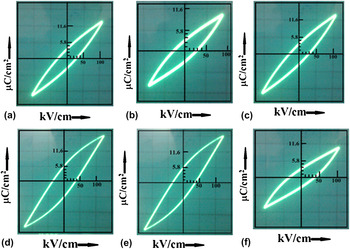
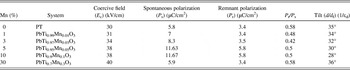
A set of hysteresis loops, obtained at 1.6 kHz, are depicted in Figs. 6(a)–6(f). The characteristic parameters for respective PT samples are also shown in Table II. From the P-E curve of Mn-free PT specimen, the spontaneous (P s) and remnant (P r) polarizations are estimated as ∼5.8 and 3.4 μC/cm2, respectively. The corresponding coercive field (E c) was ∼30 kV/cm. Note that the respective values of P s (and P r) and E c of single crystalline PT are 75 μC/cm2 and 6.75 kV/cm.Reference Sun, Chen, Ma, Wang, Yu, Zhang and Ming3 When one makes a transition from single crystalline ferroelectric to ceramic/thin films containing randomly oriented grains, the intervening forces affecting the domain reversal become more complex as a result of which remnant polarization decreases.Reference Roy and Mohanta32 The substantial decrease in P s (and P r) value and increase in E cvalues in our nano-PT system can be attributed to the intervening forces affecting the domain reversal.
P-E hysteresis curves of Mn-free nano-PT and with 1%, 3%, 5%, 10%, and 30% Mn incorporation.

Mn content versus ferroelectric parameter obtained from hysteresis loops.

As can be found, the P s and P r show an increasing trend with substitutional Mn-doping concentration (up to 10%) with respective magnitudes of 11.6 and 5.8 μC/cm2 for PT system with 10% Mn incorporation. The P r to P s ratio is found to vary within 0.42–0.58. As reported earlier, polycrystalline ferroelectric systems exhibiting only 180° domain walls have P r/P s = 0.25. The value could be as high as 0.83 in case of tetragonal ferroelectrics with six available domain states.Reference Whatmore33 In this context, our Mn-incorporated PT systems seem to be better than polycrystalline state, and we expect significant polarization switching contribution from 90° domain walls, apart from 180° domain walls. It can also be noted that the tilting of the hysteresis loop has a decreasing trend with increase in Mn content and we assign this to suppression of dielectric layer thickness and, hence, d s/d f ratio. As oxygen vacancy-rich regions are considered as an important source of surface dielectric layer,Reference Damjanovic29 we speculate that the oxygen vacancies are adequately reduced owing to inclusion of the Mn ions into the host lattice site. This is also evident from the PL spectra [Fig. 5(B)], which showed suppressed defect-related emission with Mn incorporation up to a critical value. A minimum tilt of 28° was observed for PbTi0.9Mn0.1O3 system. Conversely, beyond a critical concentration of 10% Mn level, the development of a MnO2 dielectric layer might lead to a substantial enhancement in d s/d f ratio and, hence, the tilt. The permissible limit of Mn doping that leads to maximum tetragonality and optical emission has been reported by our group very recently.Reference Roy and Mohanta19 The effect of Mn inclusion into lead zirconia titanate systems was shown to prevent hysteretic fatigue up to thousands of cycles.Reference Zhang34 Similarly, Mn doping led improvement of ferroelectric properties, in case of NKBT [(Na0.85K0.15)0.5Bi0.5TiO3 (NKBT–Mnx)] thin films, has been observed by another research group.Reference Wu, Wang, Zhong and Li35 From the aforesaid discussions, we predict that the polarization switching aspect is likely to be manifested by controlling substitutional Mn doping and forming desired surface dielectric layer in nano-PT systems.
IV. CONCLUSIONS
The PbO-free ferroelectric PT nanostructures that exhibit tetragonal phase were fabricated via inexpensive solid-state grinding cum sintering method. The average crystallite size, as estimated from XRD, was in the range of 34–39 nm. A maximum tetragonality (c/a) of value ∼1.061 was achieved for 10% Mn level case. Mn doping led orange–red emission was revealed at ∼580 nm and is found to be most intense for the optimal Mn concentration. Further, with the increase of Mn content, the intensity of various defect-related emissions (interband, localized state, etc.) tends to vary with respect to the band edge emission. The effect of Mn inclusion on ferroelectric properties has revealed good polarization switching response. The tilting in hysteresis loop was found to be least for 10% Mn level, which witnessed comparatively large remnant polarization than other cases. Adequate magnetic impurity-induced polarization reversal would find scope in all multiferroic switching components where spin–charge interaction is at work. Quantitative correlation with regard to radiative emission and polarization behavior is in progress.
ACKNOWLEDGMENTS
We are thankful to SAIF, NEHU, Shillong for providing HRTEM facility. We also thank Mr. R. Boruah of Department of Physics, TU for extending SEM and EDX facility.