Scholars have long argued that the marginalized racial status shared by ethnic minority groups is a strong incentive for mobilization and coalition building in the United States.Footnote 1 This shared racial-status argument applies well to the case of African Americans, whose group cohesion was forged by the experience of slavery, Jim Crow, and the civil rights movement. Nevertheless, this theoretical tradition does not necessarily square with other groups. Although Afro-Caribbeans and African Americans were both subjected to similar racism in New York City, their presumed alliance faltered because their leaders had conflicting interests regarding the two groups’ descriptive representation.Footnote 2 Despite their shared racial status as “Orientals,” Asian Americans remained divided along national origin lines until a new generation of activists raised their collective voices in the 1960s and 1970s.Footnote 3 A parallel pattern is seen among Latinos, as a coalition between Mexicans, Puerto Ricans, and Cubans was an unrealistic idea before the 1960s.Footnote 4 These cases suggest that race-based coalitions among minorities are not ubiquitous in the United States.Footnote 5 The fact that race has not always been a unifying force for minority groups prompts the following question: Under what conditions do political elites in one ethnic group decide to form a coalition with another ethnic group that shares the same racial status?
To answer this question, it is important to view the American case from comparative perspectives. Because racial hierarchy has long been an integral part of the American political order,Footnote 6 scholars of American politics have rarely challenged the view that coalitions established between racial minority groups are highly likely, if not inevitable. One prominent scholar of racial and ethnic politics commented that although “there is nothing deterministic about race becoming a constitutive organizing principle,” it became “such a principle for the United States, where white supremacy is not an ideology, but a system of power relations that structures society.”Footnote 7 In short, the United States is exceptional because of its deep racial cleavage.Footnote 8
However, if we examine the American racial dynamics beyond black and white, it becomes clear that the United States is not an isolated case of a racially stratified society. Racially charged prohibitions on Chinese immigration in the late nineteenth century occurred in the United States, Canada, and Australia.Footnote 9 Particularly interesting is the comparison between the United States and Canada.
Given their shared legacy of anti-Asian immigration policies and other historical overlaps,Footnote 10 one might have expected the Chinese in the United States and Canada to form coalitions with other Asian ethnic groups when the need for such coalitions arose. The urban renewal projects that swept North America in the post–World War II period offered such an incentive. Most Chinatowns were founded and, thus, located near central business areas that were vulnerable to urban redevelopment. This situation got worse in the mid-twentieth century due to urban renewal policies. In response, community activists in the Chinatowns of San Francisco, Seattle, and Vancouver founded community-based organizations in the 1960s and 1970s based on multiethnic coalitions.Footnote 11 They built these broader coalitions to promote their political agendas: stopping gentrification and building affordable housing. These cities all shared a long history of institutionalized and unregulated violent anti-Asian racism, which marginalized and relegated Chinese and other Asian ethnic groups to a subordinate racial status as “Orientals.”Footnote 12 Nevertheless, whereas race-based coalitions linking Chinese and other Asian ethnic groups appeared in San Francisco and Seattle, a cross-racial coalition between Chinese and southern and eastern Europeans emerged in Vancouver.
This cross-national variation is not the only puzzle. The literature also fails to explain critical subnational and temporal variations. The Asian race-based coalitions in San Francisco and Seattle took different paths. Seattle's Asian race-based coalition for affordable housing predated San Francisco's. This is surprising because the San Francisco Bay Area has been the epicenter of Asian American activism. Indeed, the term “Asian American” was coined by Yuji Ichioka, a Japanese American activist who founded the Asian American Political Alliance at the University of California at Berkeley in 1968. The two coalitions also vary in another important way: While the Chinese in San Francisco built a coalition with Filipinos but not with the Japanese, their counterparts in Seattle included Filipinos as well as Japanese in their coalition. Why did the timing and scope of these two coalitions vary?
In answering these questions, I theorize minority groups as strategic actors because they have huge stakes in almost every political decision they are making or that is made for them due to their lack of resources and influences. If these Chinese lost their battle against gentrification, they would lose their homes and their neighborhoods. For this reason, political elites in one ethnic group decide whether they will ally with another ethnic group that shares the same racial status based on their strategic calculations. They look to minimize coordination costs while maximizing the potential benefits of forming such a multigroup alliance. Specifically, they weigh two factors when choosing a suitable partner: (1) the size of the outgroup and (2) the strength of their social relations with this group. Larger outgroups are useful for asserting political power, but they may also inflate coordination costs depending on whether or not they have close relations with the group making the assessment.
By the time the Chinese needed to choose a coalition partner in the post-1960s political environment, the candidate pool—their friends and neighbors—had already been circumscribed. Immigration policy decided which ethnic groups could enter the country, and segregation policy determined where these groups could live and how they could interact with each other. Therefore, placing the political analyses of the pre- and post-1960 periods into the same framework is crucial to understanding how historical legacies limited the individual agency of how ethnic elites were able to choose coalition partners. The Chinese in San Francisco and Seattle allied with other Asian ethnic groups because these outgroups were large and their members were friends and neighbors of one another. In contrast, their counterparts in Vancouver forged a coalition with southern and eastern Europeans, because for them, these outgroups satisfied the conditions for ideal coalition partners.
In what follows, I first formulate a historically grounded theory of coalition partner selection. I then explain how a combination of exogenous shocks and process tracing helps us understand how this theory applies to each of the three city cases. After describing the extensive archival materials I collected from both the United States and Canada, I compare San Francisco and Vancouver to examine the main theoretical implication, and I use Seattle as an additional test. These findings demonstrate how long-term historical analysis can offer new insights into the study of minority coalition formation in the United States. Previous studies tended to examine either the formative pre-1960 period or the post-1960 years to understand the politics of Chinatown. Some scholars who are interested in pre-1960s Chinatown have focused on how racially motivated policies further marginalized and segregated these communities.Footnote 13 Other scholars who are interested in post-1960 Chinatown have concentrated on how Asian American activism generated a new sense of identity and political mobilization during the civil rights movement.Footnote 14 Looking at only a single historical period tends to blind us to the connections between them—namely, how minority groups exercise their agency and how such agency is shaped by the historical legacies of the political geography of settlement.
1. Theory
There are several reasons for the differences between the United States and Canadian approaches to minority coalition building. Some scholars have emphasized national culture or institutional differences. For example, NgFootnote 15 argued that Canadian multiculturalism offered limited incentives for building a broad coalition. However, this argument does not explain why the Chinese in Vancouver built a coalition with southern and eastern Europeans. If multiculturalism offers limited incentives for building a broad coalition, then it should also discourage the formation of any kind of minority coalition, including a cross-racial one. This claim also overlooks the fact that multiculturalism was neither an official policy nor an internalized Canadian attitude toward immigrant adjustment until late in the twentieth century. The United States and Canada share a much longer history of “racism, nativism, and discrimination.”Footnote 16 Others blame the failure of a parallel Asian Canadian movement.Footnote 17 Nonetheless, new empirical evidence shows that there was indeed such a movement.Footnote 18 In 1967, Ron Tanaka, a Japanese American professor of English at the University of British Columbia, formed a Japanese Canadian student-centered study group. This study group, influenced by the civil rights and black power movements in the United States, soon allied with Chinese Canadian students.
Both approaches, however, fail to reveal the root of divergence, because their seeds were sown much earlier. Coalition building is a function of political opportunity and is shaped by the strength of the coalition partners and the alignment of their interests. Both are shaped by past histories of migration and settlement patterns. Therefore, the long-term historical perspective is imperative to examining the underlying connection between their antecedents and outcomes.Footnote 19 I expand this idea here by proposing my theory for how candidates for a minority coalition are selected.
1.1. Clientelistic Politics in Chinatown
The Chinese exclusion acts of the late nineteenth century made the Chinese the first group to be racially excluded by the immigration policies in the United States and Canada.Footnote 20 Nonetheless, these restrictive immigration measures did not stop all Chinese immigration to North America. In the United States, the Chinese Exclusion Act of 1882 exempted merchants, teachers, students, and travelers; in Canada, the Chinese Immigration Act of 1885 did not apply to merchants, diplomats, and students. This differentiation left the door open to both the educated and the privileged. In addition, the definition of who was and was not a “merchant” was left to bureaucratic discretion.Footnote 21 This loophole made it possible for ethnic Chinese brokers to maintain a weak but constant stream of Chinese immigration by disguising Chinese laborers as merchants.Footnote 22
This doubly biased immigration system created a legal and class hierarchy in North America's early Chinese society. At the top of the hierarchy, merchants enjoyed both legal protection and economic security. At the bottom, laborers languished in legal as well as economic uncertainty. The merchants also had both sticks and carrots. Until the 1960s, the United States and Canadian governments neglected Chinatown. The Chinese Benevolent Association (CBA), a merchant-led mutual aid society, was Chinatown's unofficial government. The CBA controlled the agenda of the Chinese community in three ways. First, it offered financial assistance to the poor; provided old-age pension, health, and unemployment insurances; and even paid for the funeral services of its members.Footnote 23 Second, the CBA acted as court judges and settled disputes between both groups and individuals. Finally, it controlled the trade guilds, such as wholesale merchandising, tailoring, barbershops, women's underwear, and laundry. These were the industries that employed most of the Chinese laborers.Footnote 24
These merchants’ interests drove the CBA's conservative approach. In the late nineteenth and early twentieth centuries, Chinatown was viewed by government officials, as well as the public in North America, as an exotic, unsanitary, and crime-ridden place. Instead of resisting the cultural stigma associated with Chinatown, the CBA took advantage of it and turned Chinatown into a tourist-friendly theme park. Such selling of Orientalism to white tourists dates as far back as the 1880s in San Francisco.Footnote 25 The tourism industry benefited the Chinese merchants who owned restaurants, gift shops, and other small businesses; increased the tax revenue for the city government; and forged a strong political connection between them.Footnote 26
1.2. Immigration Reform and the Housing Crisis
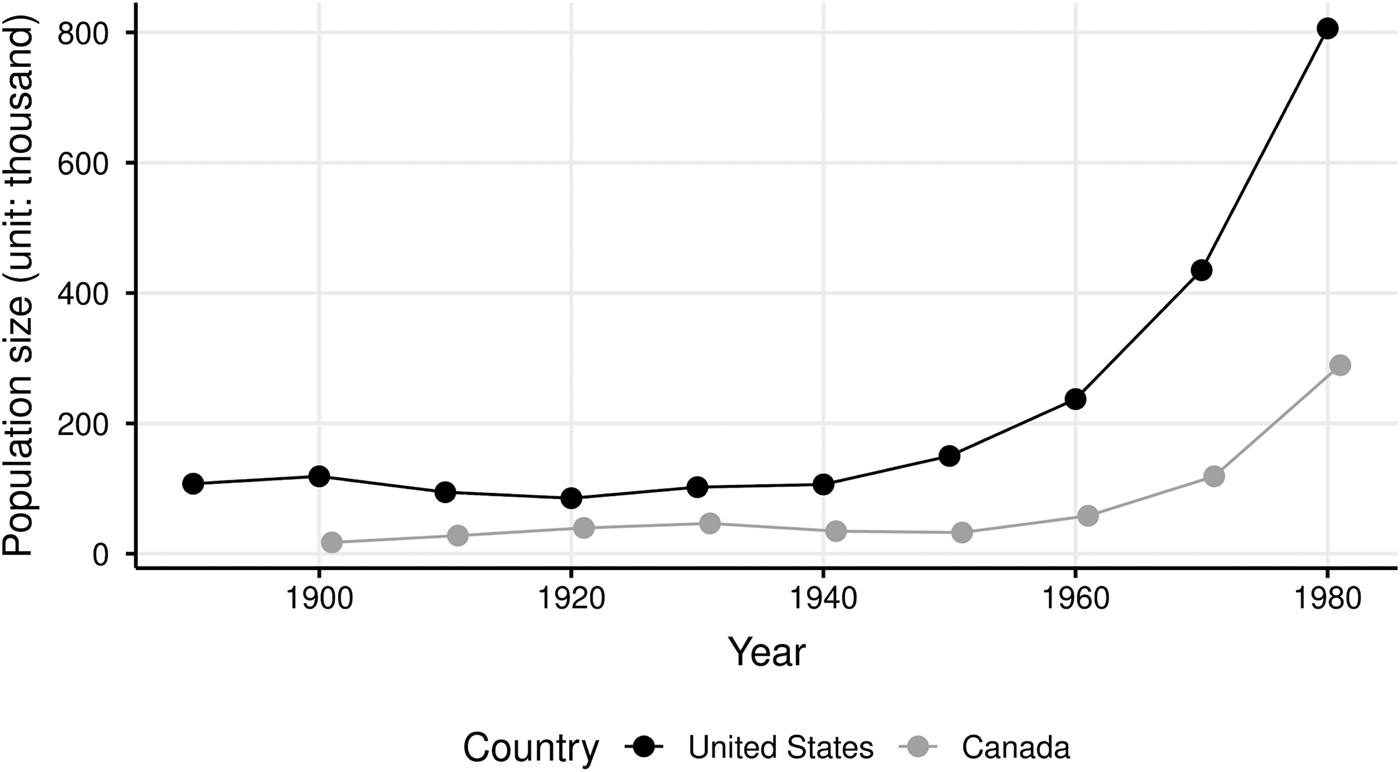
The resumption of Asian immigration presented the CBA and its merchant supporters with a grave challenge. To begin with, the U.S. repeal of the Chinese Exclusion Act in 1943 and that of Canada in 1947 ended the legal privilege enjoyed by the merchants. In addition, the CBA did not have enough carrots to help the newcomers. When legal immigration resumed, the Chinese population in the United States and Canada had grown exponentially since the 1960s (Figure 1). As a result, the shortage of housing became a serious social problem. More than 90 percent of the residential dwelling units in New York's Chinatown during the 1960s had been constructed before 1901 and had chronic problems related to pests, plumbing, and wiring. Some apartments did not even have heat or refrigeration.Footnote 27 The situation was not much different in San Francisco's Chinatown, the oldest in North America. Further, whereas the majority of Chinese immigrants had been laborers in the past, the new wave of Chinese immigrants included a substantial number of well-educated members of the middle class. These new affluent Chinese bypassed the old Chinese communities and created “uptown” or “satellite” Chinatowns in suburban locations in American and Canadian cities.Footnote 28 This geographical separation of the affluent and poor Chinese communities exacerbated the inequality within the group, as the old and the poor remained in the urban core, whereas those with means moved to the suburbs.Footnote 29
The Chinese Population in the United States and Canada. Sources: U.S. Census, the American Community Survey, the Census of Canada, and the Canadian National Household Survey.

The younger generation of leaders who grew up in Chinatown as children of immigrants played an important role in addressing these issues. These new Chinatown elites were educated and employed outside the traditional Chinese businesses, such as restaurants and laundry industries. In addition, for the traditional elites, who had lived through the exclusion acts, challenging the status quo was unthinkable. For the new elites, who had but a faint memory of the exclusion acts and who had come of age in the era of the civil rights movement, a radical turn in their activism was both desirable and necessary. Chinatown residents distinguished these two groups by calling the traditional elites “Kiu Ling” (leaders of the overseas Chinese) and referring to the new elites as “Chuen Ka” (experts in social problems).Footnote 30 These new elites considered the selling of Orientalism to white tourists to be a shortsighted strategy.Footnote 31 However, given the interdependence of Chinatown's commercial and residential areas, anything that affected one also affected the other.
These new actors appeared on the stage at the right time. In the previous generation, restrictive immigration and other discriminatory policies had protected the merchants’ privileged status in the community. In the 1960s, the pendulum swung the other way. In the United States, President Lyndon B. Johnson's War on Poverty programs expanded the benefits of the welfare state to nonwhites.Footnote 32 In Canada, the Liberal Party government announced the Canadian version of the War on Poverty in 1965,Footnote 33 and its by-product, the Canada Assistance Plan of 1966, played a parallel role.Footnote 34 Thanks to these new access points to power and resources, people who organized public protests, navigated the bureaucracy, and wrote grant proposals began to take a more prominent role in their own communities. In addition, the “policy feedback effect”Footnote 35 made the relationship between these new elites and the government closer. As the new elites gained more political knowledge and became more deeply connected to politicians and bureaucrats, they were able to gain more access to both power and resources. In turn, politicians and bureaucrats began to rely more on these intermediary actors to deliver services to the diverse minority communities at lower transaction costs.Footnote 36
1.3. Rightful Resistance and Minority Coalition Building
In terms of housing policy, the new elites had more complicated and ambitious goals. Their short-term objective was to stop further gentrification and replacement in Chinatown. Yet, this did not mean that they were satisfied with the status quo—the deteriorating housing conditions in Chinatown. For this reason, their long-term goal was to build low-cost housing for Chinatown's poor and elderly residents.
These new elites used what O'Brien and LiFootnote 37 have called “rightful resistance” to accomplish their political objectives. The idea of rightful resistance rests on the divided house. The weak cannot fight a stronger opponent by meeting force with force. If conflicting interests can split a strong opponent, however, “this division among the powerful” presents an opportunity that the weak can then exploit. In rural China, peasants can fight against corrupt local governments by using the discourse approved by the central government. The weak can go beyond everyday resistance by capitalizing on “the potent symbolic and material capital made available by modern states.”Footnote 38
There was also a division among the powerful in twentieth-century North America. Local governments depend on property and sales taxes. From their perspective, commercial redevelopment is attractive because it can increase their revenues. Furthermore, the competition between local governments limited their options.Footnote 39 Cities followed a policy trend of forcing out low-income residents and replacing housing with office buildings in order to remain competitive and draw new investment. In contrast, the federal government relies on income, payroll, corporate income taxes, and other levies. As such, its interests are much less geographically concentrated. By the late 1950s, urban renewal was under attack for evicting low-income and minority residents without finding alternative housing for them. The Model Cities Program, a major urban policy during the War on Poverty, was introduced to appease this criticism by incorporating citizen participation in the rehabilitation process.Footnote 40 In Canada, the Neighborhood Improvement Program and the Residential Rehabilitation Assistance Program were enacted in the early 1970s to achieve the same policy goal.Footnote 41 To target the federal government, minority groups thus had to intensify their strategy. Bureaucrats, for instance, prefer meeting the demands of several groups through one large coalition in order to minimize their coordination costs. Politicians likewise prefer this strategy because it allows them to reach a more significant number of voters at a lower transaction cost. Therefore, minority groups have good reason to expect the government to be more responsive when they stand united.Footnote 42 For Chinese activists, the goal of building a broad—or more precisely a multiethnic—coalition was to enlarge their group so as make a wider appeal to both bureaucrats and politicians. In that sense, it would be better for them to choose a large group as a coalition partner.
Nonetheless, partnering with a large group is not always ideal, because coalition building entails constant negotiations between the prospective partners. Consider the following case. A Chinese community might have two prospective partners. One group might be larger but has little interaction with the Chinese community. Therefore, if these two groups formed a coalition, they would have to start from scratch. The other group might be smaller but still has a close intergroup relationship with the Chinese community: friends and neighbors. In terms of the cost of building and maintaining a coalition, partnering with the smaller group is less risky.
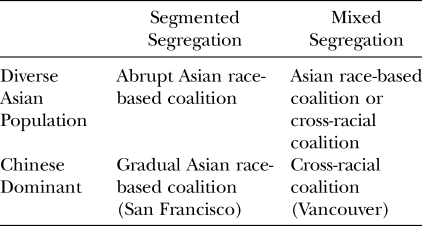
In sum, activists should choose a candidate based on two parameters—namely, the size of the candidate group and the strength of the intergroup contacts between themselves and their potential partner. The strength of these intergroup contacts is measured by the geographic proximity between the communities, as well as by whether they share public spaces, such as schools, workplaces, and commercial areas, and how long and how frequently they contact each other. For strong intergroup contacts, geographical proximity is necessary, but it is not sufficient without shared public places where social interactions can emerge and be well institutionalized.Footnote 43 Of the shared public spaces, schools are particularly crucial because they form social networks among children who later become coalition members. Table 1 summarizes the options for candidate-selection strategies within these two parameters.
Candidate Selection Strategy and Expected Coalition Outcomes

A host of studies has underscored the importance of these parameters when building a multiethnic coalition. Posner notes that Chewas and Tumbukas are allies in Zambia but adversaries in Malawi; the difference is in the sizes of their populations in each country.Footnote 44 From the perspective of political elites, these ethnic groups are politically useful only when there are enough of them to increase the elites’ chances of winning in a competitive election. Fearon and Laitin argue that intergroup relations can determine whether or not ethnic conflicts can be escalated and resolved at the early stage of intergroup conflict.Footnote 45 Having strong intergroup contacts can help pinpoint the sources of disagreements and resolve them.
Contrast this scenario with the case of weak intergroup contacts and their resulting political effects. For instance, Enos found that introducing two Spanish-speaking people in white homogeneous communities can cause exclusive attitudes among the white residents.Footnote 46 Though Enos's study focuses on mass behavior, it has implications for how ethnic elites mobilize their group members. If weak intergroup contacts can harbor exclusive attitudes rather than mutual trust, they offer negative incentives for the elites in either group to argue for coalition building. My theory draws on these works and expands their insights by highlighting the need to create a careful balance between the size of the groups and their intergroup contacts.
1.4. The Limitations of Agency
Past patterns of migration and settlement determined the Chinese choice of their coalition partner. Native hostility and housing discrimination created Chinatowns.Footnote 47 Other ethnic minorities living within or near Chinatown faced similar discrimination. These historical legacies are crucial to understanding how the agency of minority groups was circumscribed. Here, the main insight is that group identities based on place can both unite and divide racial groups. Specifically, how a place is racially segregated along vertical and horizontal dimensions is critical to understanding the conditions under which ethnic minorities build race-based coalitions.
Broadly put, the political geography of settlement consists of two major policies. First, immigration policy determined which ethnic groups and how many of them settled in each city. Second, segregation policy in housing and schools set boundaries between the immigrant groups and the strength of their intergroup contacts. As our focus here is on minority coalition formation, it is important to understand how segregation policy affects both the relationships between dominant and subordinate groups and the relationships between subordinate groups. The demarcating line between dominant and subordinate groups is the vertical dimension of the segregation. This is determined by the dominant cleavage in a respective country, whether it is race, ethnicity, class, religion, or language. The demarcating line between subordinate groups can be either rigid (segmented segregation) or porous (mixed segregation). This line becomes the horizontal dimension of segregation.
As a marginalized group, the Chinese had little control over these policies. Therefore, when the time came for the Chinese to decide who would be their ideal coalition partner during the 1960s and 1970s, their neighbors and friends were determined by these past legacies.
As the next step, we examine the way in which the interaction between these two sets of policies shapes minority coalition formation. Immigration policy can create a different combination of Asian populations, a set of Asian ethnic groups of equal size, or a Chinese population that is disproportionately large as compared to other Asian ethnic groups. If the size of the Chinese population was not overrepresented among Asian ethnic groups, they would have a strong incentive to build a coalition with other Asian ethnic groups, because they would have little faith in their capacity to achieve their desired policy goals on their own. Further, if segregation policies prevented Asians from interacting with other racial minority groups, then forming a coalition with other Asian ethnic groups would be their only option (Seattle). Nonetheless, if they were not segregated from other racial minorities, the Chinese could then compare the sizes of the Asian and non-Asian ethnic groups and make a choice between an Asian race-based coalition and a cross-racial-based one.
In contrast, if the Chinese were overrepresented in the Asian ethnic groups, they would likely have stronger faith in their own capacity to achieve their policy goals without outside help. As such, they would then have a weak incentive to form a coalition with other Asian ethnic groups. Again, however, if they were prohibited from interacting with other racial minority groups, then forming a coalition with these other Asian ethnic groups would remain their only option. Nonetheless, they would not pursue this option immediately because they might be tempted to try out and accomplish their policy goals on their own. Given this scenario, an Asian race-based coalition would still likely emerge, albeit more slowly (San Francisco). If the Chinese were not prohibited from interacting with other racial minority groups and if some of these other groups were even larger than the Asian ethnic groups, the Chinese would likely consider a cross-racial coalition (Vancouver). Table 2 summarizes these different possible strategic decisions.
The Interaction between Immigration and Segregation Policy and Coalition Outcomes

2. Empirical Strategy
A comparison of the coalitions for achieving affordable housing in the Chinatowns of San Francisco, Seattle, and Vancouver in the 1960s and 1970s offers a great avenue to test this theory. These controlled comparisons are ideal cases for two reasons.Footnote 48
Narrowing the analytical focus to a common issue (housing) in these cases helps maximize the control over alternative explanations. These Chinatowns, located in three gateway cities for Chinese immigrants in the West— San Francisco, Seattle, and Vancouver—are similar in their origins and in their early community power structures. Most of the early Chinese settlers in these cities came from Taishan, Zhongshan, Xinhui, Shunde, Haoshan, and Nanhai counties in Guangdong province in China.Footnote 49 For these immigrants, the region between California and British Columbia was the “Gold Mountain” (Gam Saan in Cantonese). Based on these regional and family ties, the CBA, an umbrella organization made up of Chinese family and regional associations, was established in San Francisco in 1882 and soon had branches in Seattle in 1892 and Vancouver in 1896.
Despite their shared initial conditions, these cases represent different kinds of minority coalitions. The San Francisco Chinatown housing advocacy organization was an Asian race-based coalition, while its Vancouver counterpart was a cross-racial coalition. Similarly, an Asian race-based coalition emerged early in Seattle's Chinatown, but it encompassed a wider set of groups. Therefore, while limiting alternative explanations, this case-selection strategy increases the variations found in the coalition outcomes.
These controlled cases were selected not only for methodological but also for theoretical reasons; they are useful for applying counterfactual thinking.Footnote 50 What if the proportion of Chinese were smaller among Asian ethnic groups, as in Vancouver? What if they were a larger group, as in Seattle? What if there were little segregation between Asians and whites, as in San Francisco? While the theory does help predict how the changes in each parameter might have led to different outcomes (Table 2), the case studies allow us to clearly assess the validity of these different theoretical implications.
2.1. Two Exogenous Shocks
This case-selection strategy does, however, have some limitations, because it is virtually impossible to know all the differences between the various cases that might have influenced their outcomes. Moreover, immigration and segregation policies may have affected other factors beyond the two parameters under study here. To address these concerns, I leveraged two exogenous shocks that affected the distribution of minority groups in these three cities. The 1906 San Francisco earthquake destroyed a portion of Chinatown and forced the Japanese residents to move to the undamaged Western Addition. Before the earthquake, Chinese, Japanese, and Filipinos in both San Francisco and Seattle lived in close proximity. After the earthquake, a higher physical and social barrier was created between the Chinese and Japanese in San Francisco. To take full advantage of this exogenous shock, I added a within-case analysis to the between-case analyses: I examined why within San Francisco, the Chinese built a coalition with the Filipinos, while the Japanese built one with African Americans.
The second exogenous shock I employ is the internment of Japanese, which was much longer and harsher in Canada (1942–1949) than in the United States (1942–1946). It reduced the number of Japanese far more significantly in Vancouver than in San Francisco and Seattle. This second exogenous shock helps us better understand how the San Francisco and Seattle cases worked as a missed or counterfactual case vis-à-vis Vancouver. Had this shock not occurred, the coalition-building dynamics among San Francisco, Seattle, and Vancouver might have been much closer,
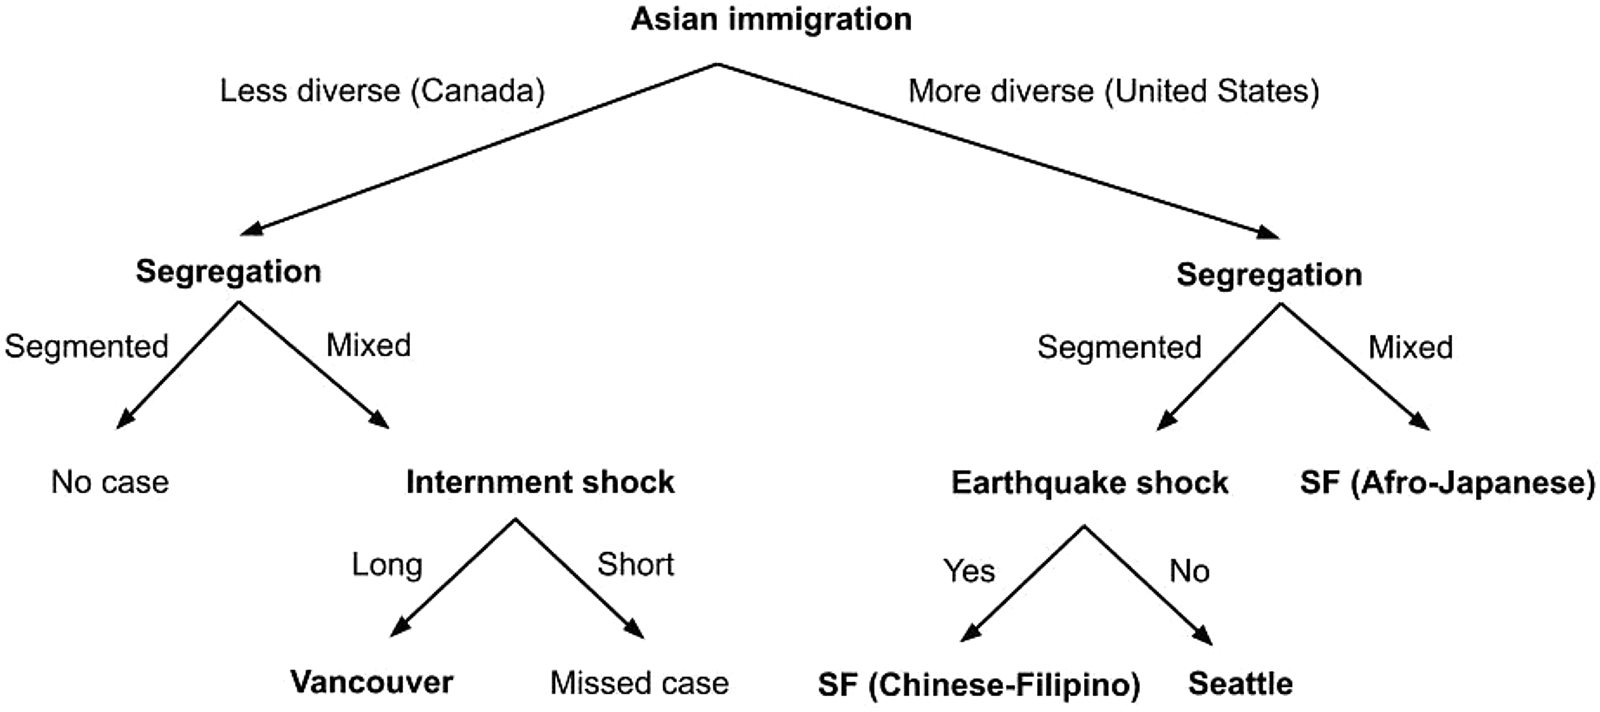
2.2. Tracing Causal Sequences
The goal of my empirical strategy here is to pay close attention to sequences of independent and dependent variablesFootnote 51 and examine whether they are consistent with the theoretical expectations laid out in Tables 1 and 2. The pre-1960s was a “critical juncture”Footnote 52 because there were several ways to determine the distribution of ethnic minorities. However, the combination of the exogenous forces (natural disasters and outside forces) and certain endogenous events did work to determine a particular distribution of ethnic minorities in each case. These conditions then narrowed the range of possible coalition options for the Chinese in the later period (Figure 2). Therefore, proper tests for such path-dependent logic must closely examine the temporal dimension by tracing causal sequences. Consequently, this investigation began with the pre-1960s. For the sake of simplicity, I first compared the San Francisco and Vancouver cases to examine the main theoretical implications and then used the Seattle case to strengthen this argument further. The following are the key processes examined to test the theory. If the processes are consistent with the theoretical implications, then the theory is valid. If not, then the theory misses important aspects of the underlying causal mechanisms.
Theoretical Implications.

2.2.1. The Pre-1960s
• Process 1: How immigration, segregation policies, and the two exogenous shocks influenced the distribution of non-Chinese minority groups and their relations with the Chinese.
2.2.2. The Post-1960s
• Process 2: How the size of non-Chinese minority groups and the contacts between the Chinese and these other groups led to the formation of a different kind of minority coalition.
2.3. The Archival Data
To do process tracing, I consulted underutilized archival data from the Asian American Studies Collection at the Ethnic Studies Library; the Western Americana Collection and Catalogue II of the Regional Oral History Office (1980–1987) in the Bancroft Library at the University of California, Berkeley; the Strathcona Property Owners and Tenants Association Collection in the City of Vancouver Archive; the archive of the International Examiner (a free biweekly Asian American newspaper based in Seattle); and other primary and secondary materials, including historical statistics from the U.S. Census and Statistics Canada.
3. Comparing San Francisco and Vancouver
3.1. Immigration Policies
Chinese and Japanese immigrants in the United States and Canada share their origins. The discovery of gold in the region between California and British Columbia drew Chinese immigrants to North America in the 1850s. Although these Chinese immigrants were not able to find jobs in gold mines due to the hostility of white miners, they did find employment in the railroad industry and labored for the construction of transcontinental and other railroads in each country.
As the economic opportunities were present mainly in the West, most of these Chinese immigrants settled in this region. Between 1880 and 1881, while 96.1 percent of all Chinese Americans were living in the eleven western states and territories, 99 percent of all Chinese Canadians were found in British Columbia. Of these places, San Francisco and Vancouver stood out as the two major points of entry for the Chinese population in North America. Between 1880 and 1920, San Francisco's Chinatown contained between one-fifth and one-eighth of the total Chinese population in the United States. Between 1911 and 1921, Victoria and Vancouver held around 25 percent of the Chinese Canadian population.Footnote 53
Japanese immigrants started to come to the United States (1868) and Canada (1877) slightly later than the Chinese immigrants did. Like their Chinese counterparts, most of these Japanese immigrants first settled in big cities in the West, such as San Francisco, Seattle, and Vancouver; later, they also moved to rural areas to exploit the better economic opportunities in agriculture and fishing. Even when the adoption of the Chinese exclusion acts in the United States (1882) and Canada (1885) capped the growth of the Chinese population in each country, Japanese immigration continued for some time, because both the United States and the Canadian governments took a more cautious approach toward Japan, which was then an emerging colonial power. The Japanese were prohibited from entering the United States in 1924 and Canada in 1941.Footnote 54
In addition, until the late nineteenth century, state control at the United States and Canadian border was not so strict, so there was a constant mix of the Chinese and Japanese population between the two countries. Chinese and Japanese migrants could arrive in Vancouver and then move to Seattle or San Francisco without even holding a visa.Footnote 55 For this reason, Chinese and Japanese laborers frequently crossed the border to find better economic opportunities. The situation changed when many Chinese migrants entered the United States through the back door of Canada after the passage of the Chinese Exclusion Act and, thus, became the nation's first “illegal immigrants.”Footnote 56 To stop these immigrants from crossing the border, the U.S. government started to work more closely with the Canadian government and replaced poorly coordinated customs offices with “courts, processing and detention centers, border patrolmen, and immigration inspectors.”Footnote 57
As many historians have pointed out, there are strong transnational aspects in the story of Chinese and Japanese immigration to North America,Footnote 58 and when we turn our attention to other Asian ethnic groups, differences emerge. Although both countries are nations of immigrants, the United States is distinct from Canada because of its extensive history of military involvement in foreign territories. In the aftermath of the Spanish-Cuban-American War in 1898, the United States acquired the Philippines along with Puerto Rico, Guam, and the Hawaiian islands. For this reason, even after the U.S. immigration laws had barred the entry of the Chinese and Japanese, as U.S. nationals, Filipinos were still able to emigrate to the United States. By 1930, 108,260 Filipinos were living in the United States, with their geographical concentration on the West Coast,Footnote 59 and filling the labor demand created by the exclusion of the Chinese and Japanese in that region.Footnote 60 Even after the Philippines gained independence from the United States in 1946, the presence of the U.S. military in the Philippines still boosted Filipino immigration to the United States through marriages to U.S. citizens stationed there (war brides) and through the granting of U.S. citizenship to Filipinos who served in the U.S. Navy.Footnote 61 According to the War Bride Act of 1945, the war brides and children of Filipino veterans became American citizens.Footnote 62
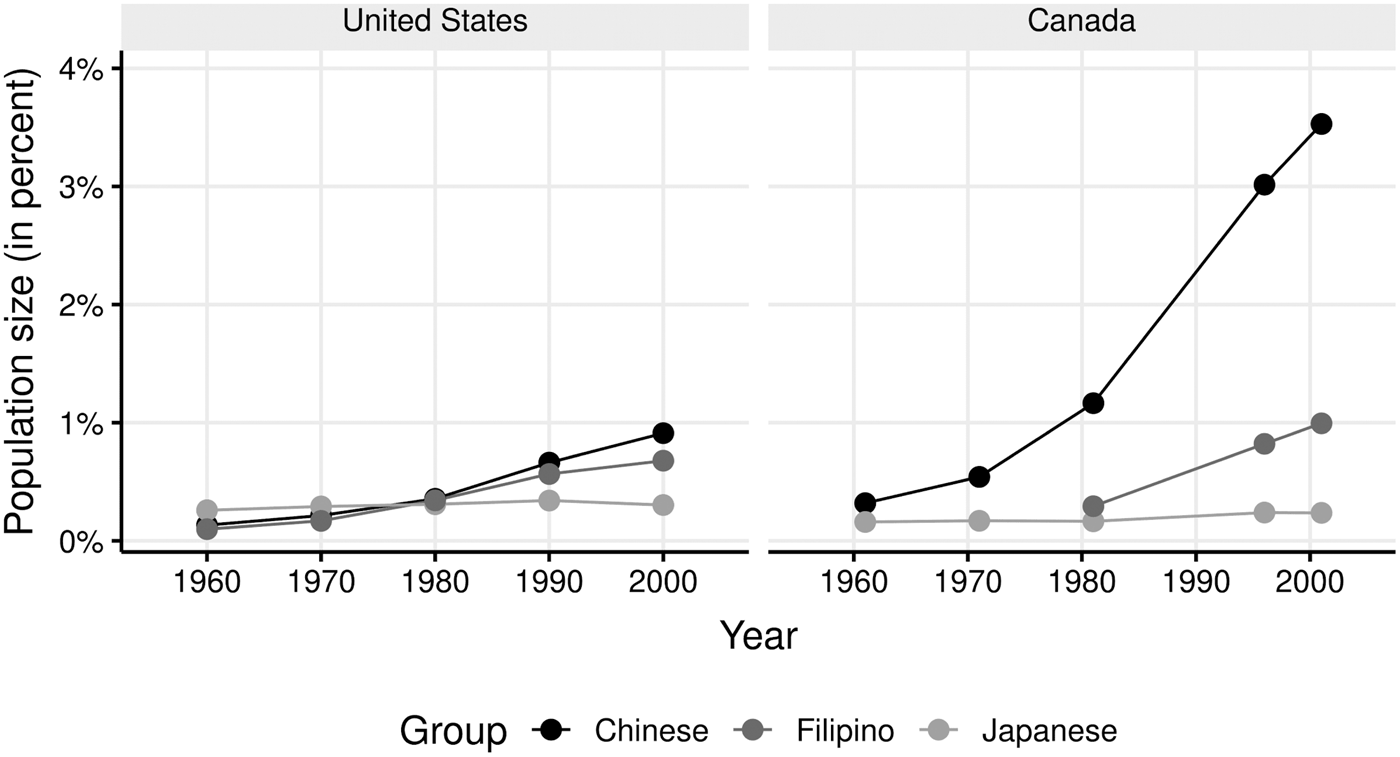
In contrast, Canada never had foreign possessions.Footnote 63 No exempted Asian ethnic groups existed in Canada during their era of restrictive Asian immigration. Large-scale Filipino immigration began in Canada in the 1980s and 1990s, several decades after that country reopened its door to Asian immigrants. As a result, as Figure 3 shows, whereas the Chinese and Japanese were the two main Asian ethnic groups in Canada in the 1960s and 1970s, a balanced mix of Chinese, Japanese, and Filipinos constituted the Asian communities during the same period in the United States.Footnote 64
Asian Populations in the United States and Canada, 1960–2000. Sources: U.S. Census, American Community Survey (1960–2000), the Census of Canada (1961–2001), and Canadian National Household Survey (1996).

In addition, the United States and Canada treated their Japanese subjects differently in subtle but important ways. The growing Japanese population and their success in the agricultural industries in California, Washington, and British Columbia caused a nativist backlash that restricted Japanese political and economic rights. In the United States, Japanese nationals were targeted by the Alien Land Law and prohibited from owning land. They were also ineligible for naturalization, because the nationality law granted that right to only “free white persons” and persons of African nativity or descent. Nonetheless, the Fourteenth Amendment still provided birthright citizenship to U.S.-born Japanese. These Japanese were able to vote and own land. In contrast, Japanese Canadians, regardless of their citizenship status, could not vote until 1948. The British Columbia government indeed passed a series of laws limiting the Asian franchise in the late nineteenth century. The Chinese thus lost their right to vote in 1874, and the Japanese in 1895. This lack of voting rights also restricted their opportunities for upward social mobility, because certain professional organizations, such as bar associations, accepted only people who were eligible to vote.Footnote 65
More importantly, the internment of Japanese was longer in Canada (1942–1949) than in the United States (1942–1946). Whereas the U.S. government only temporarily froze assets of the Japanese Americans during World War II, Canada permanently confiscated all of the property of Japanese Canadians.Footnote 66
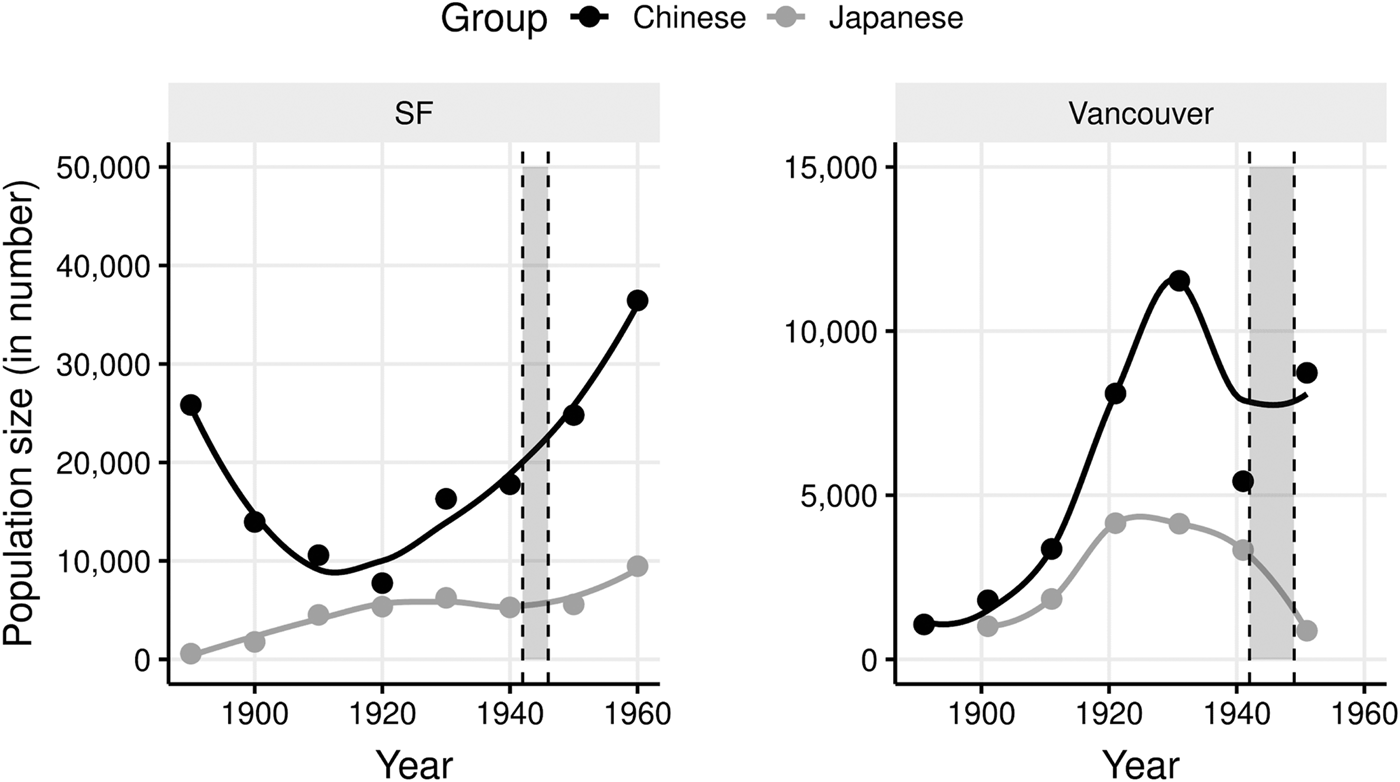
This harsher treatment of Japanese Canadians resulted in a dramatic decrease of the Japanese population in Vancouver relative to San Francisco. More than 5,000 Japanese were living in Japantown in San Francisco in 1940. The majority of them were interned during the war. Only half returned to San Francisco when the war was over,Footnote 67 but within two years, San Francisco's Japanese American population had returned to its prewar size.Footnote 68 In contrast, the Japanese population in Vancouver decreased from about 8,000 to 1,000 during World War II.Footnote 69 Most of the former Vancouver residents decided not to come back and started new lives on the East Coast or the Prairie Provinces.Footnote 70 This was not because they had no emotional attachment to Vancouver, nor were other provinces more hospitable toward the Japanese; public opinion polls showed that there were few differences between the residents in British Columbia and those in other provinces in terms of their attitudes toward the Japanese.Footnote 71 But these Japanese, who were forced to relocate during the war, lost their entire social and material connections to Vancouver. Some did visit Vancouver after the internment was over, only to find that the things they were attached to—the shops, the restaurants, and their Japanese neighbors and friends—were all gone.Footnote 72 As a consequence, Vancouver's Japantown vanished and became an industrial area, now known as Railtown. Figure 4 depicts the contrast between the two cities. The x-axis indicates the year, and the y-axis indicates the size of the Chinese and Japanese populations per year. The dashed red lines and the shaded area show the years in which the Japanese were interned in each country. The Chinese and Japanese populations were the two largest Asian ethnic groups in these two cities from the late nineteenth to the early twentieth century. In terms of size alone, the Japanese were the ideal Asian partner for the Chinese to build a coalition with in both cities. Had the Japanese internment been shorter in Canada, the Chinese would likely still have considered forming a coalition with the Japanese.
The Size of Chinese and Japanese Population in San Francisco and Vancouver. Sources: U.S. Census (1890–1950) and the Census of Canada (1891–1951).

3.2. Segregation Policies
There was no clear border established between Asian and non-Asian minority neighborhoods in Vancouver's East End. By the late nineteenth century, the affluent Anglo-whites had moved to the West End and Shaughnessy. As a result, the East End was left to foreign laborers, comprising mostly single men from China and southern and eastern European countries. Ethnic enclaves of Chinese, Japanese, Italians, Ukrainians, Jews, and Norwegians were located close together in Vancouver's working-class neighborhood.Footnote 73 This close geographical proximity allowed these groups to develop long-lasting social relationships and mutual trust. Myer Freedman, a Polish Jewish immigrant and local businessperson, recalled that he had many Chinese friends and customers and considered Chinese “the most trustworthy people” because even though they were tough buyers, they kept their word. He also remembered how the Chinese customers respected his father's Jewish religion. When his father closed his logging supply store on Saturdays to observe his Jewish religious tradition, the Chinese customers did not deal with other suppliers but, rather, visited his father's store on the other weekdays.Footnote 74
Total segregation was never imposed in Vancouver, and indeed Chinese students went to school with Japanese, Italians, Jews, Scandinavians, Russians, Ukrainians, and blacks. Locals called the Strathcona School, which these students attended, the “League of Nations.”Footnote 75 The children growing up in this mixed neighborhood became close and were able to cross their ethnic boundaries easily. Mary Velijac, a second-generation Croatian immigrant, recalls
If someone [Japanese] passed away, we went to their Buddhist temple, you know. Any affairs that the Italians had, we went to. Any affairs we had, the Italians went to. I had Jewish girl friends. We went to their synagogue the days that you could go. We were just like an one family.Footnote 76
The boundary between whites and Asians was more rigid in the United States than in Canada. In California, racial segregation in schools is as nearly old as the public school system. In 1855, the state legislature directed that school funds be apportioned to counties based on “a census of white children.” After the Civil War, the Fourteenth Amendment gave Native American and African American students the right to attend white schools in communities in which there were no separate schools. However, Chinese students, whom state officials considered “almost hopeless,” could not benefit from this policy change. In 1885, when Chinese parents brought the issue to court, the State Assembly finally admitted Chinese students to “the Chinese school.” In 1906, the city government renamed it the Oriental Public School to segregate other Asian students along with the Chinese. Even after the overturning of de jure segregation in U.S. public schools in 1954 in the Supreme Court's Brown v. Board of Education decision, almost all Chinese students attended de facto segregated schools during the 1960s.Footnote 77
San Francisco's non-Anglo white populations were more deeply integrated into mainstream society than were Vancouver's. San Francisco's Chinatown is located right next to Little Italy (North Beach). Nonetheless, the interactions between them were limited. After 1945, the Italians in the city were quite assimilated. The percentage of Italians living in San Francisco's Little Italy declined from 80 percent to 33 percent between 1940 and 1970. Affluent Italians left San Francisco for the Marina, while working-class Italians moved to the Excelsior and Bay View districts.Footnote 78 Although San Francisco has had several Italian mayors since Angelo Rossi in 1931, no Italian Canadian has ever been the mayor of Vancouver. Most Vancouver mayors have either English, Scottish, or Irish family names, with only a couple of exceptions.
Both school and residential segregation created different relational dynamics between the Chinese and other ethnic groups in San Francisco and Vancouver. The Chinese in San Francisco had more interaction with other Asian ethnic groups than with whites. In contrast, the Chinese in Vancouver became more integrated with the white population, especially in their neighboring southern and eastern European communities.
3.3. Minority Coalition Building
3.3.1. San Francisco's Chinatown
These historical legacies influenced the formation of Chinatown-based minority coalitions for affordable housing. The first large wave of Chinese immigration to San Francisco started in 1849, the year after gold was discovered in California and the city of San Francisco was founded. The Chinese were an integral part of the city from its inception. However, racial discrimination isolated their presence to a small, rundown area for most of the city's early history.Footnote 79 In response, a movement for better housing began growing in the 1930s as the government began to increase its political influence in the housing market. Nonetheless, it wasn't until 1940 that the San Francisco Board of Supervisors recognized the housing problem in Chinatown. In 1948, the city's Redevelopment Agency was established to focus on urban renewal. From the 1950s through the 1960s, the agency transferred $128 million in federal funds for urban renewal projects and turned downtown San Francisco into a marketable product for sale.Footnote 80 The city government tried to eliminate Chinatown straight out, instead of preserving its old neighborhood. The 1965 immigration reform exacerbated these problems because of the massive increase in the number of Chinese immigrants. The lack of low-cost housing for low- and moderate-income families thus emerged as a critical issue.Footnote 81
Nevertheless, the CBA was still more concerned with attracting and maintaining white customers. Against this backdrop, in August 1968, hundreds of community activists and students held a demonstration in Chinatown, holding signs that read “Chinatown is a ghetto” and “Tourists out of Chinatown.” During this protest, Rev. Larry Jack Wong criticized the CBA and the city government, saying, “No longer can the Chinese Six Companies [the CBA] speak for all of us! No longer can City Hall ignore us. We will continue to march until we get something done!”Footnote 82
The War on Poverty programs during the 1960s and 1970s empowered this new generation of activists. The Economic Opportunity Council created “front money” for poverty councils and related organizations to build low-cost housing. Rev. Wong also became the highest-ranking Chinese American on the Economic Opportunity Council in San Francisco's Chinatown.Footnote 83 The U.S. Department of Housing and Urban Development (HUD) was essential in providing new resources. It offered rehabilitation grants to urban renewal areas, low-interest loans for low- and moderate-income housing, and direct loans for housing senior citizens; supported low-income and experimental housing demonstration projects; and ran rent-supplement programs.Footnote 84 The 1968 Housing Act opened a new channel of communication and participation by emphasizing homeownership among the poor, housing for low- and modest-income families, and rehabilitation over slum clearance. In that same year, the HUD began to invite new projects involving residential rehabilitation to form a Project Area Committee and increase participation in both the planning and implementation of these projects.Footnote 85
The impact of this policy change was evident in the increased citizen involvement in planning. With financial assistance from the HUD, the city government, the San Francisco Foundation, and the San Francisco Department of City Planning conducted a comprehensive survey in the Chinatown and North Beach area in 1970. To this end, the Chinatown Advisory Committee comprised representatives from Chinatown community organizations and related interest groups. The committee produced a 159-page report, entitled the 701 Study, which exposed the magnitude of the housing problem in Chinatown. The title was written both in English and Chinese characters and incorporated some of the key community concerns, such as the lack of any recreational area in Chinatown.
To fulfill the study's recommendations, Rev. Harry Chuck (Chinatown Advisory Committee cochair) and Linda Wang (Housing Subcommittee chair) founded the Chinatown Coalition for Better Housing (CCBH) in 1972. Almost all of the Chinatown community organizations, social service agencies, and political organizations supported it. The list included the CBA; the newly formed advocacy groups, such as the Chinese for Affirmative Action; social service agencies, such as Self-Help for the Elderly; and the Chinatown Democratic and Republican Clubs. The CBA took on a supporting role in this initiative. It lost its powerful position in the Chinese community and became only one interest group among many.
Having united the residents’ voices, the CCBH began to pressure the government and organized Chinatown's senior citizens to protest at the local area HUD office and demand additional federal funding. The demonstrators carried signs reading, “HUD, Live Up To Your Name” and “While HUD Fiddles, Chinatown Burns.” Shaming was only one part of their strategy, however. The CCBH also knew that they needed to learn how bureaucracy works in order to gain access to the government's resources. The CCBH even hired urban and planning consultants to learn the language of the bureaucracy and created a glossary of bureaucratic terms in Chinese for its members.Footnote 86
Acknowledging their shared struggle, the International Hotel Tenants Association (IHTA), led by the Filipino community activists, sent a letter to the CCBH to propose a partnership. In this letter, the IHTA acknowledged that “the age of low-cost housing in Chinatown is a major problem.” The IHTA then stressed that the International Hotel (I-Hotel), a residential hotel between Chinatown and Manilatown, faced imminent eviction, and it asked for support and help from the Chinese side.Footnote 87
The CCBH eagerly accepted the IHTA proposal because the Chinese community understood that the fate of their two communities was linked. In 1966, about 80 percent of the Chinatown residents were Chinese, and the remaining 20 percent were Filipinos, according to a report submitted to the Economic Opportunity Council in San Francisco's Chinatown. Reflecting this background, Violeta Marasigan joined the Chinatown Citizens Advisory Committee to represent the United Filipino Association, along with other members of Chinatown's community organizations and interest groups.Footnote 88 Given that I-Hotel was adjacent to both Chinatown and Manilatown; 52.5 percent of the I-Hotel tenants were Filipinos, and 20.2 percent were Chinese, according to the 1969 court information. Therefore, the I-Hotel crisis was a problem for both the Filipinos and the Chinese.
In 1977, the CCBH merged with four other grassroots organizations in Chinatown and became the Chinatown Resource Center. In 1988, the organization was renamed the Chinatown Community Development Center (CCDC). One of the CCDC's early agendas was to stop the gentrification happening around the I-Hotel. Even after the dramatic eviction of I-Hotel tenants that year, the special relationship between these two groups continued. Twenty-eight years later, the CCDC built the International Hotel Senior Housing on the site of the previous I-Hotel. The International Hotel Manilatown Center was placed on the ground floor to commemorate the residents who had been evicted and the early Filipino immigrants.Footnote 89
In contrast, in regard to housing, there was less active cooperation between the Chinese and Japanese communities. The Japanese worked more closely with African Americans, who were closer neighbors. The Japanese immigrants first came to San Francisco in 1869, about two decades after the arrival of the Chinese.Footnote 90 Japantown was originally located in North Beach, next to Chinatown. However, after the 1906 San Francisco earthquake destroyed their ethnic enclave, the Japanese moved to the Western Addition. The Filipino community was not seriously affected by this natural disaster because the first wave of Filipino immigrants did not settle in San Francisco until the 1920s.Footnote 91
When most of these Japanese were interned during World War II, African Americans moved into their homes. Maya Angelou, the famous African American writer and civil rights activist, grew up in the Western Addition. She recalled that “the Yamamoto Sea Food Market quietly became Sammy's Shoe Shine Parlor and Smoke Shop.”Footnote 92 After the war, the Japanese population rebounded, and these two groups became a shared community. The Western Addition comprised two nonwhite communities: the Fillmore District (“the Harlem of the West,” predominantly African American) and Japantown (Japanese American). According to a Western Addition survey that was conducted in 1977, African Americans accounted for 58.2 percent and Japanese were 7.3 percent of the total population. In comparison, the Chinese accounted for only 1.5 percent and the Filipinos made up only 3.1 percent of the total population.Footnote 93
African Americans, such as Hannibal Williams, and Japanese Americans, such as Yori Wada, founded the Western Addition Community Organization in 1967 to slow down evictions and find ways to build affordable houses.Footnote 94 In the same spirit, in the summer of 1968, the Buchanan Street YMCA, where Yori Wada served as executive director from 1966 to 1982 and which was located in the Western Addition, ran an experimental program to enhance interracial understanding between African American and Japanese American students.Footnote 95 Even the Japantown-oriented organization the Citizens Against Nihonmachi Eviction (CANE), which was formed in 1973, acknowledged their linked fate. CANE noted that “although Nihonmachi [Japantown] has historically been a Japanese-American community, it has always included people of many different races and nationalities.” CANE defined its members as “a cross-section of four generations of Japanese Americans and persons of other races” united in “the larger struggle for low-rent housing for all.”Footnote 96 Had the Japanese not moved to the Western Addition, they would likely have formed a coalition with the Chinese rather than with the African Americans.
3.3.2. Vancouver's Strathcona
As in the United States, the Canadian housing policy began in the 1930s by focusing on the increased homeownership created through mortgages. However, the Canadian approach was slightly more restrained than that the United States. Whereas housing programs were administered by the Department of Finance in Canada, the same task was carried out by the Federal Housing Administration in the United States.Footnote 97 Nonetheless, the gaps did narrow in the 1940s. Following the U.S. model, the Canadian government introduced the idea of urban renewal in the National Housing Act in 1944 and established its own dedicated housing agency called the Central (now Canada) Mortgage and Housing Corporation in 1946.
When the National Housing Act extended into redevelopment areas in 1954 and its amendment removed the restraint on the reuse of cleared land in 1956, it became possible for municipal governments to clear slum housing and use the land in whatever way they saw fit.Footnote 98 Canada's poor and immigrants were disproportionately targeted by this policy change because their homes and neighborhoods were designated as blighted areas. Vancouver's Chinatown was no exception. When Chinese immigrants arrived in Canada in 1858, they first settled in Victoria, a port city near Vancouver. In search of better economic opportunities, they moved inland. According to the 1911 census, Vancouver had the largest Chinese population in Canada.Footnote 99 During the 1960s, after immigration reform, the population of Vancouver's Chinatown substantially increased from 8,729 in 1951 to 15,223 in 1961.Footnote 100 By the 1970s, due to a large influx of Chinese immigrants, Vancouver's Chinatown became the second largest in North America, after San Francisco's.Footnote 101 As this growing population was densely packed into a small area, deteriorating housing conditions were inevitable.
Like the Chinese in San Francisco, the Chinese community in Vancouver gradually adapted to the policy change. In 1957, the Vancouver city government surveyed the Chinatown residents to collect information about their living conditions. Unbeknownst to the residents, the purpose of this survey was to justify a planned three-phase urban renewal project. The city officials even rejected new building permits and applications for development to prove that the area was blighted.Footnote 102 Some residents tried to solve this problem on their own but to no avail. At that point, the residents realized that they had no chance of winning unless they worked together and raised their political visibility.
Nevertheless, their political awakening did not directly lead them to form a broad coalition. Instead, the Chinatown residents first turned to the CBA. The CBA formed the Chinese Property Owners’ Association and demanded that the city government stop urban renewal and allow Chinese residents to rebuild the area themselves with a possible grant from the city. However, the city government ignored CBA's request.Footnote 103
When the second redevelopment plan designated the heart of Chinatown as the new route for a freeway to downtown, the Chinese residents took a different approach. In 1964, the National Housing Act was further amended to broaden the term “renewal” to include redevelopment as well as rehabilitation and conservation. In 1968, the Task Force of Housing and Urban Development, also known as the Hellyer Task Force, began public consultations to examine “housing and urban development” in Canada.Footnote 104 Some concerned Chinatown residents attended the Hellyer Task Force meeting on November 7, 1968. Shirley Chan, a young resident who had turned into a housing activist, recalled how the meeting went:
They were asking for a better deal for the people; you know, a little more money, a social worker under each arm maybe. And the people didn't want that. It was a question of not just relocating, getting another house for a house, but it was a house of the size in which an extended family could live. It was a house where your life patterns wouldn't be disrupted.Footnote 105
The government had new programs and resources. Nevertheless, the residents needed to make their demands clearly known to the policymakers to be able to access these programs and resources. The residents held a large public meeting, conducted in both English and Chinese, on December 14, 1968, and invited both Chinese and non-Chinese residents. The Strathcona Property Owners and Tenants Association (SPOTA) was founded as a result of this meeting.
SPOTA focused on the area rather than the “Chinese” ethnic identity. According to the City of Vancouver's Redevelopment Study of 1957, Strathcona was a largely white European working-class neighborhood. Chinese residents were concentrated in two or three blocks adjacent to a street that ran between the “white” Strathcona and the Chinatown. The Chinese became the majority group in Strathcona in the 1960s after immigration reform substantially increased their population.Footnote 106 For this reason, the Chinese needed to emphasize their place-based identity to bring other ethnic groups under the same banner. Membership was open to all tenants, landlords, and homeowners in Strathcona. Tom Mesic (a Croatian) was appointed one of its founding executive members and later served as its president. Some of the paid block representatives, who were responsible for communication between SPOTA and the residents, were southern and eastern Europeans who had grown up with their Chinese neighbors. Between 1973 and 1974, four out of nineteen block captains had non-Chinese ethnic backgrounds.Footnote 107 Similarly, in its 1972 report to the Canada Mortgage and Housing Corporation, SPOTA explained that an “all inclusive multi-lingual communication system” was its top priority because “while the majority, in ethnic number, is Chinese,” many of these Chinese residents “cannot read, write, or speak English” and there were “Italians and Ukrainians, Native Indians,” and other ethnic groups living in the area as well.Footnote 108 Aside from having non-Chinese as executive members and block representatives, the general meetings were held in both Chinese and English.
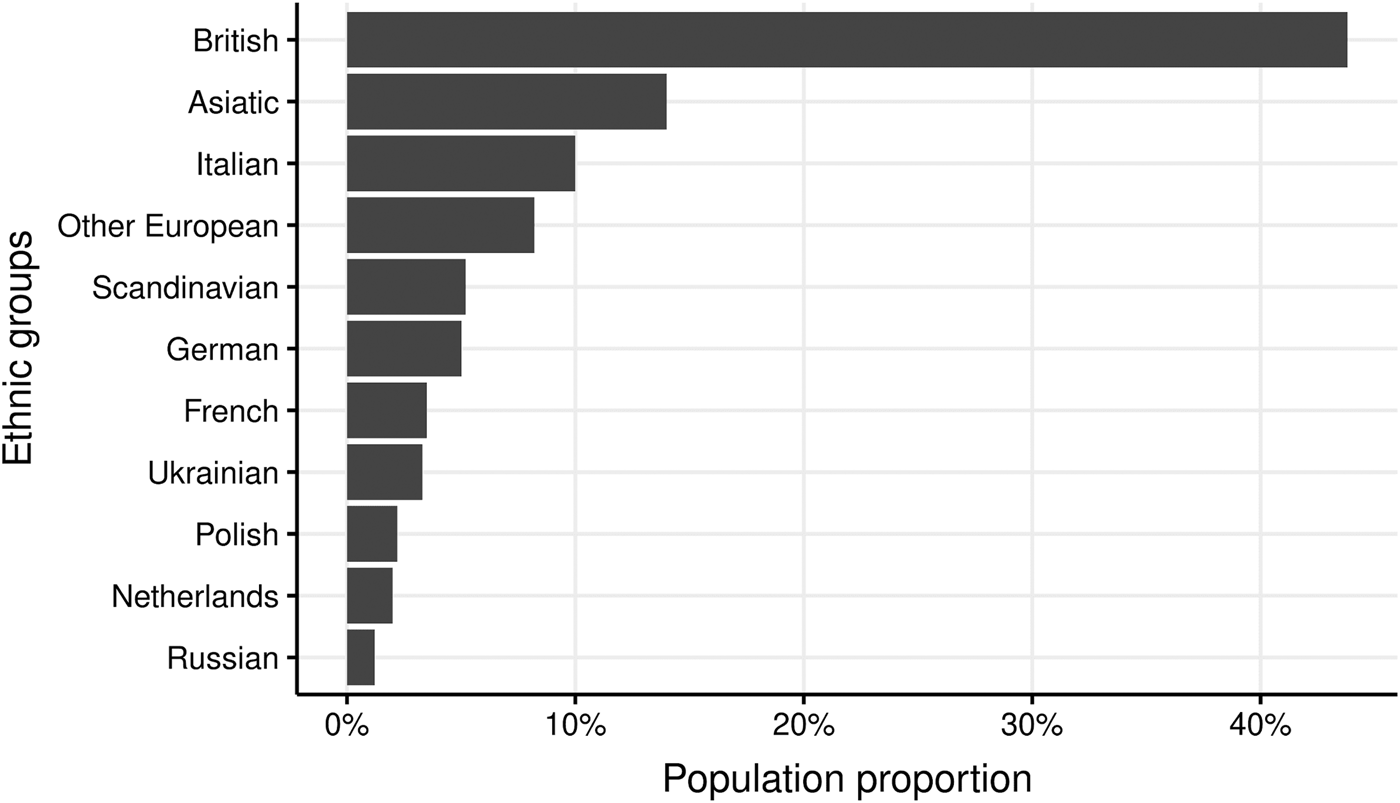
This coalition helped enhance their electoral leverage. According to the 1972 Canadian federal election voting results collected by the radio station CJVB,Footnote 109 the Chinese were the largest non-Anglo population in East Vancouver at 14 percent,Footnote 110 followed by the Italians, who composed 10 percent of the total population (Figure 5). Federal politicians, members of parliament, and ministers began to support SPOTA. Harold E. Winch, a member of Parliament from East Vancouver, sent an encouraging letter to SPOTA on February 17, 1969, to show his interest in the organization. In the spring of 1969, Robert Andras, who had succeeded Paul Hellyer as the minister for Housing, commented that the federal government would only approve an urban renewal project in Strathcona if the project emphasized rehabilitation rather than slum clearance.
Ethnic Composition of East Vancouver in 1972. Source: CJVB 1972 federal election report.

SPOTA used these endorsements as leverage against the city officials. In a letter sent to the mayor and the city council members on February 4, 1971, SPOTA used Andras's words to urge the city government to reconsider the urban renewal project. They underscored the point that Andras had mentioned—that “Ottawa is not interested in participating in the City's Strathcona urban renewal scheme . . . unless the people affected and the three levels of government have a full part in the planning”Footnote 111 Bessie Lee, another resident-turned-activist, recalls how effective this rightful resistance strategy was:
When it got to the state where we could form the Strathcona Rehabilitation Committee, Robert Andras came out to Vancouver and met with us privately before he met with the city officials. When they found that out they were really angry because they still thought they were going to get their way, you know. So then at the meeting at City Hall in the afternoon he stood up and said that he would not allow the program to proceed without the community having full participation in the planning.Footnote 112
In July 1971, an agreement on a rehabilitation project was reached between the federal, provincial, and local government; representatives of the Strathcona residents; and SPOTA. Six months later, the Strathcona Rehabilitation Project officially began.
3.3.3. Seattle's International District
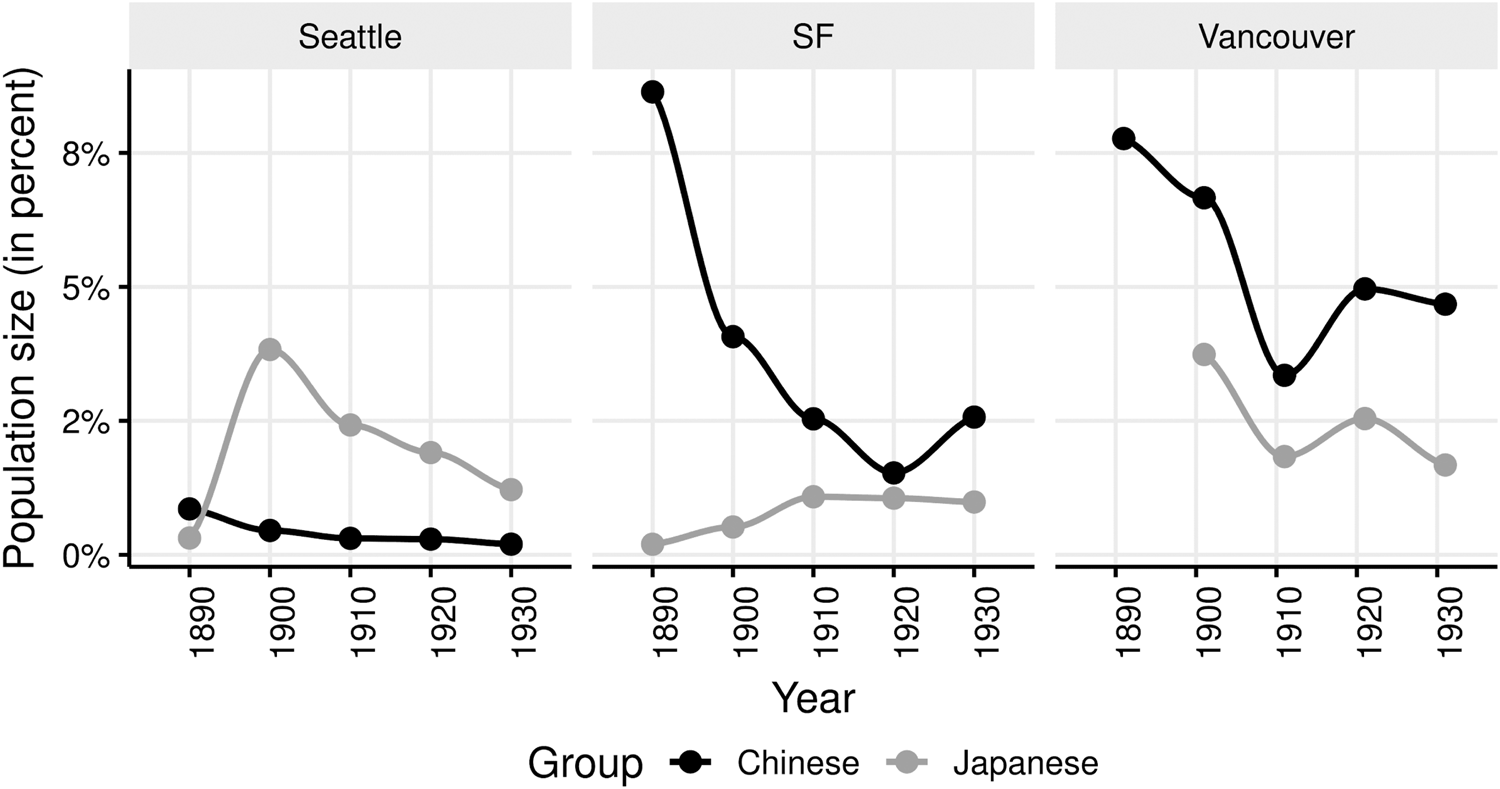
The Chinese migrated to Washington State in the 1860s to look for a different employment opportunity after the transcontinental railroad was completed.Footnote 113 By 1880, 3,817 Chinese were living in Washington.Footnote 114 The Chinese population in Seattle was smaller than that of their counterparts in San Francisco and Vancouver. As Figure 6 shows, the majority of Seattle's Asian ethnic groups in the early twentieth century did not comprise Chinese. A series of external forces contributed to this pattern. The alliance of the working-class European immigrants and white property owners precipitated anti-Chinese riots in Seattle and in neighboring Tacoma between 1885 and 1886. In both of these cities, these groups invaded their respective Chinese quarters and tried to send the Chinese residents back to China using force. Even before the riots began, almost all the Chinese in Seattle and Tacoma were unemployed due to poor economic conditions and the interference of these anti-Chinese groups. The political violence against the Chinese stopped only when the federal troops intervened.Footnote 115
The Changes in Chinese and Japanese Population in Seattle, San Francisco, and Vancouver, 1890–1931. Sources: U.S. Census and (1890–1930) the Census of Canada (1891–1931) data collected and analyzed by Norbert MacDonald, “Population Growth and Change in Seattle and Vancouver, 1880–1960,” Pacific Historical Review 39, no. 3 (1970): 310–11.

The Japanese and Filipinos arrived in Seattle slightly later than the Chinese did. The Japanese first moved to Seattle in 1884, and the large inflow of Filipinos into the city started in the 1920s and 1930s.Footnote 116 The Chinese rebuilt their main commercial district on King Street after the Great Seattle Fire of 1889 burned down their original Chinatown. The Japanese settled on Jackson Street and Main Street, which were right next to King Street.Footnote 117 The Filipino population was mostly concentrated on lower Second and Main Streets.Footnote 118 Given these settlement patterns, the physical distance between these three groups was extremely close, as they lived only one or two streets apart. According to a property survey of the settlement in the inner city area in Seattle in 1939, these minority groups did live in close proximity to each other.Footnote 119
Despite the physical proximity, the social boundary between the first-generation immigrants in these groups remained distant because of their language and cultural differences. Yet, for the second- and third-generation immigrants, who spoke English, grew up in the same neighborhood, and attended the same schools, the distances narrowed.Footnote 120 Unlike most other cities on the West Coast, Seattle did not create a separate school for Asians. Nevertheless, because most Asians were segregated in a small area, and their school choice was limited, most Asian schoolchildren in Seattle actually attended the same schools.Footnote 121 In 1921, 452 out of 455, or 99 percent, of the students at Bailey Gatzert Elementary School, located in the hub of the Asian enclave, came from either Chinatown or Japantown.Footnote 122 In his memoir, Robert Santos, a prominent activist in the area, recalled strolling down the Chinatown alleys, eating at Filipino cafés, and watching a Japanese cultural performance at the Nippon Kan (Japanese Hall) when he was little. Reflecting on this personal experience, he stressed in his memoir how each succeeding generation viewed the same area in different ways:
For first generation [Chinese, Japanese, and Filipinos] immigrants, it [the International District] was their home in America. For their children, the second generation, it was the neighborhood they grew up in. For their grandchildren, the third generation, it was the neighborhood which gave them their identity as Asian Americans and the opportunity to repay their elders.Footnote 123
These strong intergroup contacts were later institutionalized in the form of a neighborhood improvement organization that connected the leaders from different minority communities. The Jackson Street Community Council (JSCC) was established in 1946 and had Chinese, Japanese, Filipinos, and members of other racial groups. Its early members included Jimmy Mar, Don Chin, and Ben Woo, who were Chinese; Toru Sakahara, James Matsuoka, William Mimbu, Tak Kubota, and Frank Hattori, who were Japanese; Fred Cordova, a Filipino; and Alex Bishop, an African American. Cognizant of this diversity in the membership, the JSCC lobbied the city government to designate Chinatown and its surrounding areas as the “International Center.” Since then, the area has been known as the Chinatown-International District.Footnote 124
In 1952, the State Highway Commission planned to build a Seattle freeway through downtown. The JSCC protested that it would divide the International District in half. Nonetheless, neither the federal nor the city government showed any interest in the International District. Facing housing pressures and economic distress, the Chinese community was divided. American-born Chinese professionals then founded the Chinese Community Service Organization (CCSO) to push the CBA to be more involved in the issues facing the broader Chinese community. The other group was composed of the old guards at the CBA who formed the Chinatown Chamber of Commerce to promote business in the area. Because the incumbents strongly opposed the reform efforts, the CCSO was not able to produce much change.
In 1964, Mayor James d'Orma Braman officially designated Chinatown and its surrounding area as the “International District.” In response, several former JSCC members founded the International District Improvement Association (Inter*IM) in 1969 to represent the entire district.Footnote 125 According to the 1970 U.S. Census, Filipinos were the largest group among all the Asian ethnic groups in the District, at 400, followed by the Chinese at around 375, and the Japanese at 100. The Japanese made up a small proportion, given that an estimated 65 to 70 percent of Japanese Americans returned to the city after their incarceration during World War II.Footnote 126 The timing was fortunate because the War on Poverty provided much-needed financial support. Inter*IM received seed funds from the Model Cities Program and was able to open an office staffed by a part-time Model Cities Program coordinator.
However, the founding members—mostly Chinese and Japanese small-shop owners in the district—soon realized that they lacked the political networks and skills to obtain additional government support. To solve this problem, Robert Santos, a Filipino civil rights activist, was brought in as the organization's new director in 1972. Santos had grown up in the International District, served as president of the Catholic Interracial Council, and was on the Seattle Human Rights Commission and the Model Cities Board of Directors.Footnote 127 Given these credentials, he knew how to advocate and communicate with the government.
Just as Santos took over the leadership, a new challenge arrived. The county officials decided to build a multipurpose domed stadium near downtown in 1971. Property owners were worried about increased property taxes, and tenants were concerned about being evicted. In the meantime, traditional leaders in each ethnic community did little to change the status quo. The CBA was silent about this impending crisis in its community. Ling Mar, chairperson of the Seattle CBA, argued that the CBA's primary goal was to preserve Chinatown's identity and character. Mar admitted that the stadium “would have some impact on businesses, traffic, and in other areas.” However, he also emphasized that “it would not wipe Chinatown out.”Footnote 128 The Japanese American Citizen League, the leading Japanese American advocacy organization, and the Filipino Community, Inc., the representative organization for Filipinos in the district, did not engage with the issue very well.Footnote 129
In contrast, the Inter*IM pursued this issue as its main political agenda, focusing on creating low-cost housing for the old and the poor. In 1972, Inter*IM mobilized more than 150 demonstrators and earned the chance to meet HUD officials and Mayor Uhlman to negotiate with the city's Department of Community Development. In 1974, Santos testified at the Seattle City Council regarding the problem of urban renewal in the district. There, he argued that “urban centers all across the nation are losing downtown neighborhoods to progress at the expense of pioneers.” What is interesting is that he stressed that the International District was a neighborhood of early immigrants. In this way, he was able to point out that the area was not solely for Chinese or Asians but, rather, was for all Seattle citizens to honor and preserve Seattle's rich immigration history. In addition, he made it clear that he could not deny that housing conditions in the district were far from ideal. Instead, he stressed that the people in the district should be involved in the process of making decisions for their own neighborhood. In addition to Inter*IM, the International District Youth Council and the International District Housing Alliance joined forces to mobilize the elderly residents who were most severely affected by the redevelopment plan. All of these organizations were initiated by young community activists who grew up in the district as Asian Americans.Footnote 130
4. Discussions
The tale of three Chinatowns in the United States and Canada illustrates the limitations of a shared racial status-based argument. A century of racism toward Orientals created an Asian race-based coalition in San Francisco and Seattle but a cross-racial coalition in Vancouver, Canada. This article offers an original theory and extensive archival evidence to address this and other related puzzles. The findings demonstrate why scholars need to study minority coalition formation historically with a clear, new focus on the strategic calculation of ethnic elites.
To begin with, the strategic calculation of ethnic elites points to overlooked blind spots in the existing literature. Racially marginalized status has induced ethnic elites to form race-based coalitions in some places and times, but not in others, because these elites need to weigh two factors when choosing a suitable partner. In terms of pressuring the government, maximizing the size of the coalition sounds optimal. However, ethnic elites should also consider how much they need to invest in order to communicate with their new partners. In this light, their goal should not be to maximize the size of the coalition but, rather, to create a working coalition that can achieve their policy goals with as little effort as possible.Footnote 131 This theory demonstrates that race-based coalitions among ethnic minorities are not an inevitable but, rather, a historically contingent outcome that is driven by the strategic calculations of ethnic elites. These historical cases discussed herein illustrate that minority groups are strategic actors;Footnote 132 they are capable of crafting new strategies in response to changing policy circumstances and can indeed exploit the division among the powerful to advance their own interests.
Nonetheless, a long-term historical perspective does show the limitations of their agency. Ethnic minorities can choose, but the range of their options is often circumscribed by historical legacies. Bringing history into the discussion is crucial because the early historical development determined the configuration of minority coalition formation in all three cases. Immigration policy determined which and how many ethnic groups settled in each city. Segregation policies dictated the spatial distance and boundaries between the groups, which, in turn, structured the eventual strength of their interactions. These initial conditions thus influenced who would become the political allies of the Chinese in their ongoing quest for housing reform.
Some may wonder whether these multiethnic coalitions for affordable housing are the direct results of shared geographic fortunes in the face of urban renewal. However, this perspective underestimates the cost involved in building a coalition. Coalition formation requires long-term commitment, time, energy, and resources. In spite of this, members of a minority coalition do not always know whether their efforts will succeed, because they are waging a fight against a much more powerful foe. In essence, minority coalition building is a risky long-term undertaking. For this reason, ethnic elites cannot choose a coalition partner simply because both happen to live in the same place and face a common challenge. They should know their prospective partner long enough to trust them.Footnote 133 Without these previous interactions, it is hard for these groups to be strongly committed to coalition-building efforts, because the risk involved is often too high. Formative intergroup contacts can make coalition building easier by reducing coordination costs and uncertainty about the future.Footnote 134 Finally, this article sheds new light on how political geography shapes collective identity. In these particular historical cases, community organizers talked about their collective identity in a multidimensional but very specific way. When they articulated the reasons why their neighborhoods should be protected and supported, their political rhetoric was not limited to the ethnic (Chinese) and racial (Asian) dimensions of their collective identities. They also stressed its economic (poor) and legal (immigrants) dimensions, as they perceived that doing so could be more effective in persuading policymakers and mobilizing their group members.
More importantly, identities based on places, such as Chinatown, the International District, and Strathcona, both connected and divided these different dimensions of their collective identities. On the one hand, these place-based identities cut across existing cleavages, such as ethnicity and race, and became the main basis for mobilization and coalition building between disparate minority groups. On the other hand, these identities set the boundaries of a particular cleavage. For instance, in Seattle's International District, the Chinese community became deeply divided, forming two factions, despite their co-ethnic status. The one associated with the CBA still clung to its ethnic identity and had conservative economic agendas, while the other became interested in building a broad coalition, embraced the Asian American identity, and claimed liberal economic agendas. The idea of place in the minds of these two factions thus differed significantly. The former group was concerned with the issues of Chinatown only, especially its commercial districts, while the latter group was interested in a much broader community, focusing on the old and the poor.
5. Conclusion
In this article, I demonstrate that racism—the hierarchy that forms between dominant and subordinate races—alone does not explain how ethnic minorities form a race-based coalition in some places and times but not others. Leveraging exogenous shocks and unique archival data on San Francisco, Seattle, and Vancouver, this article explains how historical legacies can shape minority coalition formation. Building a broad coalition takes time, energy, and, most of all, a long-term commitment. Therefore, minority groups have to be very strategic when selecting their partners. However, the factors that these minorities need to take into account are not random but, rather, are systematically determined by the historical legacies of the political geography of settlement.
I find support for two explanations of variations in the formation of minority coalitions in the United States and Canada. First, the U.S. military involvement in the Asia-Pacific region substantially diversified the Asian population in the United States relative to that in Canada.Footnote 135 Of particular importance are the Filipinos who played an important role in both the San Francisco and Seattle cases. Had they been absent, the Chinese would have reconsidered the political utility of forming a coalition with other Asian ethnic groups in these two cities. Racial ideology did affect how the U.S. government justified a war with non-European countriesFootnote 136 and then its period of military rule in foreign territories, including the Philippines.Footnote 137 Nevertheless, it is important to acknowledge that the institutional channels provided by the U.S. military did draw a large number of Filipinos into the United States through employment opportunities and the granting of citizenship.Footnote 138
In addition, this article shows that both the vertical and horizontal aspects of segregation are critical to understanding the logic of minority coalition formation. The vertical aspect of segregation—the physical and social division between dominant and subordinate groups—is directly related to racism. It explains why Chinatown and other ethnic minority enclaves were established in each city in the first place. Yet, by focusing exclusively on the vertical dimension of segregation, one may overlook another important dimension. Chinatown is often a misnomer because the boundary between one ethnic enclave and another is not always clear. The line between Chinese and other minority groups, as demarcated in the late nineteenth and early twentieth centuries, shaped the variations in minority coalition outcomes during the 1960s and 1970s in both the United States and Canada. Whether political elites in one ethnic group actually reach out to another ethnic group sharing the same racial status depends on whether the other group is one of substantial size and has chosen to have strong intergroup contacts based on the political geography of settlement.