Introduction
Copy number variation (CNV) is a variation in genomic sequence that ranges from 50 bp to 5 Mb. Compared with a reference sequence, CNV includes insertions, deletions and duplications (Mills et al., Reference Mills, Walter, Stewart, Handsaker, Chen, Alkan, Abyzov, Yoon, Ye, Cheetham, Chinwalla, Conrad, Fu, Grubert, Hajirasouliha, Hormozdiari, Iakoucheva, Iqbal, Kang, Kidd, Konkel, Korn, Khurana, Kural, Lam, Leng, Li, Li, Lin, Luo, Mu, Nemesh, Peckham, Rausch, Scally, Shi, Stromberg, Stuetz, Urban, Walker, Wu, Zhang, Zhang, Batzer, Ding, Marth, McVean, Sebat, Snyder, Wang, Ye, Eichler, Gerstein, Hurles, Lee, McCarroll and Korbel2011; MacDonald et al., Reference MacDonald, Ziman, Yuen, Feuk and Scherer2014). Numerous CNVs have been routinely identified using various genome analysis platforms, including single nucleotide polymorphism (SNP) genotyping platforms (Di Gerlando et al., Reference Di Gerlando, Sardina, Tolone, Sutera, Mastrangelo and Portolano2019), array comparative genomic hybridization (aCGH) (Zhang et al., Reference Zhang, Jia, Yang, Xu, Li, Sun, Huang, Lan, Lei, Zhou, Zhang, Zhao and Chen2014) and next-generation sequencing (Xu et al., Reference Xu, Jiang, Shi, Cai, Lan, Zhao, Plath and Chen2017). These studies have been performed in humans (Altshuler et al., Reference Altshuler, Gibbs, Peltonen, Dermitzakis, Schaffner, Yu, Bonnen, de Bakker, Deloukas, Gabriel, Gwilliam, Hunt, Inouye, Jia, Palotie, Parkin, Whittaker, Chang, Hawes, Lewis, Ren, Wheeler, Muzny, Barnes, Darvishi, Hurles, Korn, Kristiansson, Lee, McCarroll, Nemesh, Keinan, Montgomery, Pollack, Price, Soranzo, Gonzaga-Jauregui, Anttila, Brodeur, Daly, Leslie, McVean, Moutsianas, Nguyen, Zhang, Ghori, McGinnis, McLaren, Takeuchi, Grossman, Shlyakhter, Hostetter, Sabeti, Adebamowo, Foster, Gordon, Licinio, Manca, Marshall, Matsuda, Ngare, Wang, Reddy, Rotimi, Royal, Sharp, Zeng, Brooks, McEwen and Int HapMap2010; Mills et al., Reference Mills, Walter, Stewart, Handsaker, Chen, Alkan, Abyzov, Yoon, Ye, Cheetham, Chinwalla, Conrad, Fu, Grubert, Hajirasouliha, Hormozdiari, Iakoucheva, Iqbal, Kang, Kidd, Konkel, Korn, Khurana, Kural, Lam, Leng, Li, Li, Lin, Luo, Mu, Nemesh, Peckham, Rausch, Scally, Shi, Stromberg, Stuetz, Urban, Walker, Wu, Zhang, Zhang, Batzer, Ding, Marth, McVean, Sebat, Snyder, Wang, Ye, Eichler, Gerstein, Hurles, Lee, McCarroll and Korbel2011), mice (Guryev et al., Reference Guryev, Saar, Adamovic, Verheul, Van Heesch, Cook, Pravenec, Aitman, Jacob, Shull, Hubner and Cuppen2008; Yalcin et al., Reference Yalcin, Wong, Agam, Goodson, Keane, Gan, Nellaker, Goodstadt, Nicod, Bhomra, Hernandez-Pliego, Whitley, Cleak, Dutton, Janowitz, Mott, Adams and Flint2011), pigs (Wang et al., Reference Wang, Wang, Jiang, Kang, Feng, Zhang and Liu2013a, Reference Wang, Jiang, Wang, Kang, Zhang and Liu2014), horses (Doan et al., Reference Doan, Cohen, Harrington, Veazey, Juras, Cothran, McCue, Skow and Dindot2013; Kader et al., Reference Kader, Liu, Dong, Song, Pan, Yang, Chen, He, Jiang and Ma2016; Corbi-Botto et al., Reference Corbi-Botto, Morales-Durand, Zappa, Sadaba, Peral-Garcia, Giovambattista and Diaz2019), cattle (Jiang et al., Reference Jiang, Jiang, Yang, Liu, Wang, Wang, Ding, Liu and Zhang2013; Yang et al., Reference Yang, Xu, Zhu, Niu, Zhang, Miao, Shi, Zhang, Chen, Zhang, Gao, Gao, Li, Liu and Li2017a), goats (Fontanesi et al., Reference Fontanesi, Martelli, Beretti, Riggio, Dall'Olio, Colombo, Casadio, Russo and Portolano2010; Liu et al., Reference Liu, Zhou, Rosen, Van Tassell, Stella, Tosser-Klopp, Rupp, Palhière, Colli, Sayre, Crepaldi, Fang, Mészáros, Chen and Liu2018; Zhang et al., Reference Zhang, Wang, Zhang, Zhai and Shen2019) and chickens (Wang et al., Reference Wang, Nahashon, Feaster, Bohannon-Stewart and Adefope2010). Over the past decades, significant progress has been made in mapping SNPs and insertions/deletions (Indels), the lengths of which are much smaller than those of CNVs, but there is less comprehensive annotation of CNVs (Pang et al., Reference Pang, MacDonald, Pinto, Wei, Rafiq, Conrad, Park, Hurles, Lee, Venter, Kirkness, Levy, Feuk and Scherer2010). Although SNPs have a disadvantage in quantity, CNVs make up a higher proportion of genomes compared with SNP (Yang et al., Reference Yang, Lv, Zhang, Li, Zhou, Lan, Lei and Chen2017b). Additionally, CNVs can have potential effects on phenotypic variation through various molecular mechanisms including gene interruption, gene fusion, gene dosage, position effects, unmasking of recessive alleles or functional polymorphisms, and transvection effects (Zhang et al., Reference Zhang, Gu, Hurles and Lupski2009). Overall, the variations in copy number distributed in the genome also represent a major source of genetic and phenotypic variation among individuals (Sebat et al., Reference Sebat, Lakshmi, Troge, Alexander, Young, Lundin, Maner, Massa, Walker, Chi, Navin, Lucito, Healy, Hicks, Ye, Reiner, Gilliam, Trask, Patterson, Zetterberg and Wigler2004; Beckmann et al., Reference Beckmann, Estivill and Antonarakis2007), and are associated with the occurrence of several diseases, especially some cancers (McCarroll and Altshuler, Reference McCarroll and Altshuler2007).
Somatostatin receptor 2 (SSTR2), a seven-transmembrane-domain protein receptor, has two isoforms (SSTR2A and SSTR2B) which belong to the family of transmembrane G-protein coupled receptors (GPCRs) and play important roles in cell signal pathways by binding the somatostatin ligand. In detail, GPCRs include five members (SSTR1, SSTR2, SSTR3, SSTR4 and SSTR5). In the 1990s, the five members were successfully cloned in humans (Yamada et al., Reference Yamada, Post, Wang, Tager, Bell and Seino1992a, Reference Yamada, Reisine, Law, Ihara, Kubota, Kagimoto, Seino, Seino, Bell and Seinob, Reference Yamada, Kagimoto, Kubota, Yasuda, Masuda, Someya, Ihara, Li, Imura, Seino and Y1993) and found to share DNA sequence coding for a transmembrane region (Heron et al., Reference Heron, Thomas, Dero, Gancel, Ruiz, Schatz and Kuhn1993). Among these five somatostatin receptors, SSTR2 is mainly expressed in the cerebral cortex, the pituitary and adrenal glands in humans, and it was reported to exert anti-proliferative and pro-apoptotic effects by the negative regulation of the Wnt/β-catenin pathway (Buscail et al., Reference Buscail, Esteve, Saint-Laurent, Bertrand, Reisine, O'Carroll, Bell, Schally, Vaysse and Susini1995; Chen et al., Reference Chen, Liang, Li, Yang, Wang and Long2009; Wang et al., Reference Wang, Bao, Liang, Long, Xiao, Jiang, Liu, Yang and Long2013b).
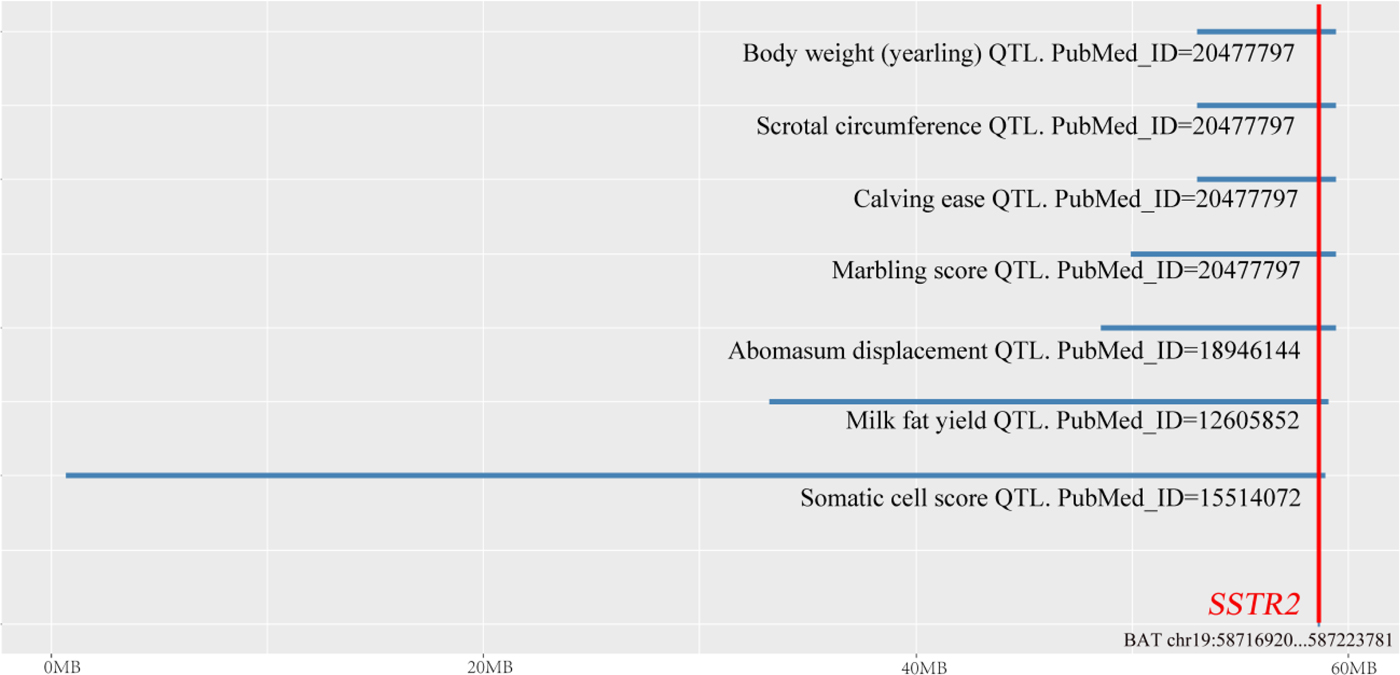
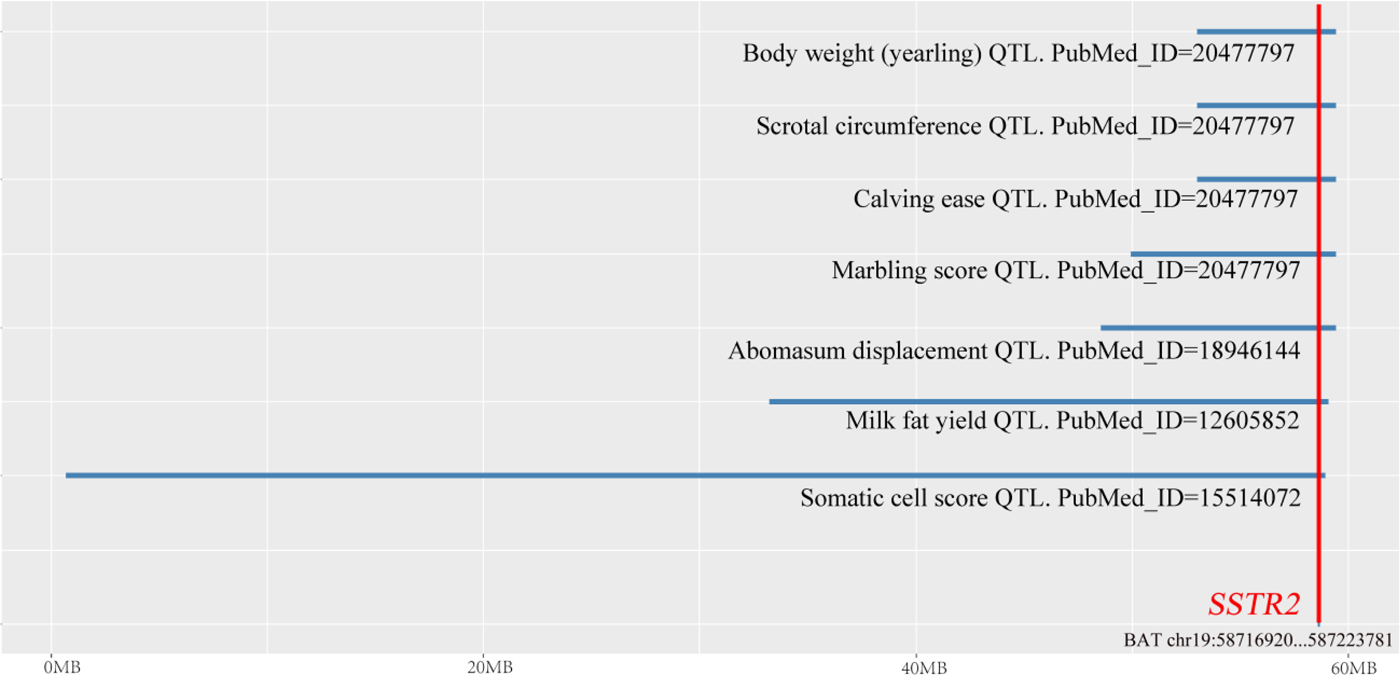
The bovine SSTR2 gene is located at chr19: 58716920-58723781 (UMD_3.1.1), with an 1107 bp sequence that encodes a 368 amino acid protein. The SSTR2 gene has been identified in important quantitative trait loci (QTLs) such as somatic cell score, milk fat yield, abomasum displacement, marbling score, calving ease, scrotal circumference and body weight (yearling) (Fig. 1) (Boichard et al., Reference Boichard, Grohs, Bourgeois, Cerqueira, Faugeras, Neau, Rupp, Amigues, Boscher and Leveziel2003; Bennewitz et al., Reference Bennewitz, Reinsch, Guiard, Fritz, Thomsen, Looft, Kuhn, Schwerin, Weimann, Erhardt, Reinhardt, Reents, Boichard and Kalm2004; Moemke et al., Reference Moemke, Scholz, Doll, Rehage and Distl2008; McClure et al., Reference McClure, Morsci, Schnabel, Kim, Yao, Rolf, McKay, Gregg, Chapple, Northcutt and Taylor2010). In a previous study, the SSTR2 gene was mapped to a CNV region called CNVR317 in Chinese cattle by application of aCGH (Zhang et al., Reference Zhang, Jia, Yang, Xu, Li, Sun, Huang, Lan, Lei, Zhou, Zhang, Zhao and Chen2014). The results suggested that SSTR2 CNV is a phenotype-associated variation, but this has not been demonstrated conclusively. In the current study, quantitative polymerase chain reaction (qPCR) was used to detect the SSTR2 CNV for six Chinese cattle breeds. Additionally, the significant effects of SSTR2 CNV on the phenotype were identified in 431 individuals from three breeds.
Various QTLs associated with SSTR2. Colour online. Note: Using R software, data from Animal QTLdb and NCBI.
Materials and methods
Study populations and trait records
The probes used in the previous aCGH experiment are shown in Fig. 2. In that study, eight individuals including three Qinchuan cattle, three Nanyang cattle and two Luxi cattle were selected to detect the CNV of SSTR2 (Zhang et al., Reference Zhang, Jia, Yang, Xu, Li, Sun, Huang, Lan, Lei, Zhou, Zhang, Zhao and Chen2014). In the current study, preliminary verification of CNVs was first performed on the representatives of six cattle breeds, and then the intergroup distributions of SSTR2 CNVs were examined for six multi-variety panels. The selected cattle were Jian cattle (JA, n = 30), Qinchuan cattle (QC, n = 30), Nanyang cattle (NY, n = 30), Luxi cattle (LX, n = 30), Pinan cattle (PN, n = 30) and Xia'nan cattle (XN, n = 30), and were reared in Jiangxi, Shaanxi, Henan, Shandong, Henan and Henan provinces, respectively. Given the CNV polymorphisms of the six breeds, three populations, QC, NY and XN breeds, were scaled up for association analysis. The subject animals were weaned at 6 months old, fed ad-libitum on concentrated diet and maize–maize silage diet and given straw until about 2 years old. The animals used for association analysis were unrelated for at least the past three generations. Growth records of the XN, QC and NY animals were collected for association analysis (Gilbert et al., Reference Gilbert, Bailey and Shannon1993). In XN cattle (n = 216), the withers height, body weight, body oblique length, chest girth, hip width, paunch girth and cannon bone circumference were measured for cows and oxen (24 months old). In the QC breed (n = 105), withers height, body weight, body length, hip width, chest girth, chest width, chest depth, thurl width, hucklebone width and rump length were measured for adult cows at 2 and 3.5 years old. In NY cattle (n = 110), withers height, body weight, body oblique length, chest girth, hucklebone width and average daily gain for different growth periods (0, 6, 12, 18, 24 and 36 month(s) old) were determined for cows.
Schematic diagram of the mapped aCGH probes for cattle SSTR2 gene. Note: The SSTR2 gene sequences were obtained from the cattle UCSC Genome (Bos Tau 4.0). CHR19FS060519741-Chr 19: 58710608–58710657; CHR19FS060523063-Chr 19: 58713930–58713980; CHR19FS060526494-Chr 19: 58717235–58717293; CHR19FS060529772-Chr 19: 58720513–58720562; CHR19FS060533197-Chr 19: 58723903–58723952; CHR19FS060536527-Chr 19: 58727233–58727283; CHR19FS060539941-Chr 19: 58730647–58730696.

Genomic DNA and total RNA isolation
To perform expression profiling analysis of SSTR2 gene, three adult NY cattle (24 months old) which exhibited no adverse health conditions were selected for tissue collection, including heart, liver, spleen, lung, kidney, skeletal muscle and adipose tissue. To make an association analysis between genotypes and expression, skeletal muscles and adipose tissue samples of adult NY cattle (n = 23) were collected for RNA and DNA isolation.
Genomic DNA from blood and tissue samples was isolated according to standard procedures (Sambrook et al., Reference Sambrook, Russell and Russell2001). The total RNA was extracted by Trizol reagent according to the manufacturer's instructions (TaKaRa, Japan). The RNA integrity was detected by agarose gel electrophoresis and RNA purity was determined by A260/A280. The synthesis of cDNA was performed using the PrimeScript RT reagent kit (TaKaRa, Japan). The diluted standard concentration of DNA and cDNA samples was 50 ng/μl and the samples were stored at −20 °C.
Determination of SSTR2 gene copy numbers
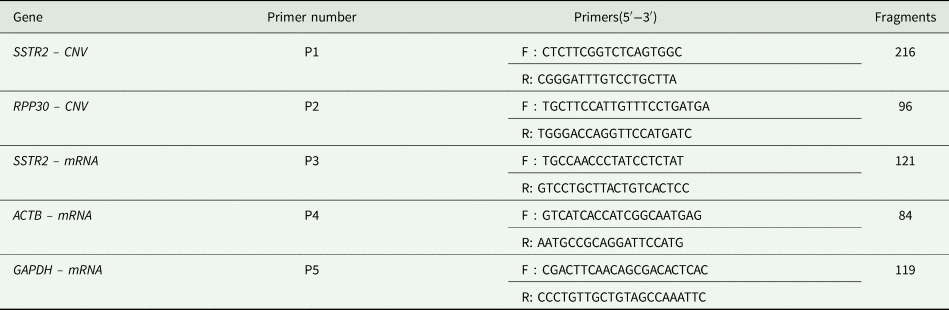
The copy number of SSTR2 was detected by qPCR through comparison with the reference gene, ribonuclease P/MRP subunit p30 (RPP30) (Hindson et al., Reference Hindson, Ness, Masquelier, Belgrader, Heredia, Makarewicz, Bright, Lucero, Hiddessen, Legler, Kitano, Hodel, Petersen, Wyatt, Steenblock, Shah, Bousse, Troup, Mellen, Wittmann, Erndt, Cauley, Koehler, So, Dube, Rose, Montesclaros, Wang, Stumbo, Hodges, Romine, Milanovich, White, Regan, Karlin-Neumann, Hindson, Saxonov and Colston2011), widely recognized as a reference gene with two copies, and primers were designed using Primer 5 software (Table 1). The qPCR reactions were performed as described (Liu et al., Reference Liu, Li, Huang, Yang, Lan, Lei, Qu, Bai and Chen2016). The standard curve method (using six serial dilution points) indicated similar amplification efficiencies of target and housekeeping genes. Finally, 431 animals including XN (n = 216), QC (n = 105) and NY (n = 110) cattle were used for further analyses. The copy number was calculated according to 2−ΔΔCt, and data were rounded (Shi et al., Reference Shi, Xu, Yang, Huang, Lan, Lei, Qi, Yang and Chen2016).
PCR primer sequences of the cattle SSTR2 gene for qPCR in the current study

The effects of SSTR2 copy number variations on gene expression
Expression profiling of SSTR2 was analysed by qPCR in different tissues, including heart, liver, spleen, lung, kidney, skeletal muscle and adipose tissue. The actin beta (ACTB) and glyceraldehyde-3-phosphate dehydrogenase (GAPDH) genes were selected as the reference genes (Olias et al., Reference Olias, Adam, Meyer, Scharff and Gruber2014). The skeletal muscles and adipose tissue of the adult NY cattle (n = 23) were also subjected to analysis by qPCR, which was done the same way as used for the expression profiling. Primer information is listed in Table 1, and relative expression levels were calculated as 2−ΔΔCt.
Statistical analyses
A full statistical model was first used and then a reduced statistical model was used in the final analysis. The full statistical model contained fixed effects of copy number, age, sex, management group, birth season, farm and paternal effects. In the reduced statistical model, management group, birth season, farm and paternal effects were not used as factors, given their no significant effects on phenotypic variation. Thus, the reduced model was as follows:

where Y ijkl represents the growth measurements, u is the overall mean of a given trait, A i is the fixed effect due to i th age, S j is the fixed effect due to j th sex, CNVj is the fixed effect of k th CNV type of SSTR2, and e ijkl is the random residual error. The data for different species gave different parameters in the model (for XN, A i = 0; for QC and NY, S j = 0).
In the current study, CNVs were grouped into three classes: gain, copy number > 2; median, copy number = 2; loss, copy number < 2. These assessments allowed the classification of copy number measurements into discrete values of ‘Gain’, ‘Loss’ or ‘Median’, sometimes referred to as ‘genotypes’ of samples, as an extremely general form of CNV analysis (Xu et al., Reference Xu, Zhang, Shi, Zhou, Cai, Lan, Zhang, Lei and Chen2013; Liu et al., Reference Liu, Li, Huang, Yang, Lan, Lei, Qu, Bai and Chen2016; Yang et al., Reference Yang, Lv, Zhang, Li, Zhou, Lan, Lei and Chen2017b). Raw copy-number measurements were classified into such general ‘calls’, which can lead to the loss of important information from the original data (McCarroll and Altshuler, Reference McCarroll and Altshuler2007). Given the rarity of individuals with copy number ⩾6 compared to the individuals with lower copy number, copy numbers (0, 1, 2, 3, 4, 5 and ⩾6) were also fitted as genotype levels in the model for association analysis. The general linear model in SPSS (Inc., Chicago, IL, USA) was used for association analysis of SSTR2 CNVs with growth traits. The proportion of phenotypic variation that was explained by CNV (R 2) was determined by partial correlation analysis using the reduced statistical model (Rauch et al., Reference Rauch, Lalic, Roughley and Glorieux2010).
Results
Copy number variation polymorphisms of SSTR2 in six Chinese cattle breeds
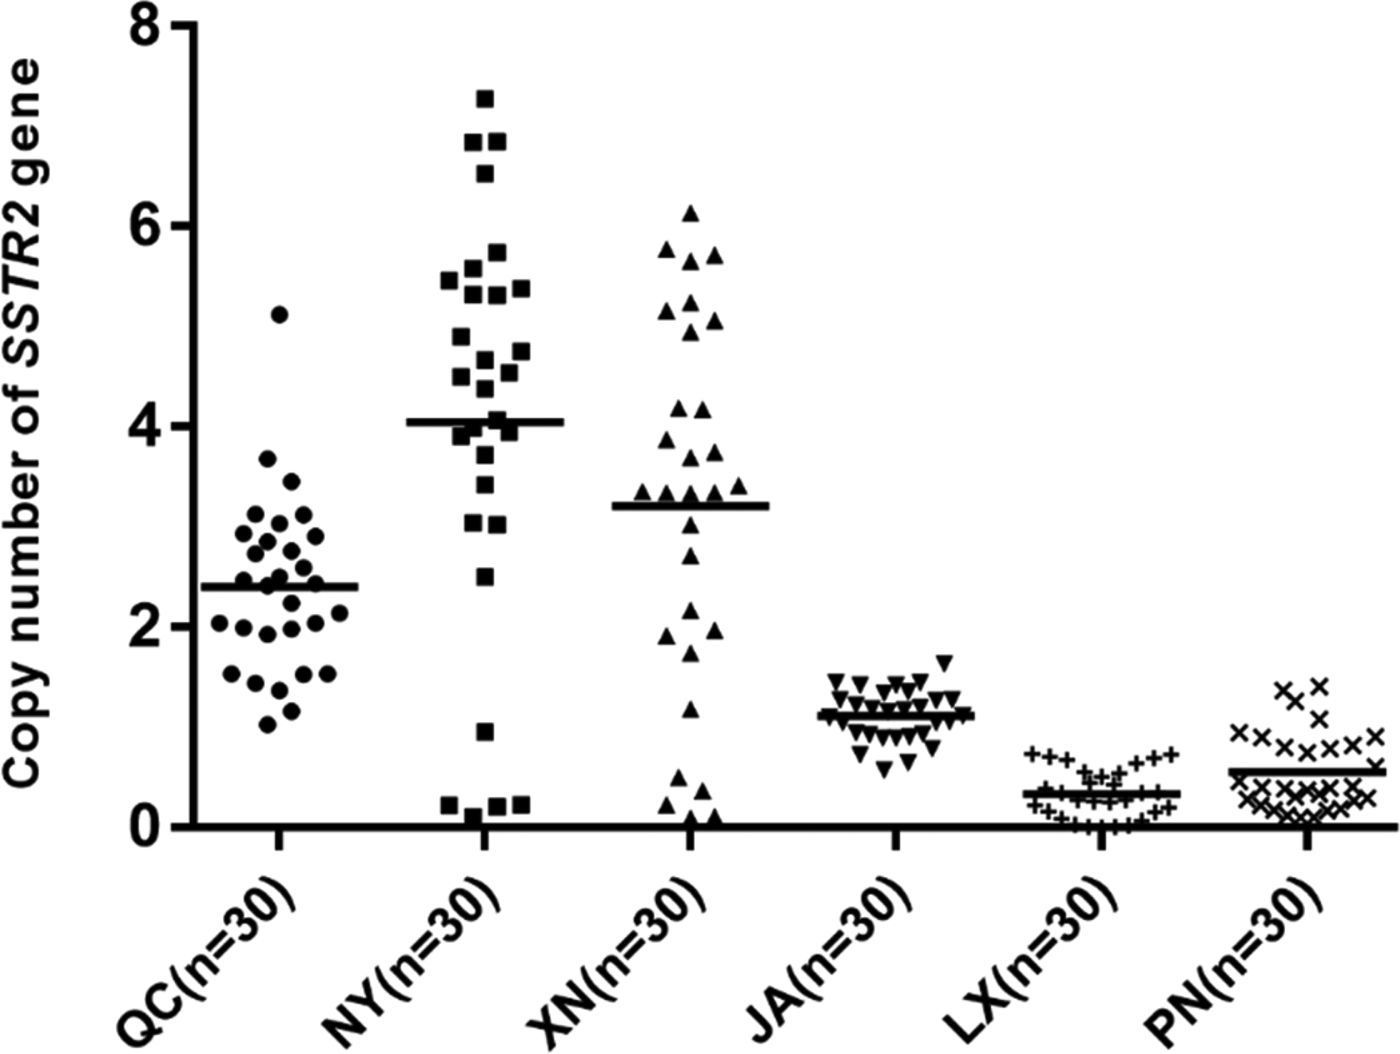
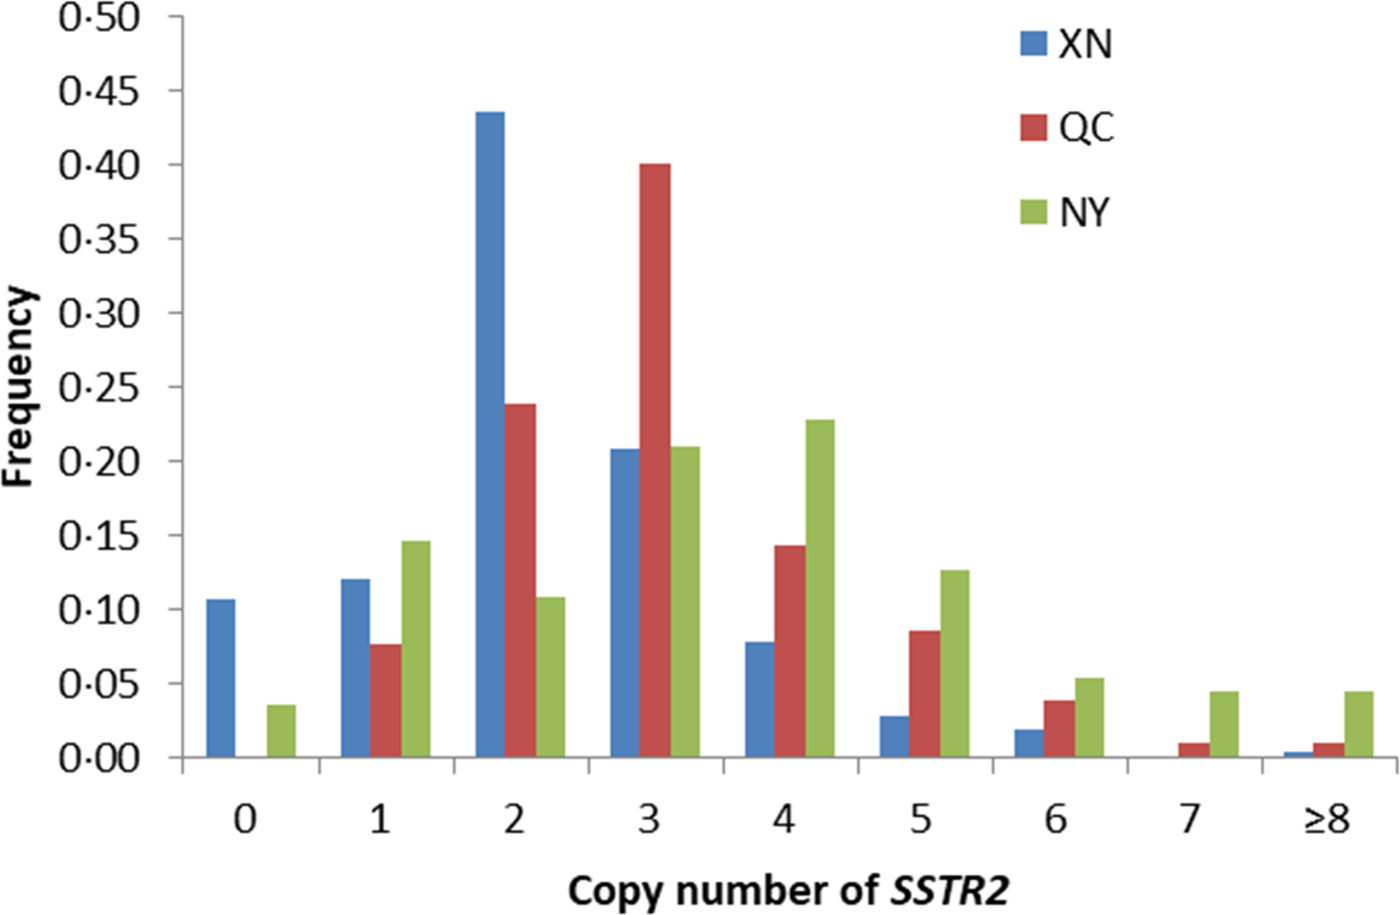
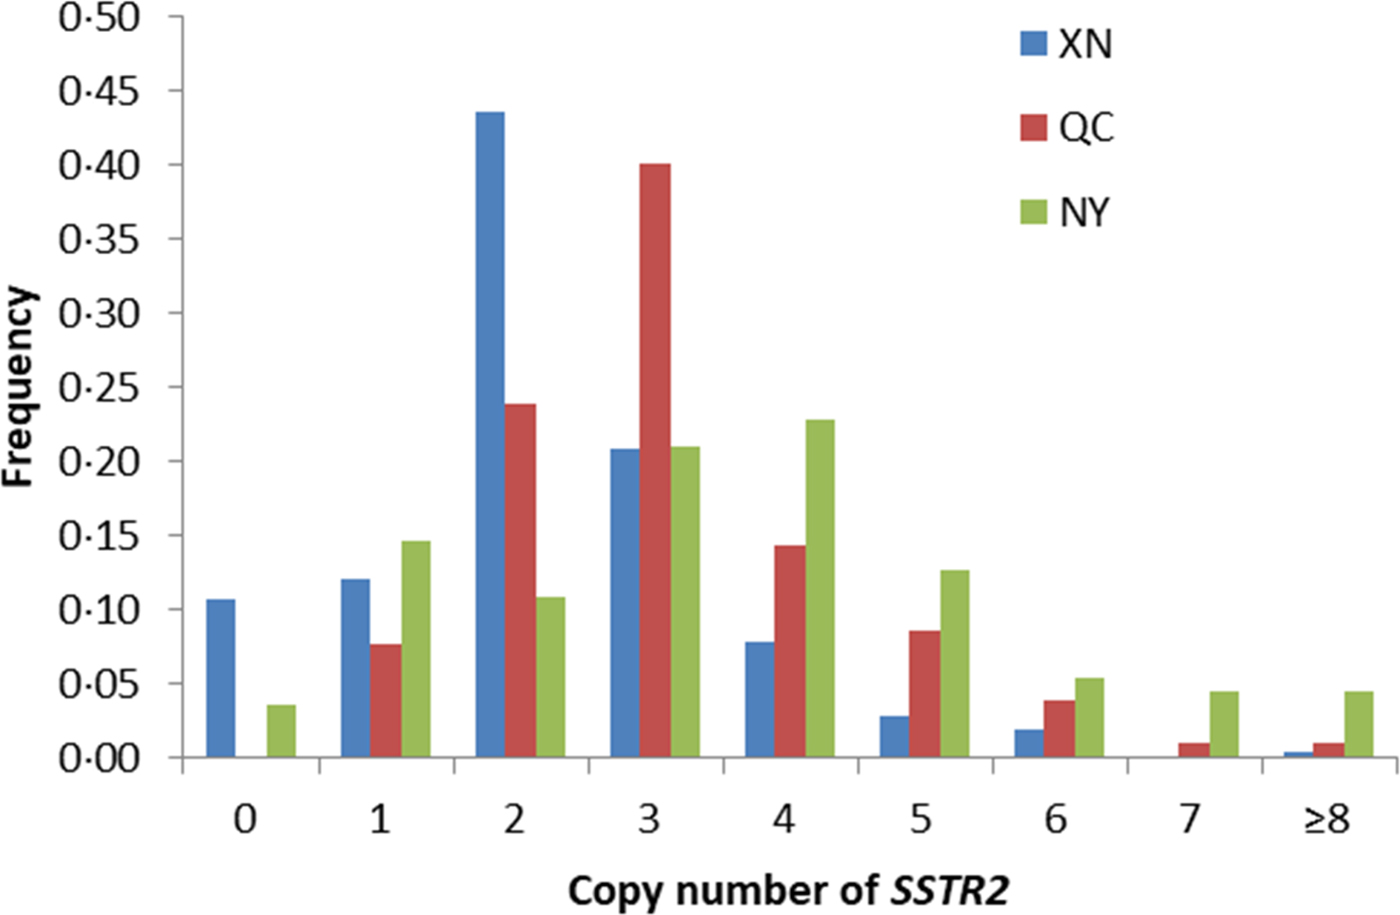
In a previous study, the cattle SSTR2 gene was mapped to CNVR317 using aCGH and the customized probes were finely dispersed in this region (Fig. 2). Signal alterations of five or more continuous probes were detected and defined the DNA segment as a CNV. Therefore, as shown in Fig. 3, the SSTR2 CNV polymorphisms were first validated by qPCR in 180 individuals from six Chinese cattle breeds (30 cattle per breed). In detail, XN, QC and NY cattle showed higher CNV polymorphisms in SSTR2 loci than that of JA, LX and PN cattle. Based on this initial finding, the population sizes of QC, NY and XN were enlarged for further analysis. As illustrated in Fig. 4, SSTR2 CNV polymorphisms exhibited a normal distribution. The highest frequency was observed for 2, 3 and 4 copies, respectively, in XN (94/216), QC (42/105) and NY (25/110) breeds, suggesting that the phenotypic effects of SSTR2 CNVs may be highly variable in these three breeds.
Copy number distributions of the SSTR2 in detecting panel calculated by 2−ΔΔCt. Note: QC (n = 30), Qinchuan cattle; NY (n = 30), Nanyang cattle; XN (n = 30), Xia'nan cattle; LX (n = 30), Luxi cattle; JA (n = 30), Jian cattle; PN (n = 30), Pinan cattle.

Copy number frequencies of the SSTR2 in large experimental groups calculated by 2−ΔΔCt. Colour online. Note: QC (n = 106), Qinchuan cattle; NY (n = 111), Nanyang cattle; XN (n = 217), Xia'nan cattle. Histograms show the frequency of individuals with different copy number. Copy numbers were rounded to the nearest integer.
Associations between SSTR2 copy number variations and growth traits in Chinese cattle
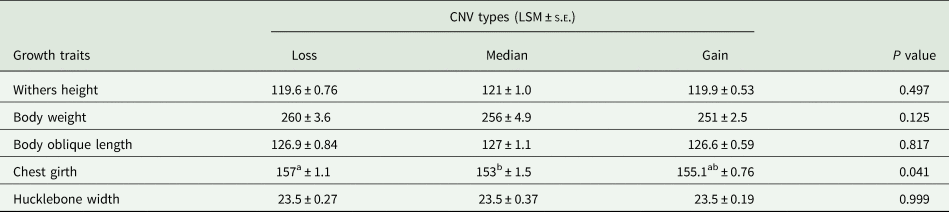
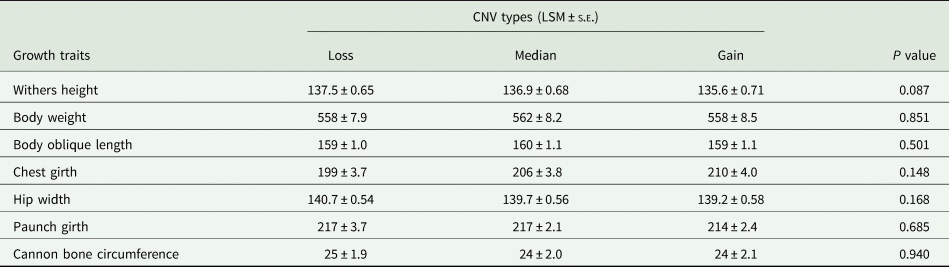
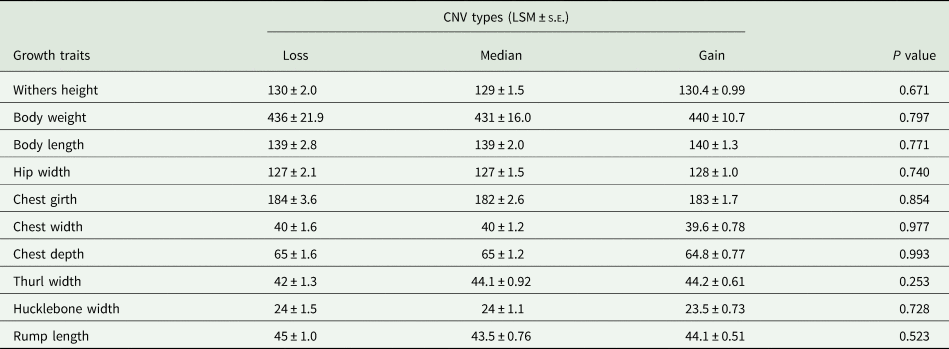
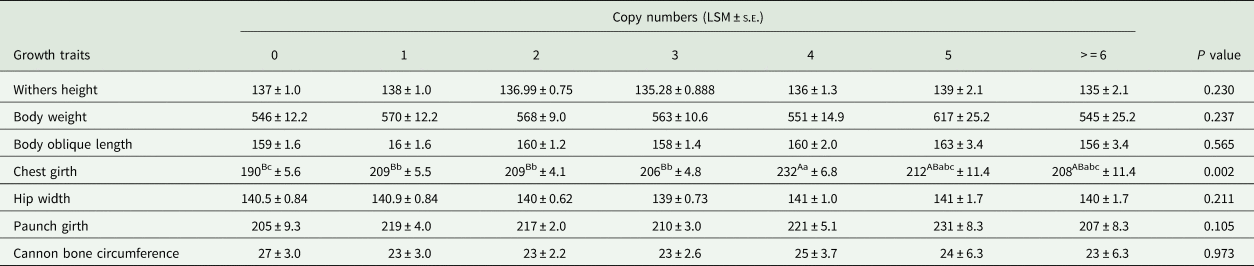
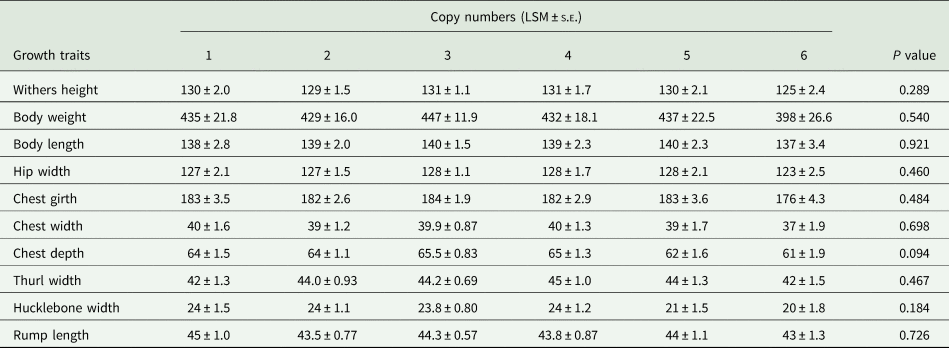
Three Chinese native cattle breeds, XN (n = 216), QC (n = 105) and NY cattle (n = 110), were used to analyse the association between SSTR2 CNVs and growth traits. Table 2 shows an overview of the association of SSTR2 CNVs with chest girth in NY cattle. In detail, the NY cattle with loss type of CNV had larger chest girths than those with the medium type (P < 0.05). From the data presented in Tables 3 and 4, no significant differences were detected in XN and QC cattle (P > 0.05). Next, the influence of different copy numbers on growth traits was analysed (Tables 5 and 6). The results presented in Table 5 were generally in agreement with the analysis of CNV types in NY cattle, in which copy numbers were significantly correlated with growth traits of chest girth (P < 0.01). Consistently, individuals with 0 copies had larger chest girths than those with more copies of the CNV. In XN cattle, the SSTR2 copy numbers also had a significant effect on chest girth (P < 0.01), but the 4 copy was the advantageous variant type (Table 6). Above all, the data indicated that SSTR2 CNV had effects on chest girth in NY and XN cattle. Additionally, as shown in Table 7, the SSTR2 CNV had no effects on QC growth traits (P > 0.05). Notably, the CNV explained 6.4% variance of chest girth in the NY population.
Association between SSTR2 CNV types with cattle stature in NY cattle
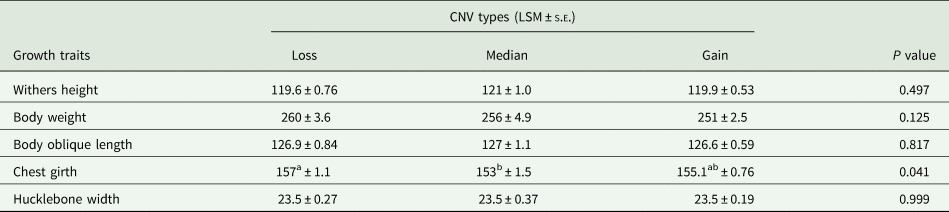
Different letters in the same row mean significant difference (a, b: P < 0.05; A, B: P < 0.01). CNV, copy number variation; NY, Nanyang cattle; LSE, least square means; s.e., standard error.
Association between SSTR2 CNV types with cattle stature in XN cattle

CNV, copy number variation; XN, Xia'nan cattle; LSE, least square means; s.e., standard error.
Association between SSTR2 CNV types with cattle stature in QC cattle

CNV, copy number variation; QC, Qinchuan cattle; LSE, least square means; s.e., standard error.
Association between SSTR2 copy numbers with cattle stature in NY cattle

Different letters in the same row mean significantly difference (a, b: P < 0.05; A, B: P < 0.01). CNV, copy number variation; NY, Nanyang cattle; LSE, least square means; s.e., standard error.
Association between SSTR2 copy numbers with cattle stature in XN cattle

Different letters in the same row mean significantly difference (a, b: P < 0.05; A, B: P < 0.01). CNV, copy number variation; XN, Xia'nan cattle; LSE, least square means; s.e., standard error.
Association between SSTR2 copy numbers with cattle stature in QC cattle

CNV, copy number variation; QC, Qinchuan cattle; LSE, least square means; s.e., standard error.
Correlation analysis of SSTR2 copy number variation and mRNA expression level
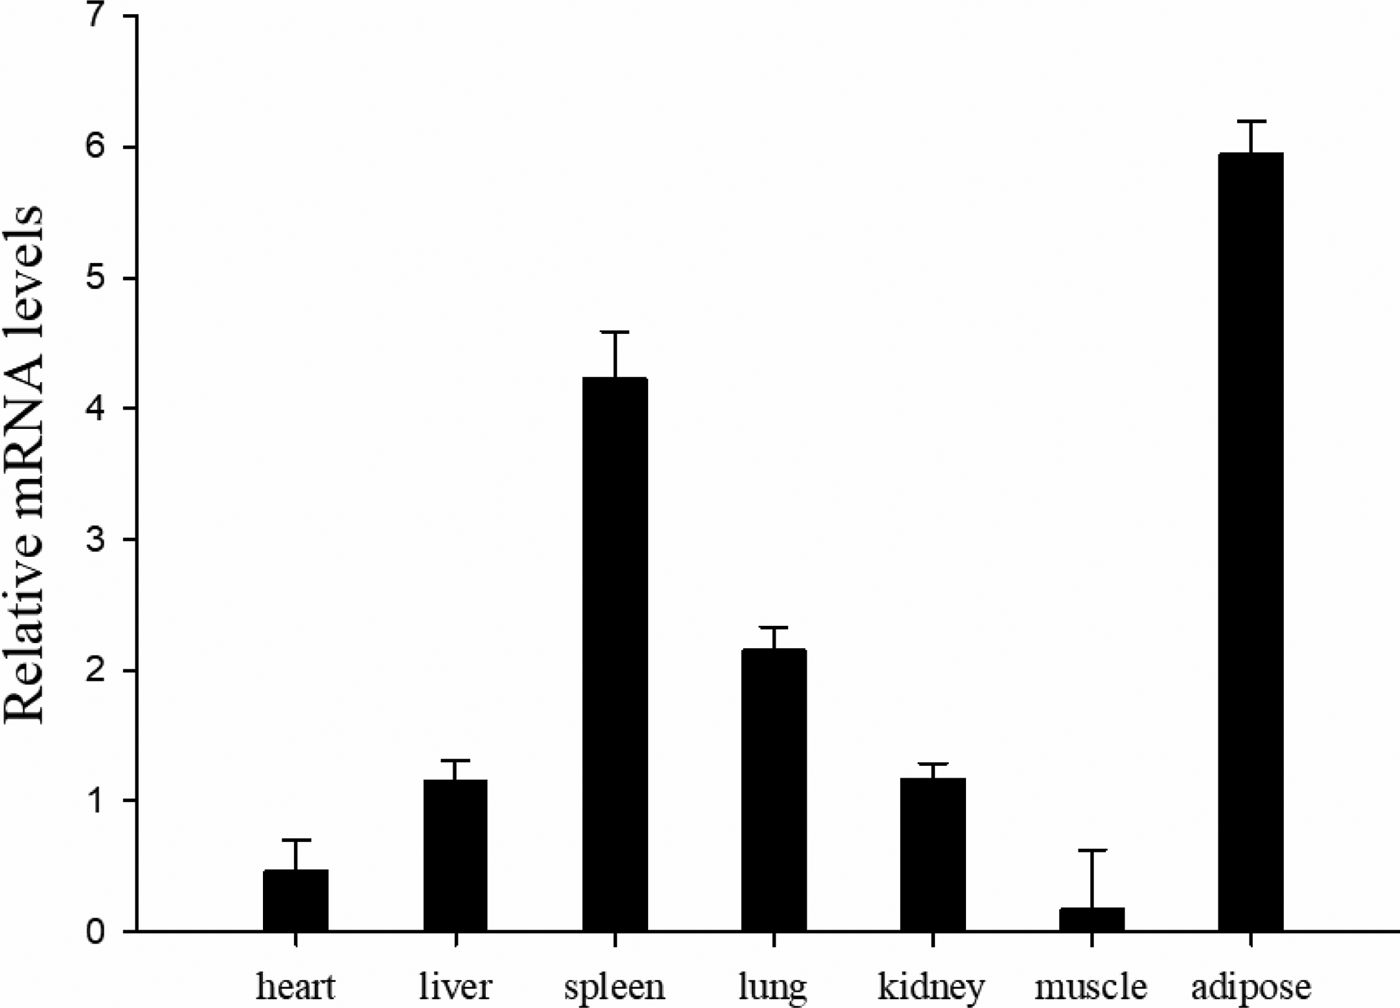
The current study firstly investigated the correlation of mRNA level and SSTR2 CNVs. First, expression profiling was performed for seven tissues, heart, liver, spleen, lung, kidney, skeletal muscle and adipose tissue samples from NY cattle. As shown in Fig. 5, the mRNA of SSTR2 was widely expressed in adult cattle tissues. The highest abundance was observed in adipose tissue, suggesting that SSTR2 has great effects on adipose tissue.
Expression profiling of SSTR2 in different tissues of adult NY cattle (n = 3). Note: Error bars represent the standard error (s.e.) (n = 3). The relative mRNA expression levels of SSTR2 were normalized to ACTB and GAPDH.

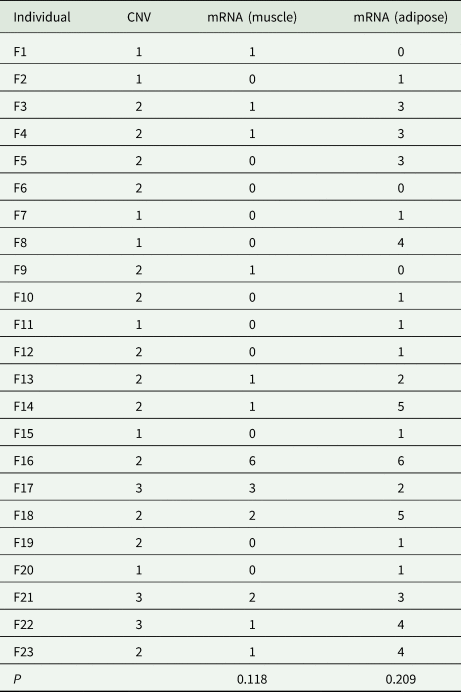
Because the quality of beef was an indicator in cattle breeding and the highest expression of SSTR2 was seen in adipose tissue, muscle and adipose tissue were selected for sampling. The correlation of SSTR2 CNVs with mRNA expression levels was analysed based on data from 23 adult NY cattle. It can be seen from the data presented in Table 8 that the copy numbers ranged from 1 to 3, with variation in mRNA expression both in muscle and adipose tissue, ranging from 0 to 6. However, no correlations were observed by analysis of these data (P muscle = 0.118 and P adipose = 0.209).
Correlation analysis between the SSTR2 CNVs and relative expression of SSTR2 in adult muscle and adipose tissues in NY cattle (n = 23, F1–F23)

CNV, copy number variation; NY, Nanyang cattle.
Discussion
With improvements in living standards, the demands for beef quantity and quality continue to grow. Marker-assisted selection (MAS) could compensate for traditional breeding methods to help meet the needs of consumers. For MAS, critical molecular markers need to be discovered and exhibit potent usage in genomics-assisted breeding programmes. Cao et al. (Reference Cao, Huang, Ma, Cheng, Qu, Ma, Bai, Tian, Lin and Ma2018) reported that extracting causal genes underlying economic traits from QTL using the candidate gene method is a central strategy utilized in livestock breeding (Cao et al., Reference Cao, Huang, Ma, Cheng, Qu, Ma, Bai, Tian, Lin and Ma2018). So far, common DNA sequence variations, such as SNP and Indels, have been widely used in genome-wide association studies. These approaches have allowed the identification of both critical and independent QTLs; these QTLs have enriched a larger variety of causal effects in the genome (Zheng et al., Reference Zheng, Kuang, Lv, Cao, Sun, Jin and Sun2017; Huang et al., Reference Huang, Cao, Guo, Li, Wang, Yu, Zhang, Zhang and Zhang2019).
In the current study, the SSTR2 CNV was found to be located in important QTLs (Boichard et al., Reference Boichard, Grohs, Bourgeois, Cerqueira, Faugeras, Neau, Rupp, Amigues, Boscher and Leveziel2003; Bennewitz et al., Reference Bennewitz, Reinsch, Guiard, Fritz, Thomsen, Looft, Kuhn, Schwerin, Weimann, Erhardt, Reinhardt, Reents, Boichard and Kalm2004; Moemke et al., Reference Moemke, Scholz, Doll, Rehage and Distl2008; McClure et al., Reference McClure, Morsci, Schnabel, Kim, Yao, Rolf, McKay, Gregg, Chapple, Northcutt and Taylor2010), which implies that SSTR2 CNV may be an important causal mutation for growth traits. In a previous CNV study by aCGH, cattle SSTR2, the full length of which is 6862 bp, was mapped to CNVR317 and located between probes CHR19FS060526494 and CHR19FS060529772. The probes in CNVR317 (chr19: 58598786-59376845, UMD 3.1.1) were finely dispersed, with a high density of about 30 probes per million bases. In the current study, specific primers were designed for SSTR2 to validate the CNVs in six Chinese cattle breeds. The copy numbers in XN, QC and NY cattle were more dispersed than that in JA, LX and PN cattle. Accordingly, association analysis was conducted in XN, QC and NY cattle. Interestingly, individuals with low copy number showed better performance than the median and high copy number groups for chest girth in NY cattle. Although classifying copy number measurements as discrete values of ‘Gain’, ‘Loss’ or ‘Median’ in each sample is a standard practice in CNV analysis, this approach may lose some information that is present in the original measurements. Consequently, the copy numbers (0, 1, 2, 3, 4, 5 and ⩾6) were also fitted as fixed factors with seven levels in the model. Copy number with 0 levels had better chest girth than others in NY cattle (P < 0.01), which was consistent with the results above. SSTR2 was reported in previous studies to have anti-proliferative effects on the Wnt/β-catenin pathway (Buscail et al., Reference Buscail, Esteve, Saint-Laurent, Bertrand, Reisine, O'Carroll, Bell, Schally, Vaysse and Susini1995; Chen et al., Reference Chen, Liang, Li, Yang, Wang and Long2009; Wang et al., Reference Wang, Bao, Liang, Long, Xiao, Jiang, Liu, Yang and Long2013b), which may lead to better growth traits for individuals with low copy number. It can be seen from the current results that low copy number improved livestock growth traits, suggesting that the SSTR2 CNV could be used as a molecular marker for NY cattle breeding. Next, CNV in the model (0, 1, 2, 3, 4, 5 and ⩾6) in XN cattle also exhibited a significant effect on chest girth. However, four copies were the advantageous type in XN. This is possibly because XN, a cultivated breed, has a crossbred genetic background, leading to the advantageous genotype of four copies. The results reveal that each breed has a specific genetic background which leads to various effects of different CNV polymorphisms. Overall, the CNV in SSTR2 exerted a remarkable effect on chest girth, suggesting the quantity of meat can be improved.
Notably, the lower copy number had more positive effects on NY chest girth and intricate mechanisms may account for this unexpected result. Dosage effect is a key mechanism underlying the phenotypic effects of CNVs (Henrichsen et al., Reference Henrichsen, Chaignat and Reymond2009; Karimi et al., Reference Karimi, Esmailizadeh, Wu and Gondro2018). To determine the potential mechanisms of dosage effect, expression analyses were performed and revealed that the mRNA of SSTR2 was widely expressed in the different tissues, especially adipose. The quality of beef is an indicator of cattle breeding and the highest expression of SSTR2 is detected in adipose tissue. Therefore, the correlation was analysed between SSTR2 CNVs and its mRNA abundance in muscle and adipose tissue. Unfortunately, there were no significant correlations between SSTR2 mRNA level and CNVs, suggesting that other complex interactions might contribute to the phenotypic effects of this CNV.
The variation of copy numbers may affect phenotypes through several different mechanisms. For example, (1) position effects of CNV: the variation of copy number can affect gene expression by influencing the relative position of a regulating factor and the gene. This effect can work even with a 1 Mb distance from the gene. (2) Fusion effects of CNV: the CNV may lead to the generation of fusion genes, which may have a new function. (3) Copy number variation in an encoding region will change the protein structure domain, thus affecting the structure and function of the protein (Hollox and Hoh, Reference Hollox and Hoh2014). (4) A variation of copy numbers can also lead to the deletion of dominant alleles, which have inhibitory effects on recessive alleles, exposing a latent gene and resulting in the mutant phenotype (Beckmann et al., Reference Beckmann, Estivill and Antonarakis2007).
Currently, there is keen interest in the identification of genetic loci that lead to livestock trait variations. Often, candidate gene methods are based on rudimentary knowledge about gene function or some presumed effects of candidate causal variants, which do not provide comprehensive mechanistic understanding (Karim et al., Reference Karim, Takeda, Lin, Druet, Arias, Baurain, Cambisano, Davis, Farnir, Grisart, Harris, Keehan, Littlejohn, Spelman, Georges and Coppieters2011). However, in recent decades, advances in integrative omics technologies such as genomics, transcriptomics, proteomics and metabolomics have begun to make accurate animal breeding possible at an extraordinarily detailed molecular level (Ritchie et al., Reference Ritchie, Holzinger, Li, Pendergrass and Kim2015; Karczewski and Snyder, Reference Karczewski and Snyder2018). The current results are preliminary and further investigations should provide a mechanistic understanding of the genetic causality of SSTR2 CNV.
Conclusion
This is the first analysis of the distribution of SSTR2 CNV in six Chinese native cattle breeds. The association analysis of SSTR2 CNV and phenotypic traits indicated that the SSTR2 CNV can be used as a molecular marker for NY cattle breeding programmes.
Financial support
The current work was supported by the National Natural Science Foundation of China (no. 31772574), the Program of National Beef Cattle and Yak Industrial Technology System (CARS-37), Science and Technology Plan Project of Yangling Demonstration Area in 2018.
Conflict of interest
None.
Ethical standards
The current experiment was approved by the Northwest A&F University Ethics Committee.