INTRODUCTION
Non-point source (NPS) pollution from agricultural production can cause polluted runoff and have a significant impact on water quality. Control of NPS pollution is difficult as it often involves complex transport and transformation processes via different avenues, such as runoff to surface water, leaching to groundwater and atmospheric deposition (Campbell et al. Reference Campbell, D'Arcy, Frost, Novotny and Sansom2004). For a few decades, best management practices (BMPs) have been introduced for restoring and protecting the surface water quality at a watershed level (Smith et al. Reference Smith, Peterson and Leatherman2007). The watershed approach relies on environmental management which requires cooperation from both public and private sectors. A watershed-based programme is recommended by the United States Environmental Protection Agency (US EPA Reference EPA2003), for environmental, financial, social and administrative reasons. Further, it can help define a clear problem, which then identifies a corresponding plan for improvement.
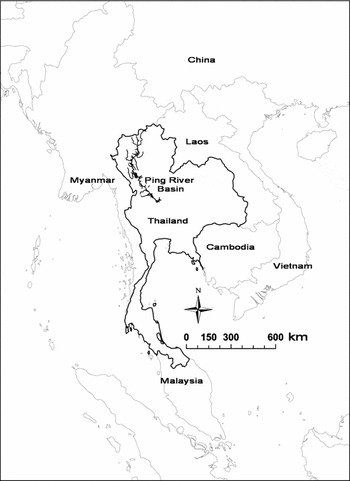
In Thailand, concern over NPS pollution was first publicly aired in the late 1990s (Tonmanee & Kanchanakool Reference Tonmanee and Kanchanakool1999). More recently, the government has considered the role of BMPs to control agricultural NPS pollution at the watershed level (Water Quality Management Bureau 2006). Of all the major watersheds in Thailand, the Ping river basin (Fig. 1) is strategically important in terms of its upland location, population density, economic integration and role as a cultural centre (Thomas Reference Thomas2006). However, it is faced with serious water resource degradation that causes conflict over land use (Thomas et al. Reference Thomas, Preechapanya and Saipothong2004).
Map of the Ping river basin.

Amongst all cultivation practices carried out in the Ping, citrus is one of the most preferred crops because of high consumer demand and lucrative returns (DOA [Department of Agriculture] 2004). Growers from central Thailand are increasingly migrating to the Ping to find new arable land (DOA 2004). Cultivated areas have thus expanded rapidly and become a source of NPS pollution (PCD [Pollution Control Department] 2007). Citrus cultivation has the highest average intensity of insecticide usage compared to other cash crops (Jungbluth Reference Jungbluth2000). Moreover, an encroachment of citrus farms into reserve forest causes forest loss and acceleration of soil erosion, which is as high as 7.77 kg m−2 per annum (Marod et al. Reference Marod, Watcharinrat, Duengkae and Jenkitkarn2005). Thus, the Ping, which is linked extensively with other waterways, is susceptible to contamination, and prevention measures are needed to regulate the generation and discharge of pollutants into waterways.
Farm pollution is an externality that can be addressed using various forms of governmental regulation (Novotny Reference Novotny, Petchey, D'Arcy and Frost1998). Questions about the appropriate forms of regulation are highly contested by different groups of stakeholders. The debate is not helped by an absence of a scientific evidence base specifically linking the emerging agricultural causes and impacts of NPS pollution (Stanley Reference Stanley2000). Moreover, the nature of NPS pollution requires the focus of efficient regulation on land-use activity rather than end-of-pipe control (Loehr Reference Loehr1984; Gunningham & Sinclair Reference Gunningham and Sinclair2005). Global experience suggests that there is a general regulatory preference for voluntary behavioural changes rather than more punitive measures or more administratively complex economic incentive measures (Woodhead et al. Reference Woodhead, Legg and Packham2004; Segerson & Wu Reference Segerson and Wu2006; Yeager Reference Yeager2007). In agriculture, adoption of BMPs is a common voluntary approach to tackle farm pollution (Campbell et al. Reference Campbell, D'Arcy, Frost, Novotny and Sansom2004). However, in the design and implementation of new policies there is a pervasive economic assumption that farmers’ behaviour is homogeneous, unboundedly rational and constrained by profit maximization goals (Edwards-Jones et al. Reference Edwards-Jones, Deary and Willock1998; Rabin Reference Rabin1998; Venkatachalam Reference Venkatachalam2008). Further, there is a surprising lack of research concerning behavioural responses to environmental policy instruments (Shogren & Taylor Reference Shogren and Taylor2008). This suggests that more research needs to be focused on identifying underlying attitudinal positions that may explain alternative behavioural responses. To investigate attitudinal differences, this paper applies Q-methodology (Webler et al. Reference Webler, Danielson and Tuler2007) to identify subgroups of Thai citrus farmers based on their perceptions of BMPs directed at water quality improvements. The ultimate goal of this study is to consider how regulatory policy can be informed by subjective attitudinal information on BMPs.
METHODS
Q-methodology is used to study subjectivity and discover attitudinal patterns (Webler et al. Reference Webler, Danielson and Tuler2007). Participants are instructed to sort statements, previously gathered from interviews and literature reviews, about a particular topic according to their beliefs. Then, the techniques of factor analysis and factor rotation are used to identify subgroups of participants based on similar viewpoints. Q-methodology is increasingly being used to investigate attitudes towards particular policy issues and to inform policy decisions, such as those relating to genetically modified crop cultivation (Hall Reference Hall2008), land use and management (Davies & Hodge Reference Davies and Hodge2007; Barnes et al. Reference Barnes, Toma, Hall and Willock2007), community acceptance of wind farms (Ellis et al. Reference Ellis, Barry and Robinson2007), adoption of biologically integrated agricultural practices (Brodt et al. Reference Brodt, Klonsky, Tourte, Duncan, Hendricks, Ohmart and Verdegaal2004) and forest management (Steelman & Maguire Reference Steelman and Maguire1999). In Thailand, Q-methodology has recently been applied in relation to policy perspectives of an epidemic disease (Brown & Wattanakul Reference Brown and Wattanakul2008).
Q-methodology offers several methodological advantages over other predictive multivariate analyses of behaviour. Firstly, Q-methodology is self-referent and does not require pre-defined attitudinal variables framed by the researcher. Rather it draws directly on discourse from the population studied, hence reducing researcher bias (Barnes et al. Reference Barnes, Toma, Hall and Willock2007). Secondly, Q-methodology comprises both quantitative and qualitative steps (Brown Reference Brown1996). The combination of numerical analysis and qualitative interpretation combines statistical significance with clarification of attitudes (Barry & Proops Reference Barry and Proops2000), thereby increasing the level of research reliability and validity (Furlong et al. Reference Furlong, Lovelace and Lovelace2000; Silverman Reference Silverman2006).
Lastly, the use of factor analysis (FA) in Q-methodology relies on an approach different from the typical use of FA (Hair et al. Reference Hair, Black, Babin and Anderson2009). In Q-methodology participants are the variables, which are correlated with each other to produce factors linking those participants who have similar attitudinal perspectives. In contrast, the typical FA provides analysis based on differences amongst all participants for each variable such as age and gender, and there is no interaction between participants (Fairweather et al. Reference Fairweather, Swaffield and Simmons1998; Steelman & Maguire Reference Steelman and Maguire1999). The different philosophy on which Q-methodology is based provides an alternative lens through which to view preferences, values and interests underlying participants’ understanding related to the research topic (Durning & Brown Reference Durning, Brown and Morcol2006; Brown et al. Reference Brown, Durning, Selden, Miller and Yang2008).
Concourse development and establishing the Q-sample
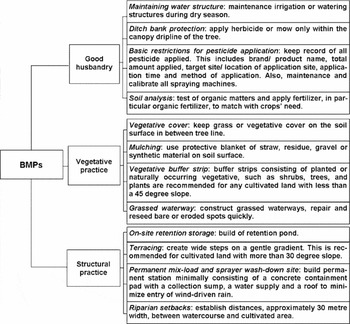
The flow of information surrounding any topic in a Q application is termed a ‘concourse’. It is from this concourse that a sample of statements is subsequently drawn for administration in a sorting process (Brown Reference Brown1991). In this study, the concourse relating to BMP adoption was collected from document review and personal interviews based on a set of 13 open-ended questions. Example questions are: ‘what do you believe are the advantages/ disadvantages of BMP uptake?’, and ‘are there any conservation practices done on your farm and what are they?’. Seventeen citrus growers were interviewed in June 2007. They were firstly informed about possible effects of citrus production on water quality and briefly introduced to 12 BMPs selected by Thai agronomists as being those most relevant to citrus farming in the study area (Fig. 2).
BMP descriptions.

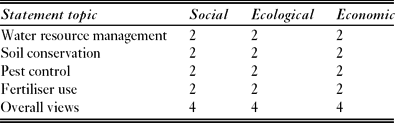
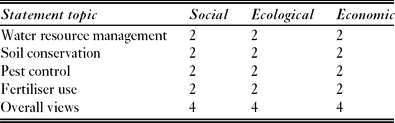
We derived a set of 419 statements, including 91 statements from printed materials and 328 statements from the personal interviews. These were grouped by issue, and a matrix was used to categorize the statements (Table 1). The thematic categories on the horizontal axis were based on the concept of sustainable agriculture, while those on the vertical axis were based on technical aspects of BMPs. Using this matrix, we selected a total of 36 statements for the Q-sample.
A two-dimensional matrix for statement categorization. The number represents total statements chosen from each corresponding cell and thus yields a total set of 36 statements for the analysis.
Administering the Q-sort
The statement sorting (ranking) exercise was undertaken in December 2007 and August 2008. Theoretically, the number of participants does not have to be large to ensure the comprehensiveness of factors and the reliability of the factor arrays (Brown Reference Brown1980, p. 92). In this study, 72 participants were purposively selected, based on farm size, education level and age, to represent farmers from different areas in the Ping river basin (51% were upstream farmers and 49% were downstream farmers).
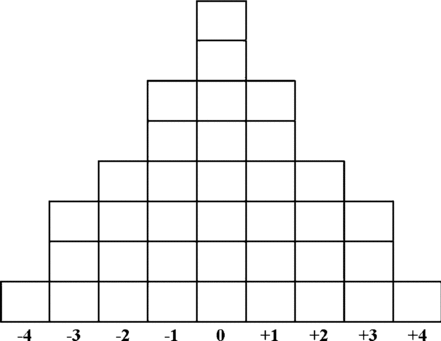
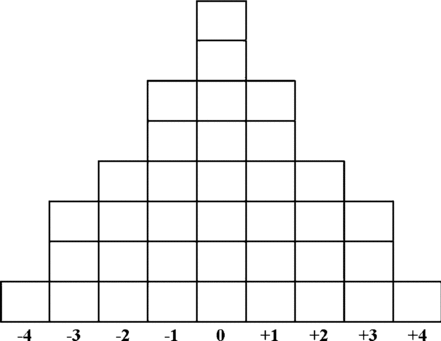
During the survey, all participants were provided with: (1) 36 cards, each containing a statement and its number, (2) a guide bar with a quasi-normal distribution (Fig. 3), and (3) an answer sheet to record the rank ordering. They were then instructed to read all statements, sort the cards according to the extent to which they disagreed or agreed with them (−4 to +4) and to place the cards on the guide bar. Participants were also interviewed about their own experience of citrus farming, current problems and opinions about BMPs.
Guide bar with quasi-normal distribution (for 36 statements).
Data analysis
Each participant's Q-sort was entered into a database using PQMETHOD software (Schmolck Reference Schmolck2002). Initially, a correlation matrix of Q-sorts was analysed using principal components analysis. This provided eight unrotated factors with eigenvalues > 1.0. Next, we used Varimax rotation to rotate the factors, thereby investigating a two, three, four, five, six, seven and eight factor solution. The four factor solution produced the most statistically defensible model providing a uniquely satisfactory account of the data. Thus, this study reveals four factor groups or discourses.
In order to assign Q-sorts to the most appropriate factor, we considered the factor loading of each Q-sort. Loadings were considered statistically significant at the 0.01 level if they were approximately 2.58 times the standard error (SE) (Brown Reference Brown1991). The standard error for a factor loading was derived from 1/√N, where N equals the number of statements (Brown Reference Brown1991). In this case, with 36 statements, the SE = 1/√36 = 0.17. Thus, Q-sorts with either a positive or negative loading on a single factor in excess of 2.58(SE) = 2.58(0.17) = 0.43 were considered to load significantly on that relevant factor. Seven sorts did not load onto any of the four factors and we thus excluded them from further analysis.
RESULTS
Interpreting factor arrays
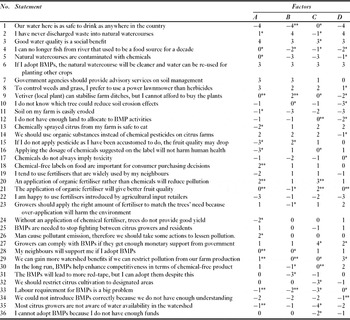
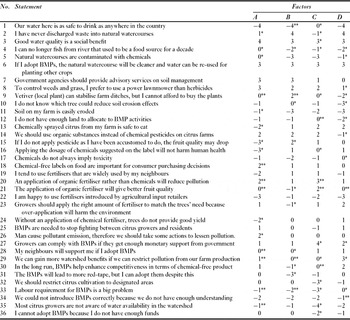
The interpretation of the factors is based on statement scores. The statement score was first computed as a z-score, and then converted into the original Q-sort value format (score -4 to +4) for ease of interpretation. Here, particular attention is given to statements that distinguish between factors and those statements that were ranked at the extremes of the scale (+4, +3, −3 and −4; Table 2). Positive scores indicate that a farmer would agree with that particular statement, whilst negative scores indicate disagreement. Participants’ comments from the post-sorting interviews were also incorporated in the factor interpretation. The four factors are labelled as conservationist, traditionalist, disinterested and risk-averse.
Q-sort value (− 4 to 4, see text for explanation) for each statement. Factor A = conservationist, B = traditionalist, C = disinterested and D = risk-averse. *p < 0 .01, **p < 0.05.
Factor A: conservationist
Fifteen participants, both upstream and downstream farmers, loaded on the conservationist factor. This discourse represents a position that is pragmatic, moderately progressive and environmentally favourable. The main aspect of this discourse is the belief that ‘good quality of environment brings better quality of life’.
Those associated with the conservationist factor group explicitly expressed a preference for the production of safe and good quality products through environmentally friendly practices (statement 15, score −3; statement 24, −2; Table 2). They also demonstrated an interest in minimizing adverse impacts on health and the environment (statement 13, −2; statement 16, −3; statement 20, +2; Table 2). Further, this discourse was the only group expressing a belief that chemical-free labels on food items potentially affect consumers’ buying decisions (statement 18, +2; Table 2).
In terms of water resource issues, this discourse represents a viewpoint that is indifferent in terms of perceptions about current water quality (statement 4, 0; statement 5, 0; Table 2), but farmers in this group stated their awareness of water availability in the watershed (statement 35, −1; Table 2). Further, this group of farmers was relatively confident that more watershed benefits will be gained from BMP adoption (statement 29, +1; Table 2). Some of them also commented during the interviews that government should promote the concept of watershed services and benefits of BMP adoption to induce behavioural change amongst citrus growers. This farmer group also believed that everyone was responsible for taking care of water resources (statement 26, +2; Table 2). Moreover, farmers associated with this discourse not only expressed strong environmental concern, but also presented themselves as environmental protectors (statement 2, +1; Table 2).
Those farmers associated with this discourse did not perceive there to be a problem with soil erosion on their farms (statement 11, −1; Table 2), neither were they concerned about labour requirements being a limitation for BMP adoption (statement 33, −1; Table 2). However, these statements were ranked relatively less negatively than by other groups. Additionally, farmers represented by this discourse expressed neutral viewpoints towards BMP adoption in many aspects. For example, they did not have strong opinions about the consistency of the quality provided by organic fertilizer (statement 21, 0; Table 2), or the readiness of their fellow citizens to participate in more eco-friendly practices (statement 28, 0; Table 2). Further, farmers represented by this factor group did not explicitly express whether they could afford to buy local plants to control soil stability (statement 9, 0; Table 2). However, the interviews suggested that farmers needed advisory support from extension agents in order to achieve better outcomes in soil management.
Conservationists favoured conservation-oriented farming methods because they perceived the necessity of improving human and environmental health. Indeed discussions during farm interviews revealed that farmers had learned through trial and error to use smaller amounts of chemicals but still maintained fruit quality. Overall, the extent of awareness of eco-friendly production of this farmer group was relatively high.
Factor B: traditionalist
Sixteen participants loaded on the traditionalist factor; almost all were from downstream areas. This discourse featured farmers who felt comfortable in their current situation. The views represented by this discourse were characterized by a resistance to change that was underlined by a lack of open-mindedness to the wider world.
Those farmers in this discourse group perceived that water quality was being threatened (statement 1, −4; Table 2), but believed that this situation was bearable as water was classed as fishable (statement 4, −2; Table 2). The resistance to change mainly came from a satisfaction with current agricultural practice which relied on chemicals in order to maintain fruit quality (statement 15, +2; statement 21, −1; statement 23, −1; Table 2). Farmers commented during the interviews that size-graded and good-looking fruit could command higher prices. In other words, chemical-sprayed citrus simply meant guaranteed returns and secure family farming.
The traditionalists also defined other limitations that deterred BMP adoption. These were a lack of faith in the market for eco-friendly products (statement 30, −1; Table 2), and uncertainty over external uncontrollable factors such as governmental procedure (statement 31, −3; Table 2). Interviews revealed that some of the farmers in this group did not feel comfortable with strict government regulations such as enrolment procedures, and paperwork. However, it was evident that finding workers for labour-intensive practices was not a problem for BMP adoption (statement 33, −2; Table 2).
As recorded during the interviews, farmers in this discourse had been informed about the use of local plants to stop runoff and maintain soil stabilization (statement 9, +2; Table 2). However, this contradicts the neutral opinion expressed about the received wisdom and prevailing perceptions of erosion control (statement 10, 0; Table 2). Further, farmers in this group also expressed neutral viewpoints about uncertainty of environmental gains from BMP adoption (statement 29, 0; Table 2) and being socially excluded by non-adopters who were in mainstream agricultural practices (statement 28, 0; Table 2). However, post-sort interviews with farmers revealed that some of them were afraid of being excluded from cultural and economic processes, and of losing informal support networks.
Farmers in this group showed less interest in applying new techniques and preferred current farming practice. As long as current practices provided the main source of livelihood for their family and high uncertainty about adoption of BMPs still prevailed, new production techniques that deviated from the current practice of farming and ways of life would not easily be accepted.
Factor C: disinterested
Seventeen participants loaded on the disinterested factor; almost all participants were downstream farmers. This perspective is characterized by a recognition of resource degradation, self-regard and a distinctive demand for short-term returns. This group was facing lower yields and poorer quality of fruit as a result of pest and disease epidemics.
The views of this group were strongly focused on water availability for crop production and food sources (statement 35, −4; statement 4, −1; Table 2), undoubtedly because citrus production requires a huge amount of water. Though this group did not express strong opinions about water quality degradation (statement 1, 0; Table 2), farmers perceived good water quality as a social benefit (statement 3, +3; Table 2). However, statement 3 was statistically distinguished by having the lowest z-score when compared to the z-scores from the other discourses (Q-sort value format, z-score: +4, 1.98; +3, 1.90; +3, 1.26; +3, 1.77). In other words, those represented by this discourse least agreed with this statement of all groups.
Farmers in this group agreed that sustainability could be promoted through the use of organic substances (statement 20, +3; statement 21, 2; Table 2), but were likely to prefer farming methods that contributed to diffuse pollution (statement 2, −1; Table 2). The interviews revealed that chemical-sprayed fruit was produced in large quantities in order to keep up fruit appearances to meet with consumer demand. Another important viewpoint was found in opinions of citrus zoning, of which this group was not in favour (statement 32, −3; Table 2). In Thailand, crop zoning aims to delineate a suitable area for each important crop in each watershed boundary. With zoning, appropriate technologies and management such as good agricultural practices can be applied to the particular growing area. Disagreement with the practice of crop zoning may imply an unwillingness to change current agricultural activities.
One key viewpoint of this group of farmers was the perception that funds from government were essential for starting a BMP scheme (statement 27, +4; Table 2). This was despite the fact that this group possessed fundamental resources such as labour (statement 33, −3; Table 2), and funds (statement 36, −2; Table 2). Additionally, there were a few statements with which this discourse had a neutral viewpoint. These were related to the use of local plants to stabilize soil (statement 9, 0; Table 2), the availability of land for allocation to BMPs (statement 12, 0; Table 2), impacts of chemical applications on human health (statement 16, 0; Table 2), likely environmental gains from adoption of BMPs (statement 29, 0; Table 2) and the likelihood that BMPs will increase competitiveness by supplying a market for eco-friendly products (statement 30, 0; Table 2).
The farming of this farmer group was economically non-viable, presumably because of an extensive use of chemicals. Moreover, this group strongly expressed the view that financial support from the government was required to start BMPs. Interviews revealed that this money was viewed as a viable tool to promote opportunities in family farming and to secure farm income. In terms of government action, this requirement signals that this farmer group was likely to create better watershed services if reasonable incentives were offered.
Factor D: risk-averse
Seventeen participants loaded on the risk-averse factor. This group featured farmers with the largest average farm size and almost all participants were from upstream areas where the arguments over air pollution and excessive water consumption were always at the top of the agenda. The farmers in this group were market-sensitive, and well informed. However, they had doubts about the net gains from adoption, and thus refrained from implementation due to costs and fear of economic losses.
Those associated with this discourse acknowledged that there were social benefits from farm pollution restrictions (statement 29, +3; Table 2), and preferred to apply more eco-friendly practices in farm management (statement 8, +1; Table 2). The group was also equipped with environmental management knowledge (statement 10, −3; statement 34, −1; Table 2) and displayed a capacity to allocate land to meet with BMPs criteria (statement 12, −2; Table 2). However, during interviews, some citrus growers expressed a refusal to divide their own land for vegetative and structural practices (i.e. buffer zones and onsite retention storage) because they felt that too much land was required and investment costs were high.
Another viewpoint found within this discourse was related to the perception of the current condition of water resources. Those represented by this discourse did not consider that water quality was being threatened (statement 4, −2; statement 5, −1; Table 2). Thus if they must comply with the policy on BMPs, an amount of monetary support was requested from the government (statement 27, +2; Table 2). This was to secure income and to comply with the regulation if particular materials, such as local plants to control soil erosion, were required (statement 9, −2; Table 2).
Further, farmers in this discourse were reluctant to change their current practices. This resistance came from existing attitudes towards chemical use which were compounded by a disagreement that chemicals could be effectively substituted by organic substances (statement 14, −1; Table 2). During the post-sort interviews some citrus growers asserted that consumers bought fruit depending on its product attributes such as physical appearance, rather than production attributes. Thus, the farmers inevitably applied chemicals. They also stated that the government should promote and launch a campaign to raise consumer awareness of chemical-free fruit. Those farmers associated with this discourse displayed neutral viewpoints towards several statements. The group neither agreed nor disagreed about the role of organic fertilizer in boosting fruit quality (statement 21, 0; Table 2), or about labour requirement being a limitation to BMP uptake (statement 33, 0; Table 2). Additionally, farmers associated with this discourse expressed a neutral viewpoint about the toxicity of chemicals (statement 17, 0; Table 2).
This farmer group held a positive attitude towards eco-friendly management, but refused to change. This is because farmers viewed BMP adoption as a risky activity, in that their wealth rested on the success of innovation. This fitted with a managerial profile which emphasizes the goal of reducing variation in income, and gives environmental protection a lower priority than the economics of the farm business.
Consensus statement
There are points of consensus amongst all four factors. One statement that received a statistically indistinguishable z-score and that all factors ranked in the same direction (score +3) is statement 6 (Table 2). All groups agreed that if they adopted BMPs, natural watercourses would be cleaner and could then be safely re-used for planting other crops. This consensus statement suggests that citrus growers perceived natural water resources as economic goods, and essential assets in farming. This is unquestionably because citrus production demands huge amounts of water and the cost of water acquirement is relatively high in terms of effective irrigation systems such as sprinklers. Furthermore, citrus growers had experienced conflict over excessive water consumption amongst various water users in the watershed, as well as arguments between growers and local residents in the critical areas. Therefore, they tended to believe that BMPs could help solve these existing conflicts through less-polluted water and water recycling.
DISCUSSION
Adoption concerns and policy instruments
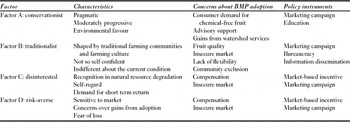
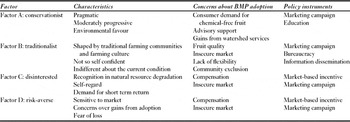
Q-methodology has revealed four groups based on farmers’ attitudes towards BMP adoption. These different perspectives suggest that there are important constraints and concerns that are not always acknowledged when making policy based on the assumption that farmers have the goal of profit maximization. Having captured farmers’ concerns about BMP adoption, we discuss here five policy approaches that could be used to raise farmers’ participation rates in agri-environmental schemes (Table 3).
Characteristics, concerns about BMP adoption and potential policies to address this for each farmer group.
Market-based incentive
The disinterested and risk-averse groups were concerned about the level of compensation to be paid for BMP uptake. To address this, adopting farmers should be compensated for producing the extra benefits that arise from BMPs, otherwise the externality will not be priced and market failure will follow (Sarker et al. Reference Sarker, Ross and Shrestha2008). A market-based incentive of both cash and in-kind compensation could be offered to induce desirable behaviour (Dowd et al. Reference Dowd, Press and Huertos2008). For example, farmers may be compensated for capital installation costs or increased risk in terms of decreased yields over the first few years of implementation (Ribaudo et al. Reference Ribaudo, Horan and Smith1999).
Marketing campaign
While the conservationist realized there was a potential market for eco-friendly products, the traditionalist, disinterested and risk-averse expressed doubts about there being a guaranteed market for chemical-free fruit and concerns about lower fruit quality if organic substances were applied. According to Oates (Reference Oates, Esguerra, Cadilhon and Shepherd2005), Thai consumers find it difficult to distinguish between quality and safety labels, and many of them rely on certain retail chains rather than quality certification. Marketing campaigns to raise awareness about eco-friendly production processes could generate a price premium for sustainable citrus farming (Oates Reference Oates, Esguerra, Cadilhon and Shepherd2005). Such a campaign might help to assuage farmers’ concerns about there not being a market for chemical-free produce, and, in turn, increase the likelihood of voluntary adoption for all farmer groups.
Bureaucracy
Bureaucratic barriers, such as government regulations, paperwork requirements, participation and eligibility requirements, are some of the main concerns for the traditionalists. If BMPs are being promoted as a policy, the government should launch simple regulations and make procedures flexible in order to simplify communication between farmers and government (Kosoy et al. Reference Kosoy, Corbera and Brown2008).
Education
Previous studies suggest that a lack of information about profitability and environmental benefit has deterred farmers from the adoption of proper management practices (FAO [United Nations Food and Agriculture Organization] 2007). This is supported by our interviews with the conservationists, who agreed that education could open the door to opportunity for every farmer. For example, science-based information could lower the risk perceptions of the risk-averse and enable the traditionalist and disinterested to improve their understanding about positive outcomes from adoption. Information could help to revise farmers’ perceptions regarding the cost effectiveness of new farming practices and environmental benefits (Feather & Amacher Reference Feather and Amacher1994). Farmers should be informed that their farming depends on, and generates, a wide range of ecosystem services, including watershed services such as water flow and water quality. This can be done through training or extension workshops under the instruction of expert farmers (Brookfield & Gyasi Reference Brookfield and Gyasi2009; Hashemi et al. Reference Hashemi, Mokhtarnia, Erbaugh and Asadi2008). Ramsey and Hungerford (Reference Ramsey, Hungerford, Dietz and Stern2002) suggested that environmental education offered through the schooling system is critical for removing barriers to the adoption of more eco-friendly practices producing ecosystem services.
Information dissemination
Traditionally, farm supply shops serve as a meeting place and information centre for Thai farmers (Oates Reference Oates, Esguerra, Cadilhon and Shepherd2005). Those who step out of mainstream farming could face significant social pressures, including being excluded by neighbours (de Buck et al. Reference de Buck, van Rijn, Roling and Wossink2001). This was one of the concerns exposed during the post-sort interviews with traditionalists. Because supply shop retailers play an important role in information transfer, they could potentially provide extension services, for example acting as a BMP innovation dissemination point for farmers (FAO 1999; Fuwa & Sajise Reference Fuwa and Sajise2006).
Policy interventions
The four discourses indicate differences between the ways in which citrus growers view BMP adoption and how they might therefore be encouraged to adopt practices aimed at reducing NPS pollution. The results suggest that there might be an opportunity to promote BMPs, as farmers generally hold positive environmental values regarding water resources. For example, an area of consensus amongst all four factor groups signals that voluntary participation could be raised by presenting BMPs as a way to conserve water.
The bottom-up results from Q-methodology provide policy makers with information for sustainable policy development. However, caution is needed when policy makers target different programmes to different farmer groups. For example, the traditionalist and disinterested groups are mainly downstream farmers, while almost all of the risk-averse farmers are upstream farmers with relatively large farms; however assuming that these particular characteristics are likely to be consistently defining variables may not be justified (Raje Reference Raje2007). There were some downstream farmers who were represented by other discourses, thus being a downstream farmer was not the only reason for being defined as a traditionalist or disinterested. Similarly, there were some large-scale upstream farmers who did not load on the risk-averse discourse. In conclusion, farmers in the Ping river basin held a number of perspectives towards BMPs, but these were not consistently related to farm or farmer characteristics. Q-methodology is not an approach that aims to identify certain socioeconomic groups and their associated views. We can merely identify what different perspectives exist and also what farmers share as common perspectives about BMP uptake.
CONCLUSIONS
This analysis is a first step to understanding the attitudes of citrus growers’ in the Ping river basin towards the adoption of BMPs targeted at improving water quality and thereby reducing NPS pollution. Growers varied in their attitudes and could be classified into four groups. The differences in attitudes also reflected perceptions of natural resource degradation, farming experience and attitudes towards sustainable agriculture. However, there was an area of consensus in that all groups held the opinion that adoption could result in ‘good’ water quality. Despite this agreement, farmers may or may not voluntarily adopt BMPs, and persuading farmers to convert traditional agricultural practices to more eco-friendly production is challenging.
As participants in the Q-study were not randomly selected, we cannot make reliable generalizations about farm or farmer characteristics (Danielson Reference Danielson2009). However, Q-methodology facilitates decision-making by highlighting relatively important attitudes about the topic being studied (Durning & Brown Reference Durning, Brown and Morcol2006). A few dominant concerns do emerge and provide some insights relating to the key factors affecting potential BMP adoption. Policy interventions may need to vary group by group. Different instruments will have varying success within different groups given the variation in the motivations and interests across groups (Davies & Hodge Reference Davies and Hodge2007).
ACKNOWLEDGEMENTS
This work was carried out with support from the Economy and Environment Program for South-east Asia (EEPSEA) which is administered by the International Development Research Centre. EEPSEA is also supported by the Swedish International Cooperation Development Agency, and the Canadian International Development Agency.