




1 Introduction
Laser sources operating near 780 nm, corresponding to the D2 transition line of rubidium (87Rb) atoms, constitute a cornerstone of modern quantum optics and atomic physics. High-performance sources in this spectral band are indispensable for fundamental applications ranging from laser cooling and trapping[ Reference Phillips 1 ] to Bose–Einstein condensation (BEC)[ Reference Anderson, Ensher, Matthews, Wieman and Cornell 2 ] and high-precision inertial sensors based on atom interferometry, such as atomic gravimeters and gyroscopes[ Reference Geiger, Landragin, Merlet and Santos 3 ]. Beyond traditional quantum metrology, high-power pulsed 780 nm lasers have recently demonstrated significant potential in emerging fields including biomedical photonics[ Reference Qi, Yao, Du, Zhang, Zhou, Fu, Li, Mi, Chen, Wang, Luo, He, Nan, Zhang, Sun, Xia, Cai, Du, Xie, Chen and Yang 4 ] and light detection and ranging (LiDAR)[ Reference Kutscher, Stock, Sommer, Jurkevicius, Meyer, Wiggert, Lamminger and Karpf 5 ]. Specifically, for quantum-control applications, MHz-level nanosecond pulsed 780 nm sources have been demonstrated as an effective approach for coherent rubidium atom manipulation, including the observation of Rabi oscillations in a single 87Rb atom[ Reference Dingjan, Darquié, Beugnon, Jones, Bergamini, Messin, Browaeys and Grangier 6 ]. Compared with ultrashort-pulse sources, nanosecond single-frequency pulses provide temporal control while avoiding excessive spectral broadening, making them suitable for applications requiring both pulsed operation and high spectral purity. For precision atom-interferometric applications, laser frequency noise, pulse timing jitter and related phase-noise contributions should also be carefully considered, as they may affect measurement sensitivity[ Reference Graham, Hogan, Kasevich and Rajendran 7 ]. In addition, higher average power can be beneficial for maintaining sufficient optical intensity in configurations involving expanded beam sizes, optical delivery losses or multi-pulse operation. Therefore, the development of high-power, narrow-linewidth, MHz-level nanosecond pulsed 780 nm sources is of great significance for extending rubidium-related applications that require both high spectral purity and high average optical power.
Currently, the dominant technology for generating high-power 780 nm radiation is frequency doubling of 1560 nm fiber lasers. Although traditional solutions based on Ti:sapphire lasers can support atom interferometry[ Reference McGuirk, Snadden and Kasevich 8 ], their complex free-space optics and substantial footprint limit system mobility. To overcome these constraints, architectures based on frequency-doubled 1560 nm fiber lasers have been proposed and proven to offer superior compactness[ Reference Lienhart, Boussen, Carraz, Zahzam, Bidel and Bresson 9 ]. Combining this fiber-integrated approach with a simple single-pass frequency-doubling scheme, Dong et al. [ Reference Dong, Zeng, Cui, Zhou and Feng 10 ] achieved 21.2 W of continuous-wave output at 780 nm, demonstrating both high power and structural simplicity. Regarding the choice of nonlinear crystals, periodically poled lithium niobate (PPLN) is widely adopted due to its high effective nonlinear coefficient[ Reference Hu, Murray, Legg, Runcorn, Zhang, Woodward, Lim, Wang, Luan, Gu, Shum, Kelleher, Popov and Taylor 11 ]. Recently, Si et al. [ Reference Si, Song, Hou, Zhao, Zhang and Wang 12 ] achieved 0.46 W femtosecond output using an all-polarization-maintaining (PM) fiber architecture, and Luo et al. [ Reference Luo, Wen, Wang, Li, Zhu, Yang, Wu, Xiu, Fan, Liu, Wei and Yang 13 ] further scaled the average power to 2.22 W with a fully engineered integrated system. However, limited by the low photorefractive damage threshold and severe thermal lensing of lithium niobate, PPLN-based systems face a severe physical bottleneck in power scaling. Existing pulsed PPLN sources are typically confined to the watt level and often suffer from beam quality degradation at higher powers[ Reference Jiang, Chen, Yin, Forsberg and He 14 ], falling short of the more than 10 W requirement.
Lithium triborate (LBO) crystals offer an ideal alternative for pulsed 780 nm laser power scaling, due to their high damage thresholds and thermal stability. Although the effective nonlinear coefficient of LBO is significantly lower than that of PPLN, high-power second-harmonic generation (SHG) can still be achieved using a fundamental source with high peak power. It has demonstrated exceptional performance in high-power visible applications[ Reference Konno, Kojima, Fujikawa and Yasui 15 – Reference Ahmadi, Creeden, Aschaffenburg, Mokan, Underwood, Caprara, Shu, Spinelli, Minelly and Nikolov 17 ]. Therefore, realizing high-power LBO frequency doubling at 780 nm requires a 1560 nm fundamental source with high average power and controlled linewidth. However, its power scaling is constrained by stimulated Brillouin scattering (SBS)[ Reference Dawson, Messerly, Beach, Shverdin, Stappaerts, Sridharan, Pax, Heebner, Siders and Barty 18 ], leaving most narrow-linewidth sources insufficient to drive LBO efficiently. Accordingly, reported applications of LBO for high-power pulsed 780 nm generation remain rare. To the best of our knowledge, the only notable demonstration of nanosecond 780 nm pulsed generation using LBO was reported by Lee et al. [ Reference Lee, Geng, Qiang, Pan, Jiang, Anderson, Mu and Beck 19 ]. However, that work focused on low-repetition-rate (kHz) rubidium dating, limiting the average power to approximately 1.6 W. Consequently, there is still a lack of viable 780 nm laser sources capable of high-repetition-rate (MHz) and high-average-power (>10 W) operation.
In this work, we demonstrate a high-power, high-repetition-rate 780 nm nanosecond pulsed laser system based on single-pass LBO frequency doubling. By developing an SBS-suppressed 1560 nm all-fiber master oscillator power amplifier (MOPA), we achieved an average output power of 17.2 W at 780 nm with a repetition rate of 10 MHz and a pulse width of 2 ns. By investigating the performance at a lower repetition rate of 5 MHz, we identify the key nonlinear constraints that limit conversion efficiency, providing insights into the challenges for future power scaling at low repetition rates.
2 Experimental setup
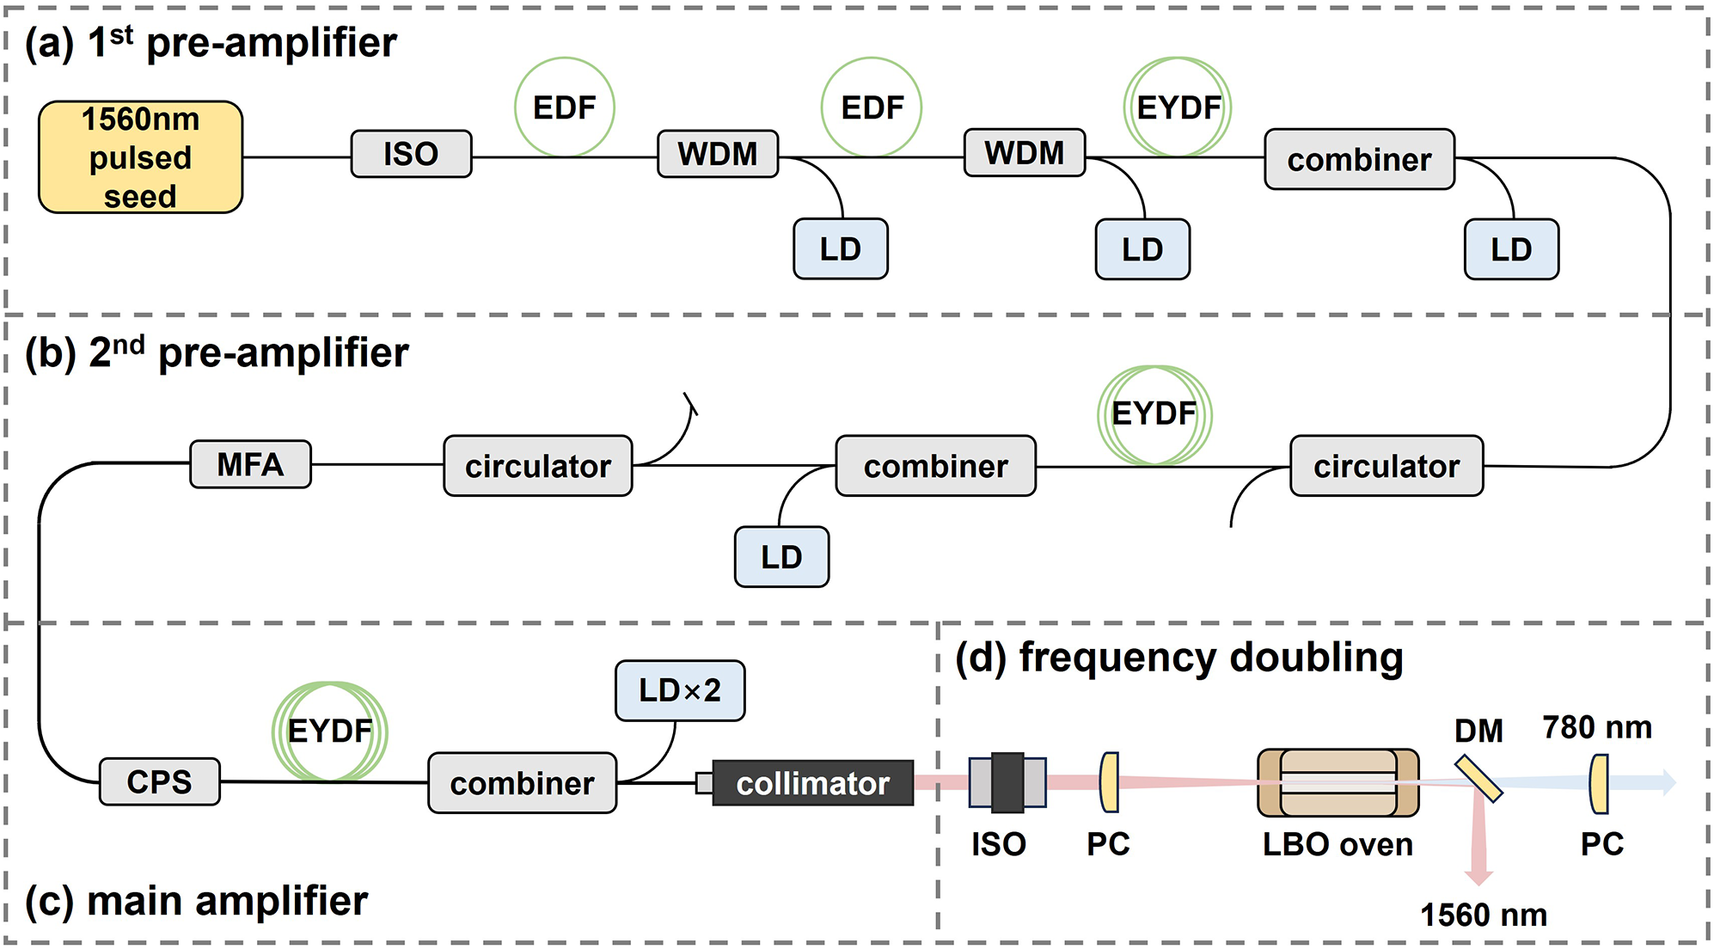
The schematic diagram of the high-power 780 nm nanosecond pulse laser system, which consists of a pulsed fiber laser system and a frequency-doubling unit, is shown in Figure 1. The pulsed, all-fiber, PM MOPA system, which consists of a seed laser, two-stage pre-amplifiers and a main amplifier, was used to generate the fundamental laser at 1560 nm. The seed laser is a fiber-pigtailed distributed feedback (DFB) diode laser at 1560 nm with tunable repetition rate (kHz–MHz) and pulse duration (1–10 ns). Besides, the thermally controlled unit allows for precise wavelength tuning of the seed laser around 1560 nm. In the experiment, the seed laser was operated with a pulse duration of 2 ns and a repetition rate of 10 MHz, yielding an average power of 2.2 mW.
Schematic diagram of the high-power 780 nm nanosecond pulsed laser system, consisting of (a) the first pre-amplifier stage, (b) the second pre-amplifier stage, (c) the main amplifier stage and (d) the frequency-doubling module. ISO, free-space optical isolator; EDF, Er-doped fiber; WDM, wavelength division multiplexer; LD, laser diode; EYDF, Er/Yb co-doped fiber; MFA, mode field adaptor; CPS, cladding power stripper; PC, plano-convex lens; DM, dichroic mirror.

Figure 1 Long description
The diagram is divided into four dashed sections.
Panel a, the first pre-amplifier stage, begins at the top left with a 1560 nanometer pulsed seed. The signal moves right through an ISO, an EDF coil, and a WDM connected to an LD. This sequence repeats with another EDF and WDM with LD, followed by an EYDF coil, a combiner with an LD, and then curves down to the next stage.
Panel b, the second pre-amplifier stage, continues the path from left to right through an MFA, a circulator, and a combiner connected to an LD. It then passes through an EYDF coil and another circulator before curving down.
Panel c, the main amplifier stage, starts at the bottom left with a CPS, followed by an EYDF coil and a combiner connected to two LD units. The signal enters a collimator which transitions the fiber-coupled signal into a free-space beam.
Panel d, the frequency-doubling module, shows the free-space beam passing through an ISO, a PC lens, and an LBO oven. ADM then splits the beam, reflecting a 1560 nanometer component downward while the 780 nanometer output passes through a final P C lens to the right.
The seed laser is first fed into the first pre-amplifier stage (Figure 1(a)), which consists of a two-stage Er-doped fiber (EDF) amplifier and an Er/Yb co-doped fiber (EYDF) amplifier. The EDF stages were counter-pumped by 976 nm laser diodes (LDs) through the 980/1550 PM wavelength division multiplexers. The gain fiber length of these EDFs is about 50 cm. The EYDF amplifier is also counter-pumped by a 976 nm LD via a PM (2 + 1) × 1 signal/pump combiner. Its gain fiber is a 1.2 m long PM-EYDF with core/inner-cladding diameters of 10/125 μm. This length provides sufficient gain under 976 nm pumping while suppressing amplified spontaneous emission (ASE) and nonlinear effects, thereby maintaining good spectral quality of the signal. The second pre-amplifier stage (Figure 1(b)) is also an EYDF amplifier, in which the 3.4 m EYDF was counter-pumped by a 915 nm LD through a PM (2 + 1) × 1 signal/pump combiner, where the 915 nm wavelength provides relatively strong pump absorption in the EYDF, enabling efficient gain within a moderate fiber length. Between the two-stage pre-amplifiers, a circulator is employed to prevent residual pump back to the first amplification stage. Another circulator is placed after the second pre-amplifier to monitor backward light from the main amplifier.
In order to suppress the SBS, the main amplifier (Figure 1(c)) employs a large mode area fiber with a core/cladding diameter of 25/300 μm. A mode field adaptor (MFA) is inserted between the second pre-amplifier and the main amplifier for mode matching. The main amplifier is also counter-pumped by two 150 W LDs at 940 nm via a (6 + 1) ×1 pump combiner. The 940 nm pump wavelength is adopted as a non-peak pumping scheme to avoid excessive Yb inversion associated with 976 nm peak pumping, thereby suppressing ASE and parasitic lasing around 1 μm during high-power operation. The gain fiber is a 4 m long EYDF with a core absorption coefficient of 3.1 dB/m at 915 nm. A cladding power stripper is incorporated to remove the residual pump laser. Finally, the frequency-doubling module (Figure 1(d)) processes the amplified signal. The amplified 1560 nm laser is collimated to a beam diameter of 3.47 mm and passes through a free-space optical isolator. It is then focused by a plano-convex lens into a 2 mm × 2 mm × 60 mm non-critical phase-matching (NCPM) LBO crystal. The crystal is housed in a copper oven with a temperature control precision of ±0.01°C. Finally, the generated 780 nm laser is separated from the 1560 nm fundamental laser by a short-pass dichroic mirror and collimated by another plano-convex lens.
3 Results and discussion
3.1 Performance of the fundamental laser
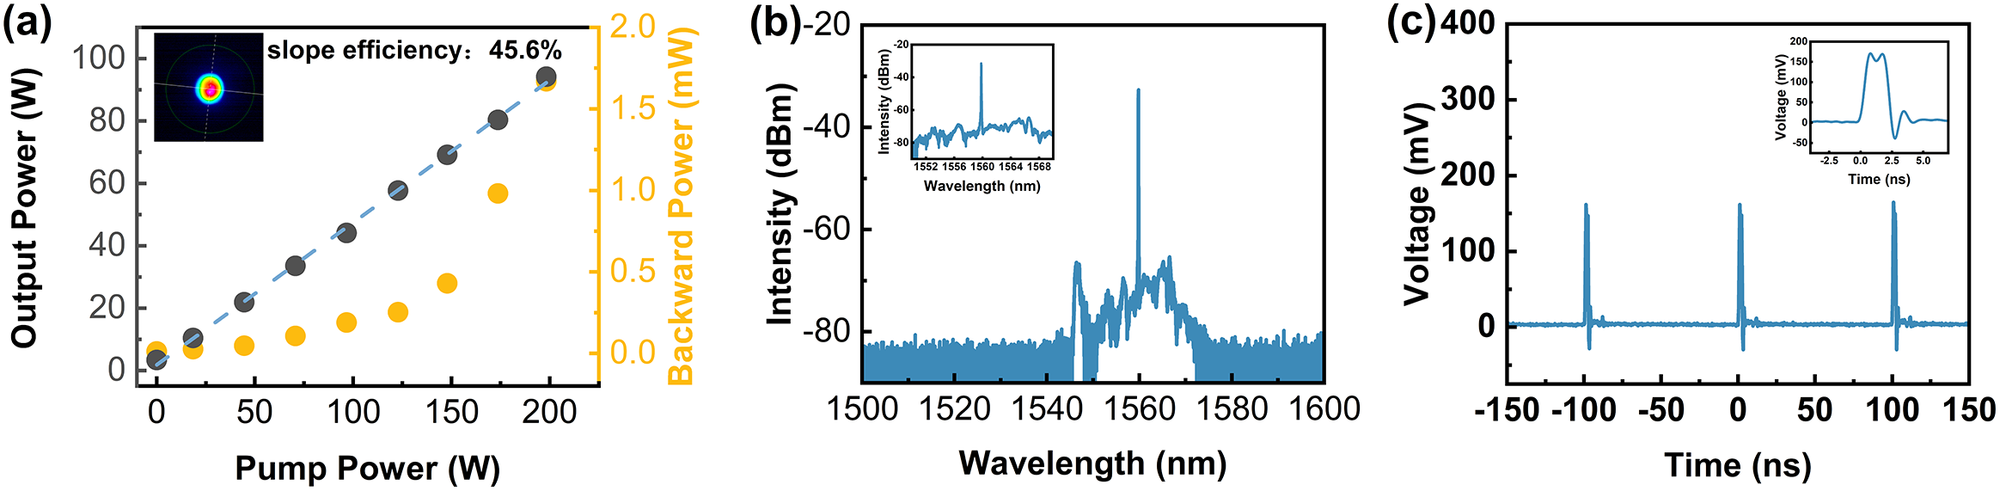
The fundamental laser is important for pulsed 780 nm laser generation. For the 10 MHz operation, the first and second pre-amplifiers delivered average powers of 257 mW and 5.6 W, respectively. The performance of the pulsed 1560 nm laser after the main amplifier was characterized first, with the results shown in Figure 2. The average output power of the pulsed 1560 nm laser as a function of the pump power is illustrated in Figure 2(a). The output power increased linearly with the pump power without exhibiting any saturation effects. A maximum average output power of 94.2 W was achieved, corresponding to a slope efficiency of 45.6%. The corresponding backward power is also presented in Figure 2(a), showing a nonlinear increase with pump power due to the gradual build-up of ASE, while remaining at a low level throughout the measurement range, with a maximum value of approximately 1.67 mW at the highest output power. As shown in the inset of Figure 2(a), the output beam profile maintained a good Gaussian-like distribution even at the highest output power, indicating stable modal operation and effective thermal management. The spectral and temporal characteristics of the amplified 1560 nm pulses at the maximum output power are summarized in Figures 2(b) and 2(c). Figure 2(b) presents the optical spectrum centered at 1559.81 nm. The signal-to-noise ratio (SNR) was measured to be 32.7 dB, showing effective suppression of the ASE. The inset of Figure 2(b) displays the fine spectrum over a 20 nm span, further confirming the high spectral purity, which is critical for the subsequent frequency-doubling efficiency. The optical spectrum of the laser was characterized by an optical spectrum analyzer (OSA) with a specified resolution of 0.02 nm. The measured 3 dB bandwidth was instrument-limited, as the actual linewidth is below the resolution limit of the OSA. Figure 2(c) shows the temporal pulse waveform captured by a photodetector (PD, Thorlabs DET01CFC/M) via diffuse reflection and recorded by a digital oscilloscope (Tektronix MSO44). Figure 2(c) displays the temporal pulse train at a repetition rate of 10.0 MHz, with the inset showing the individual pulse waveform. The pulse width at full width at half maximum (FWHM) was measured to be 2.05 ns.
Performance of the 1560 nm main amplifier at a repetition rate of 10.0 MHz. (a) Average output power of the 1560 nm laser as a function of pump power. The inset shows the measured beam profile of the 1560 nm laser. (b) Optical spectrum at the maximum output power of 1560 nm. The inset displays the fine spectral structure with a span of 20 nm. (c) Temporal pulse train of the 1560 nm output; inset, individual pulse shape.

Figure 2 Long description
Panel a is a line graph with a primary y-axis for Output Power in Watts and a secondary y-axis for Backward Power in milliwatts, both plotted against Pump Power in Watts from 0 to 200. The output power shows a linear increase with a slope efficiency of 45.6 percent, reaching nearly 100 Watts. The backward power shows a non-linear increase, remaining below 2.0 milliwatts. An inset shows a circular, Gaussian-like beam profile with a bright red core. Panel b is a spectral plot of Intensity in d B m versus Wavelength in nanometers from 1500 to 1600. A sharp peak is centered at 1560 nanometers. The inset provides a high-resolution view from 1552 to 1568 nanometers, highlighting the narrow linewidth of the central peak. Panel c is a temporal plot of Voltage in millivolts versus Time in nanoseconds from minus 150 to 150. It shows three distinct, narrow pulses spaced 100 nanoseconds apart, corresponding to a 10.0 M H z repetition rate. The inset shows a single pulse with a duration of approximately 2.5 nanoseconds and a slight ringing effect on the trailing edge.
3.2 SHG performance
The amplified 1560 nm pulses were utilized for single-pass SHG in an LBO crystal. Although the MOPA system can deliver a maximum total power of 94.2 W, the frequency-doubling process was performed at a more stable operating point. This choice was made to ensure the reproducibility of the experiment and to protect the fiber from damage at high peak powers, while still achieving high conversion efficiency. At this point, the effective linearly polarized fundamental power was 68.7 W. A plano-convex lens with a focal length of 100 mm was employed to focus the fundamental laser into the crystal, ensuring the optimum focusing condition of ξ = 2.84. The temperature of the NCPM LBO crystal was precisely maintained at 129.20°C.
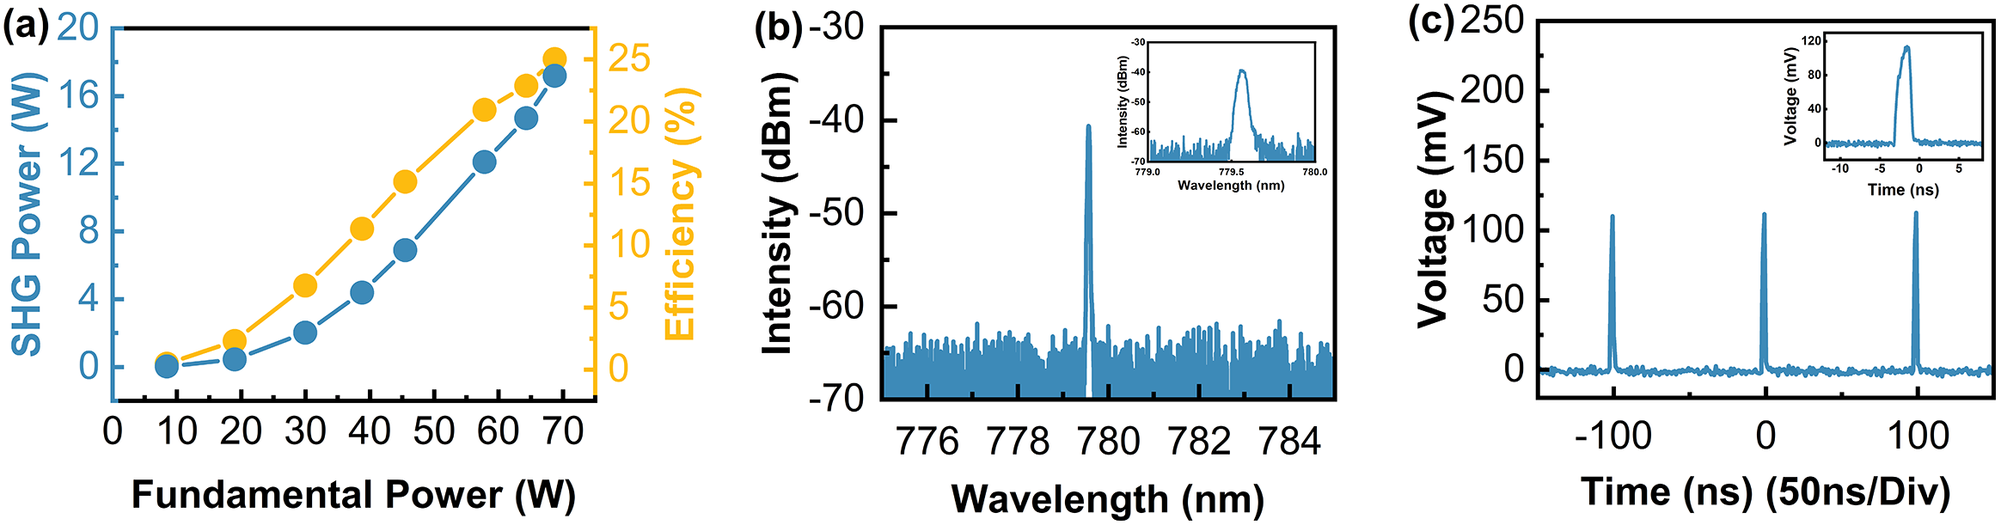
The performance of the pulsed 780 nm laser during the SHG process is summarized in Figure 3. The SHG power and the corresponding conversion efficiency as a function of the incident fundamental power are shown in Figure 3(a). A maximum average output power of 17.2 W at 780 nm was obtained, corresponding to the conversion efficiency of 25.03% at the highest fundamental power level. The SHG power increased quadratically with the fundamental power, which is consistent with the theoretical prediction for nonlinear frequency conversion. The spectral characteristics of the generated 780 nm pulses are shown in Figure 3(b). The spectrum is centered at 779.56 nm with a clean profile free from significant ASE or nonlinear spectral broadening. The inset of Figure 3(b) displays the fine spectrum over a 5 nm span, confirming the preservation of the narrow linewidth from the fundamental seed. Figure 3(c) depicts the temporal pulse train of the 780 nm laser, with the inset showing the individual pulse shape (PD, Thorlabs DET0255A/M). The pulse duration was measured to be approximately 1.85 ns (digital oscilloscope, Rigol DS70504).
SHG performance at a repetition rate of 10 MHz. (a) Average output power of the 780 nm second harmonic (blue line) and the corresponding conversion efficiency (yellow line) as a function of the fundamental power. (b) Optical spectrum of the generated 780 nm laser. The inset shows the spectrum in a narrower span. (c) Temporal pulse train of the 780 nm output; inset, individual pulse shape.

Figure 3 Long description
Panel a is a dual-axis line graph. The x-axis is Fundamental Power in Watts from 0 to 70. The left y-axis is S H G Power in Watts from 0 to 20, represented by a blue line with circular markers showing a nonlinear upward trend reaching approximately 17 Watts. The right y-axis is Efficiency in percent from 0 to 25, represented by a yellow line with circular markers showing a similar upward trend reaching approximately 24 percent.
Panel b is an optical spectrum. The x-axis is Wavelength in nanometers from 775 to 785. The y-axis is Intensity in d B m from minus 70 to minus 30. A sharp blue peak is centered at approximately 779.5 nanometers. An inset shows a zoomed-in view of this peak from 779.0 to 780.0 nanometers.
Panel c is a temporal pulse train. The x-axis is Time in nanoseconds from minus 150 to 150 with a scale of 50 nanoseconds per division. The y-axis is Voltage in m V from 0 to 250. Three sharp vertical pulses appear at minus 100, 0, and 100 nanoseconds. An inset shows the shape of a single pulse with an x-axis from minus 10 to 5 nanoseconds and a y-axis from 0 to 120 m V.
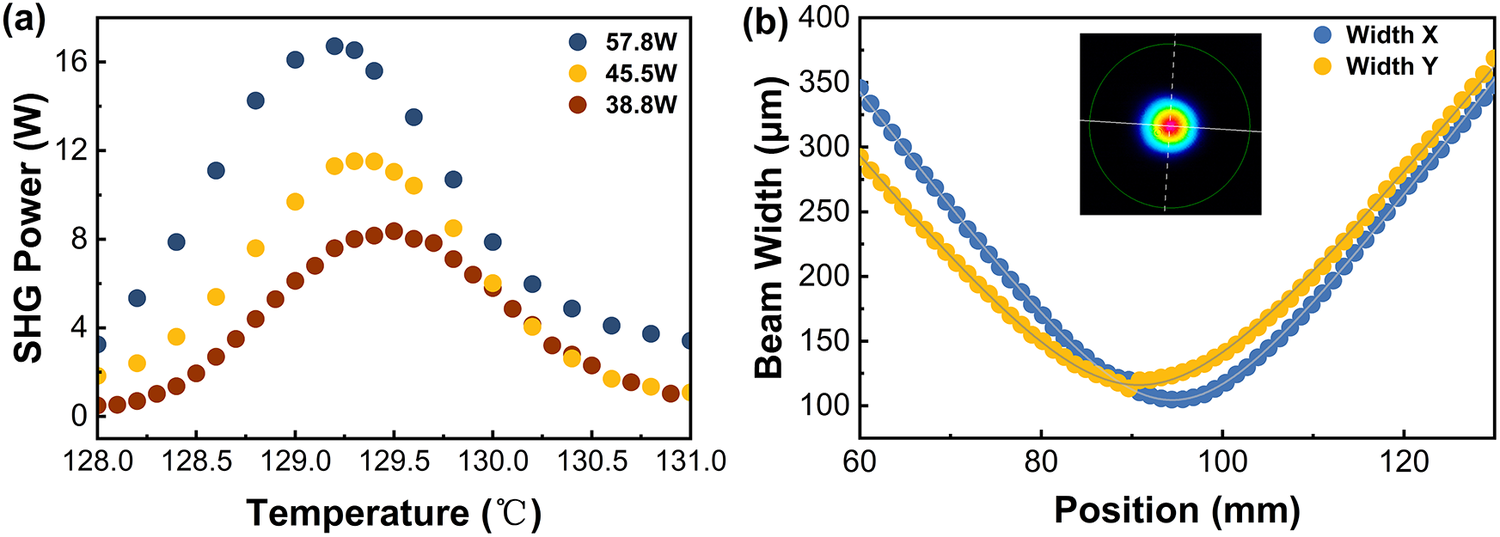
The temperature tuning characteristics of the LBO crystal were measured at the fundamental power levels of 38.8, 45.5 and 57.8 W, as shown in Figure 4(a). The experimental results show that the optimal phase-matching temperature shifted towards the lower temperature side as the pump power increased. A temperature shift of approximately 0.3°C was observed when the pump current increased from 38.8 to 57.8 W. Furthermore, the temperature acceptance bandwidth (FWHM) was measured to be approximately 1.5°C at the highest output power level. Figure 4(b) displays the beam quality measurement and the corresponding beam profile of the generated 780 nm laser. The beam quality factor (M 2) was calculated to be 1.06. This value indicates that the output laser is near-diffraction-limited, demonstrating excellent beam quality maintained during the high-power SHG process.
Thermal characterization and beam quality of the SHG output. (a) Temperature tuning curves of the LBO crystal measured at pump powers of 38.8, 45.5 and 57.8 W, respectively. The optimal phase-matching temperature shifts towards lower temperatures as the pump power increases due to thermal absorption. (b) Beam quality measurement of the 780 nm laser. The solid lines represent the hyperbolic fits to the measured beam widths (width X and width Y). The inset displays the far-field beam profile.

Figure 4 Long description
Panel a is a scatter plot showing S H G Power in Watts on the y-axis from 0 to 16 and Temperature in degrees Celsius on the x-axis from 128.0 to 131.0. Three bell-shaped tuning curves are shown. The highest curve, blue dots for 57.8 W pump power, peaks at approximately 16.8 W near 129.2 degrees. The middle curve, yellow dots for 45.5 W, peaks at 11.5 W near 129.4 degrees. The lowest curve, brown dots for 38.8 W, peaks at 8.2 W near 129.5 degrees.
Panel b is a line graph showing Beam Width in micrometers on the y-axis from 100 to 400 and Position in millimeters on the x-axis from 60 to 130. Two hyperbolic curves represent Width X in blue and Width Y in yellow. Both curves descend to a focal waist near 95 millimeters before ascending. Width X reaches a minimum of approximately 105 micrometers, while Width Y reaches a minimum of approximately 120 micrometers. An inset at the top center shows a circular far-field beam profile with a bright red-white core surrounded by concentric cyan and blue rings.
3.3 Performance analysis and optimization at 5 MHz
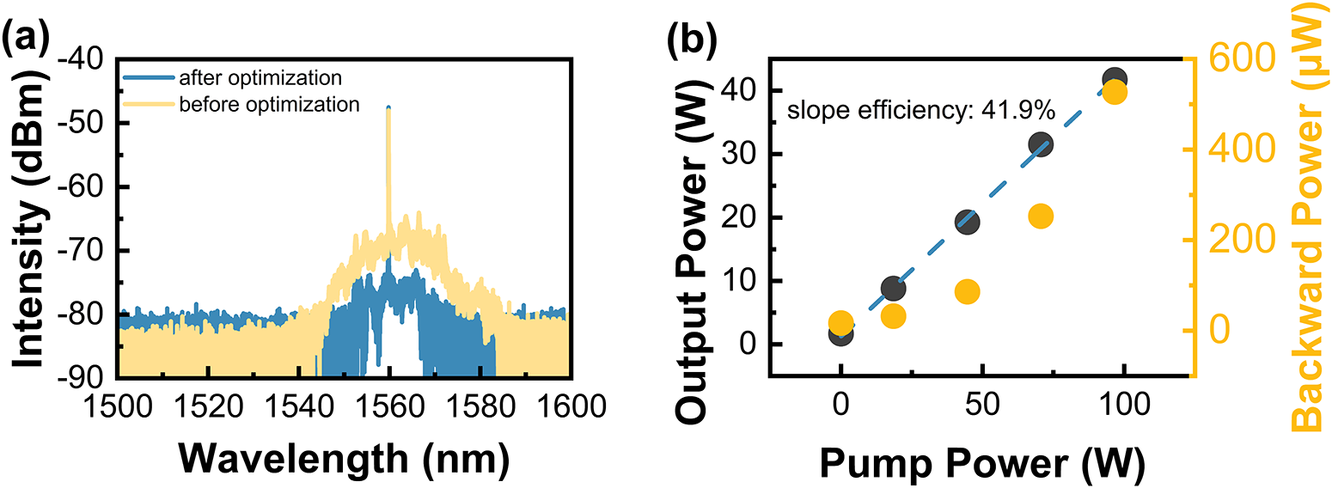
To investigate the performance of the MOPA system under high-peak-power conditions, the repetition rate was tuned to 5 MHz. During the initial characterization, the main amplifier output exhibited a low SNR of approximately 16 dB at the maximum pump power, as shown in Figure 5(a). This poor spectral quality, characterized by a high ASE floor, severely limited the frequency-doubling efficiency, resulting in a maximum SHG output of only 3.04 W with a conversion efficiency of 10.08%. To address this issue, an optimization strategy was implemented by reducing the pump power of the pre-amplifier stages to improve the seed signal quality. The optical spectra of the main amplifier output at the maximum pump power, before and after optimization, are compared in Figure 5(a). After optimization, the ASE floor was significantly suppressed in the main amplifier, exhibiting an SNR of 25.5 dB. With this high-quality fundamental laser, the main amplifier achieved a maximum output power of 41.7 W with a slope efficiency of 41.9%, as shown in Figure 5(b). The slightly reduced slope efficiency at 5 MHz is mainly attributed to the lower signal power delivered by the pre-amplifier stages and the increased ASE contribution resulting from the optimized pre-amplifier operation.
Performance comparison and output characteristics of the fundamental laser at a 5 MHz repetition rate. (a) Optical spectra of the main amplifier output before (yellow line) and after (blue line) optimization. (b) Average output power and backward power of the optimized main amplifier as a function of pump power.

Figure 5 Long description
The figure consists of four panels arranged in a two-by-two grid.
* Panel a (top-left): A line graph with Time in minutes on the x-axis (0 to 60) and Power in Watts on the y-axis (26 to 38). A blue line labeled 1560 n m shows a stable power output fluctuating slightly around 34 Watts. A thin red horizontal reference line is visible.
* Panel b (top-right): A line graph with Time in minutes on the x-axis and Detrended Power in Watts on the y-axis (-0.4 to 0.4). The blue line for 1560 n m shows high-frequency noise centered around 0.0 Watts after an initial rise from -0.4 Watts.
* Panel c (bottom-left): A line graph with Time in minutes on the x-axis and Power in Watts on the y-axis (0 to 12). A yellow line labeled 780 n m shows a gradual linear decrease in power from approximately 10 Watts at 0 minutes to 8 Watts at 60 minutes. A thin red linear fit line follows this downward trend.
* Panel d (bottom-right): A line graph with Time in minutes on the x-axis and Detrended Power in Watts on the y-axis (-0.2 to 0.2). The yellow line for 780 n m shows noise fluctuations around the 0.0 Watt baseline after an initial rise from -0.2 Watts.
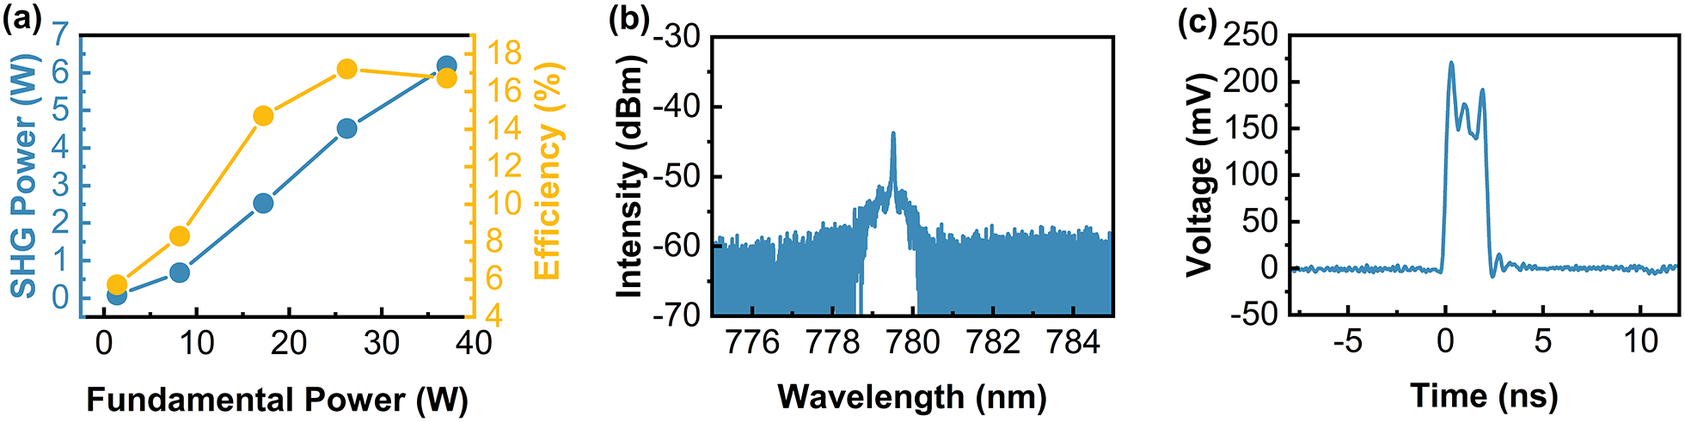
Following the optimization of the fundamental laser, the SHG performance was re-evaluated. The SHG power and conversion efficiency as a function of the fundamental power are shown in Figure 6(a). The maximum SHG power increased to 6.19 W at a fundamental power of 37.03 W, corresponding to a peak conversion efficiency of 17.2%. This represents a significant improvement of approximately 76% compared to the initial state of 10.08%, validating the importance of spectral purity in the MOPA system.
SHG performance at 5 MHz. (a) SHG output power (blue spheres) and conversion efficiency (yellow spheres) as a function of the fundamental power. (b) Optical spectrum of the 780 nm laser at the maximum pump power of 37.03 W. (c) Temporal pulse profile at the maximum output power. Note the distinct pulse splitting and spectral broadening compared to the 10 MHz case, indicating the onset of significant nonlinear effects that limit the conversion efficiency.

Figure 6 Long description
Panel a is a line graph of Intensity in d B m versus Wavelength in n m ranging from 1500 to 1600. A yellow line labeled before optimization shows a broad spectral pedestal centered at 1560 n m with a peak intensity near minus 48 d B m. A blue line labeled after optimization shows a significantly suppressed pedestal with a similar peak intensity. Panel b is a dual-axis scatter plot of Output Power in W and Backward Power in micro W versus Pump Power in W from 0 to 100. Dark grey spheres representing output power follow a linear increase with a dashed blue trend line labeled slope efficiency 41.9 percent. Yellow spheres representing backward power show a non-linear upward trend, increasing more sharply as pump power exceeds 50 W.
However, despite the optimization, the conversion efficiency at 5 MHz remained lower than that of 10 MHz. As shown in Figure 6(b), the generated 780 nm output exhibits degraded spectral purity with a noticeable background of ASE components. Furthermore, the temporal pulse splitting observed in Figure 6(c) originates from the quality of the 1560 nm fundamental laser, which is inherited and further exacerbated during the nonlinear frequency-doubling process. This comparison demonstrates that the 5 MHz operation provides higher peak power, while the 10 MHz repetition rate offers a more balanced regime for generating high-average-power SHG outputs by mitigating these detrimental nonlinear effects. To enhance the low-repetition performance, future work will focus on optimizing the pre-amplifier stages to maintain high optical SNR and superior spectral purity before the main amplification. In addition, incorporating narrowband optical filters between stages could better achieve these requirements. Such an approach, although not employed here due to experimental constraints, is expected to yield a higher-quality fundamental beam, thereby improving frequency-doubling efficiency and stability at lower repetition rates.
4 Conclusion
In summary, we have demonstrated a robust high-power 780 nm pulsed laser source based on single-pass frequency doubling of a 1560 nm fiber laser. The maximum average power of 94.2 W was obtained at 1560 nm with a slope efficiency of 45.6%. By employing a temperature-stabilized LBO crystal, we achieved 17.2 W of 780 nm output at a repetition rate of 10 MHz, corresponding to a conversion efficiency of 25.03% and the beam quality of M 2 ≈ 1.06. Investigations at a lower repetition rate of 5 MHz revealed that despite spectral optimization, the conversion efficiency was ultimately limited by nonlinear temporal pulse splitting and spectral broadening. Consequently, the 10 MHz operation offers the optimal balance for scaling average power while preserving beam integrity. This compact, high-efficiency source holds significant potential for large momentum transfer atom interferometry and long-range LiDAR applications.
Acknowledgements
The work was supported by the National Natural Science Foundation of China (Grant Nos. U2541226, 12341404, 12473080 and U25A20509) and the National Key Research and Development Program of China (Grant No. 2024YFB3613800).

 Open access

