

Introduction
Openness to unfamiliar experiences is a basic concept for the understanding of human behaviour. For example, ‘openness to experience’ is one of the five dimensions found in the ‘big five theory of personality’ by Costa and McCrae (Reference COSTA and MCCRAE1992). Since the beginnings of the study of musical taste (Downey, Reference DOWNEY1897; Gilman, Reference GILMAN1891), the development of aesthetic reactions to music has been of interest to researchers in the field of musical development. From a developmental perspective, the possibility of ‘critical time windows’, which are characterised by an increased susceptibility towards and tolerance of new aesthetic experiences, is also important for music education. Insight into the development of aesthetic responses could help teachers decide how and when to bring pupils into contact with unfamiliar music.
Previous research in the development of musical taste has provided evidence for the existence of critical time windows and age-related changes in attitudes towards different musical styles (for an overview see Gembris, Reference GEMBRIS, Stoffer and Oerter2005; Hargreaves et al., Reference HARGREAVES, NORTH, TARRANT and McPherson2006; Kloppenburg, Reference KLOPPENBURG, de la Motte-Haber and Rötter2005). In general, the musical preferences of elementary school children younger than 10 years of age are less stable than those of teenagers (Gembris, Reference GEMBRIS, Colwell and Richardson2002: 496). Greer et al. (Reference GREER, DOROW, WACHHAUS and WHITE1973, Reference GREER, DOROW and RANDALL1974), initiated the investigations into the listening preferences of school children. The authors found strong preferences for rock music in upper elementary (2nd grade and higher), middle school, and junior high age groups. LeBlanc (Reference LEBLANC1979) conducted a study to investigate the music preferences of 278 fifth grade students (age: 10–11 years) by means of a sound questionnaire with examples from six musical styles, and LeBlanc and Cote (Reference LEBLANC and COTE1983) observed a partiality for fast traditional jazz examples (mean tempo = 211 bpm) in fifth and sixth grade students. In a survey study, Hargreaves et al. (Reference HARGREAVES, COMBER and COLLEY1995) found a significant age-related decline in liking for most of the 12 musical style categories in 11–12 and 15–16-year-old secondary school students. Girls expressed a significantly lower level of dislike for ‘serious’ styles than did boys. Some support for the age-related openness to unconventional musical styles was found in the extensive study by LeBlanc et al. (Reference LEBLANC, SIMS, SIIVOLA and OBERT1996): the music preferences of 2,262 listeners from grade 1 up to adults with an age range of 6–91 years of age were measured by means of a sound questionnaire containing 18 examples from classical music, traditional jazz and rock music. The authors found a decline in preference for art music, jazz and rock from grade 1 to 6, followed by an increase up to the high school years. Surprisingly, the preference for art music increased in grades 5 and 13. However, rock was the favourite musical style overall followed by art music and jazz.
The assumption that there is a critical time window characterised by an increased sensitivity to outside influences on musical taste is supported by various studies. For example, Hargreaves (Reference HARGREAVES1987) found age-related changes in liking for unfamiliar melodies with a significant decrease from age 4–5 to age 6–7. In a later study Hargreaves (Reference HARGREAVES1995) investigated the effects of age, gender and musical training on preference ratings for 12 musical style categories in 11–12 and 15–16-year-old school pupils finding a general decline in the enjoyment of music between the two age groups, particularly apparent in forms of art music. He also observed a gender-related effect: Girls appreciated a wider range of styles than did boys, especially in art music. In a longitudinal study of the development of musical preferences and listening habits during the years of adolescence (11–17 years of age), Behne (Reference BEHNE, Deliège and Sloboda1997a) found that listening styles (e.g. ‘compensating’, ‘concentrated’ and ‘emotional’ attitudes in music listening) change with age. As Behne (Reference BEHNE, Motte-Haber and Neuhoff2007) summarised in a survey study, age is the most important predictor for musical preference.
The open-earedness hypothesis
In the early 1980s, Hargreaves (Reference HARGREAVES1982a, Reference HARGREAVES1982b) began a series of studies on aesthetic reactions to music in different groups of children from 7 to 15 years of age. The author assumed that there are significant age-related changes in the usage of specific response categories and coined the term open-earedness hypothesis: ‘. . . younger children may be more ‘open-eared’ to forms of music regarded by adults as unconventional; their responses may show less evidence of acculturation to normative standards of ‘good taste’ than those of older subjects’ (Hargreaves, Reference HARGREAVES1982b: 51). In psychological terms, it is assumed that age (younger vs older) and musical style (familiar vs unfamiliar) are the independent variables, and the observed aesthetic response is the dependent variable. In his studies, the author found significant age-related effects in responses to a sound questionnaire that were characterised by an increased sensitivity to stylistic categories of music, such as the labelling of music as ‘pop’, ‘folk’ or ‘jazz’. Although the author (Hargreaves, Reference HARGREAVES1982b) did not directly ask for ‘liking’, he concluded that the less frequent categorisation indicates the existence of an aesthetic openness in 7–8-year-olds. In the 1990s, the concept of open-earedness was used by LeBlanc (Reference LEBLANC1991) to suggest that (a) younger children are more open-eared, (b) open-earedness declines as the child enters adolescence, (c) open-earedness redevelops as the listener matures from adolescence to young adulthood and (d) open-earedness declines as the listener matures into old age (see also LeBlanc et al., Reference LEBLANC, SIMS, SIIVOLA and OBERT1996). A recently published survey of studies on age-dependent changes in musical taste by Hargreaves et al. (Reference HARGREAVES, NORTH, TARRANT and McPherson2006) gives general support for LeBlanc's generalisations. Due to the educational ramifications of the general question as to how musical preferences can be modified (Finnas, Reference FINNÄ1989), the open-earedness hypothesis remains significant.
However, we have to bear in mind that some of the previous studies show a lack of empirical evidence for the existence of an open-earedness effect. For example, LeBlanc et al. (Reference LEBLANC, SIMS, SIIVOLA and OBERT1996) observed a decrease in liking for art music, jazz and rock music from grades 1 to 6, but the authors did not differentiate between familiar and unfamiliar musical styles in their data analysis. Thus, no conclusions on open-earedness in the sense of Hargreaves’ hypothesis can be drawn from their data. The first empirical evidence for an open-earedness effect was found in an explorative study by Gembris and Schellberg (Reference GEMBRIS, SCHELLBERG, Kopiez, Lehmann, Wolther and Wolf2003). The authors investigated preference judgements of elementary school children for music of four different styles (classical, ethnic, avant-garde, pop), but authors did not use the terms ‘conventional’ and ‘unconventional’ music. A sound questionnaire and an iconographic rating scale (smiley scale) were used for the measurement of preference. Classical, avant-garde and ethnic music were classified as ‘unconventional’ and popular music as ‘conventional’. Authors found an increase in disliking for classical (unconventional) music from grade 1 to 4 (7–10 years) and a constant level of liking for conventional (popular) music. The ratings for avant-garde and ethnic music remained constant from grades 1 to 3 (in the scale vicinity of ‘liking’) and moved to the direction of disliking in grade 4. However, the authors used non-parametric statistical methods for data analysis with statistical tests of preference differences for each musical example. These comparisons between experimental conditions do not permit drawing conclusions on the interaction between different age levels only.
Finally, the question of how to measure aesthetic reactions to music remains open. Like Abeles and Chung (Reference ABELES, CHUNG and Hodges1996: 326), we also differentiate between preference and taste responses to music. Abeles and Chung proposed that preference is characterised by a short-term commitment, whereas taste is a relatively stable evaluation behaviour. Due to the young age of our sample subjects, our study is concerned with music preference and the respective aesthetic reactions. The measurement of aesthetic reactions follows the definition of Scherer (Reference SCHERER2005: 703): Aesthetic reactions are operationalised as ‘evaluative judgements in the sense of liking or disliking [. . .], produced by encountering attractive or aversive stimuli’.
Objectives of the study
The aims of this study are three-fold: First, we try to answer the question as to whether or not there is foundational data for the assumption of open-earedness in elementary school children by transforming Hargreaves’ theoretical open-earedness hypothesis into empirical hypotheses; second, we compare our results with those of Gembris and Schellberg (Reference HARGREAVES, MARSHALL and NORTH2003); third, we address methodological proposals for future investigations. Finally, we would like to make a theoretical contribution to the concept of open-earedness.
Method
Experimental design and hypothesis
We wished to establish a relationship between the variables age, musical style and open-earedness. The open-earedness hypothesis does not mean a general age-dependent decrease of liking for all kinds of music; the hypothesis is based on the assumption of an interaction between age and musical style. In our study, the first independent variable ‘age’ is operationalised by the four grades of elementary school (7–10 years). The second independent variable ‘style of music’ is operationalised by different examples of music of conventional and unconventional styles. However, the separation of unconventional from conventional music remains an unresolved issue. The proposal by Hargreaves (Reference HARGREAVES1982a: 51) to use the criterion of ‘regarded by adults’ for the definition of ‘unconventional’ is problematic due to the expected heterogeneity of judgements. We decided to choose popular music for the category of conventional music. This decision is based upon the view of Hargreaves et al. (Reference HARGREAVES, NORTH, TARRANT and McPherson2006: 147) which states that this genre becomes the preferred music towards the end of childhood. For the category of unconventional music, musical examples from the genre of classical, avant-garde and ethnic music were pooled.
For the dependent variable of musical preference, two indicators were used: the first indicator U is the mean rating of every participant for the unconventional music; the second indicator is the difference value D as the difference of the mean rating for unconventional music minus the mean rating for conventional music. Preference ratings have been treated as interval scales, because this is the prerequisite for the statistical testing of contrasts. The value of D was chosen, because it helps to reduce the complexity of statistical output: The repeated measures variable ‘style’ has only two values (conventional/unconventional), and thus using D, we can avoid the much more complex repeated measures analysis. Against this background, the following experimental hypothesis was formulated: Preference ratings of elementary school children for unconventional music (U) would move towards the direction of dislike from grade 1 to 4. The difference of preference ratings between conventional and unconventional music (D) would increase in the same time span. For the pupils of every grade, hypotheses about the means of U (μU,1 . . . μU,4) and D (μD,1 . . . μD,4) can be formulated.
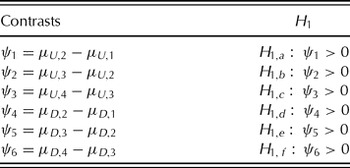
In terms of statistics, ratings for unconventional music and the respective difference values could be tested by a priori contrasts (ψ) between adjacent grades by means of t-tests. This resulted in a total sum of six statistical contrasts (see Table 1). We only speak of a decrease of open-earedness if both contrasts (for the preference ratings and the difference values) between two adjacent grades reached significance (e.g. ψ2 and ψ5 between grades 2 and 3). This procedure approaches most closely Hargreaves’ idea of open-earedness and would be, as we see it, an appropriate translation of it into empirical and statistical hypotheses.
Definition of contrasts and the respective statistical hypotheses. Every contrast (ψ) represents a difference of expected means (μ) between adjacent grades. The hypotheses (H1) indicate that every comparison predicts a higher expected mean in the next higher grade. For the tests of hypotheses, estimated comparisons of contrasts are calculated on the data basis of the observed preference ratings

Music examples and procedure
According to established methods in attitude research, we decided to test behavioural preferences by using a ‘sounding questionnaire’ (Müller, Reference MÜLLER2000) with a selection of music samples (Gembris, Reference GEMBRIS, Stoffer and Oerter2005). After listening to the examples, students were asked to respond to how well they liked the music using a 5-point rating scale. Pictorial answer sheets (emoticons) with a smiley (like) and frowning face (do not like) at each end were used in accordance with LeBlanc et al. (Reference LEBLANC, SIMS, SIIVOLA and OBERT1996). To avoid answer tendencies, the polarity of every second scale was reversed. Examples had an average length of about 60 seconds, an adequate amount of time to ‘tune in’ to the music, which is longer than sound examples in previous studies (e.g. a duration of 30 s was used in LeBlanc et al., Reference LEBLANC, SIMS, SIIVOLA and OBERT1996). The length of the examples differed slightly due to stopping at musically logical phrase endings.
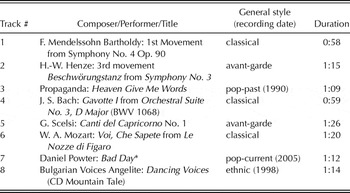
Eight musical examples were selected from the following general musical styles: classical, popular, contemporary and ethnic music, and they were adopted from the explorative study by Schellberg and Gembris (Reference SCHELLBERG and GEMBRIS2003, see Table 2). The listening test was administered by the researchers, and stimuli were presented in a random order. The experiment took place at the end of 2005. The total time for the experiment was about 30 minutes. The experiment took place in the participants’ classrooms during a regular lesson.
List of musical examples used in the preference test

Note. *In the explorative study by Gembris and Schellberg (Reference SCHELLBERG and GEMBRIS2003), the song One to Make her Happy by Marque (2000) was used for the generic style of “current popular music”. In our study, this piece was replaced with a current piece (Bad Day) with a comparable beat.
Participants
In total 186 students from grade 1 to 4 (age: 7–10 years) participated in the experiment. Subjects came from two schools in Hanover in northern Germany. The social environment can be described as upper middle class, and the proportion of immigrants at the two schools was 9.2% and 12.1%, respectively. The researchers were not able to acquire socio-demographic variables from parents such as their educational background, musical expertise or general music preferences.
Results
Main effects
For each pupil, two dependent variables were calculated: (a) mean ratings for unconventional music (U = [Mozart + Henze + Bach + Scelsi + Mendelssohn + Bulgarian]/6), and (b) difference values (D = [Mozart + Henze + Bach + Scelsi + Mendelssohn + Bulgarian]/6 − [Powter + Propaganda]/2).
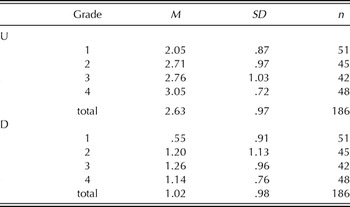
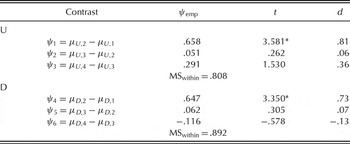
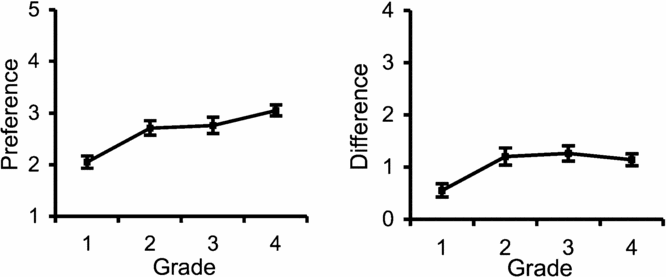
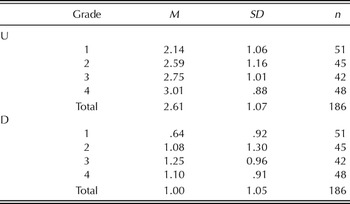
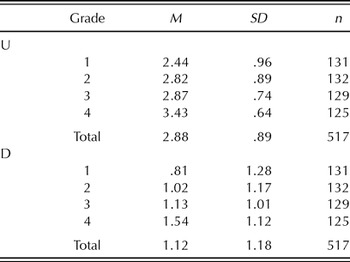
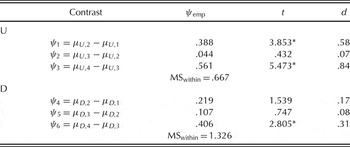
In a next step, estimated contrasts (ψemp) were tested by a t test. The critical t value for significance level of α = .0166 (adjusted for α/3 for three repeated t-tests), calculated by the software G-Power (Erdfelder et al., Reference ERDFELDER, FAUL and BUCHNER1996), is t crit,182, .0166 = 2.146 (one-tailed). Descriptive statistics of ratings are shown in Table 3. Figure 1a shows an increase from grade 1 to 4 of dislike for unconventional music. This change in preference is greater from grade 1 to 2 than for all other grades. The course of rating differences (Figure 1b) shows the same picture with a strong increase from grade 1 to 2. Surprisingly, there is no further increase of difference between unconventional and conventional (popular) music from grade 2 onwards and a slight decrease of rating differences from grade 3 to 4. This means that the counter movement in ratings for unconventional vs. popular music is less extreme from grade 2 onwards. The statistical tests for significance of changes are shown in Table 4. Following our definition of open-earedness, both significant differences for unconventional music and for the rating differences between unconventional and conventional music indicate a decrease of open-earedness from grade 1 to 2 only.
Descriptive statistics for preference ratings. U = mean rating for unconventional music, D = difference between mean ratings (unconventional minus conventional music)

Statistical tests for contrasts. The empirical estimation of contrasts (ψemp) results in a t value which is compared with the critical t value (t crit, 182,.0166 = 2.146) and tested for significance. Additionally, the effect size d (ψemp/MSwithin) is indicated (see Hager, Reference HAGER, Erdfelder, Mausfeld, Meiser and Rudinger1996)

Note. * = P < .0166 (one-tailed).
a (left) and b (right). Mean ratings for unconventional music (left: 1 = like, 5 = do not like) and differences between ratings (right: unconventional music minus conventional music). Error bars indicate standard error of means

Data analysis to the exclusion of ratings for classical music
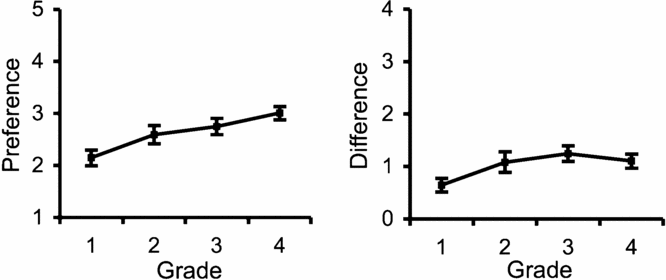
The question remains as to whether classical music can be allocated to the category of unconventional music. First, both classical music and popular music are underpinned by the principles of Western tonality, and second, we can assume a certain proportion of participants listen to classical music at home or learn to play an instrument. Thus, the data analysis was repeated excluding the ratings for classical music. In other words, only avant-garde and ethnic music were regarded as being unconventional. The calculation of the dependent variables is as follows: U = (Henze + Scelsi + Bulgarian)/3; D = (Henze + Scelsi + Bulgarian)/3 − (Power + Propaganda)/2. Descriptive statistics are shown in Table 5 and the respective line diagrams in Figure 2a and b. We expected an increase of the open-earedness effect without the consideration of classical music.
Descriptive statistics for preference ratings under exclusion of ratings for classical music. U = mean rating for unconventional music, D = difference between mean ratings (unconventional minus conventional music)

a (left) and b (right). Mean ratings for unconventional music under the exclusion of classical music (left: 1 = like, 5 = do not like) and differences between ratings (right: unconventional music minus conventional music). Error bars indicate standard error of means

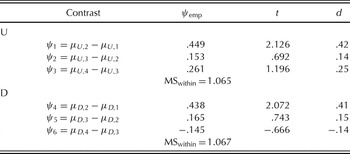
As the contrasts in Table 6 show, the significant differences between grades 1 and 2 (age: 7 and 8 years) disappear if classical music is not considered in data analysis. Additionally, empirical effect sizes decrease from d = .81 to d = .42 for <alt − text> < ?CDATAψ1 < /alt − text> and from d = .73 to d = .41 for <alt − text> < ?CDATAψ4 < /alt − text>. In other words, differences in open-earedness from grade 1 to 2 seem to be based mainly on ratings for classical music. However, classical music is usually not considered as unconventional.
Statistical tests for contrasts under the exclusion of ratings for classical music. The empirical estimation of contrasts (ψemp) results in a t value which is compared with the critical t value (t crit, 182,.0166 = 2.146) and tested for significance. Additionally, the effect size d (ψemp/MSwithin) is indicated (see Hager, Reference HAGER, Erdfelder, Mausfeld, Meiser and Rudinger1996)

Gender differences
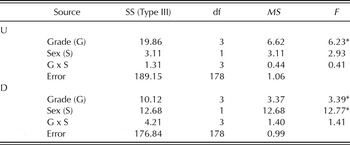
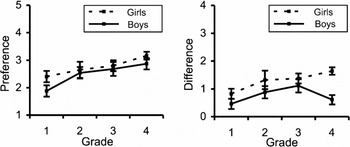
Although the original open-earedness hypothesis did not predict any gender-related differences in preferences for unconventional music, previous studies reported evidence for general gender differences in musical preferences. For example, Russell (Reference RUSSELL, Hargreaves and North1997) reported that most of the previous studies on musical taste found a tendency of male subjects towards ‘hard’ music (e.g. hard rock). Against this background, we explored the hypothesis that boys demonstrate a smaller degree of open-earedness towards unconventional music than girls. Thus, in the next step we processed an analysis of variance for the independent variables, gender and age. Ratings for classical music were excluded. As Table 7 shows, the analysis of ratings for unconventional music (U) shows a significant main effect only for the factor, grade. This effect seems to be caused by rating differences between grades 1 and 4 (Figure 3a). Concerning the difference values D (ratings for unconventional minus ratings for conventional music), a significant main effect for age was found with larger difference in ratings of girls compared to boys (see Figure 3b). As Figure 3b shows, mean ratings of girls show a tendency towards a stronger dislike for unconventional music than for boys. To summarise, gender differences became significant for difference values only.
Two-factorial analysis of variance for preference ratings (ratings for classical music are excluded). U = mean ratings for unconventional music, D = differences between mean ratings (unconventional minus conventional music)

Note. * = P < .05 (two-tailed).
a (left) and b (right). Gender effects in open-earedness. Mean ratings for unconventional music under the exclusion of classical music (left: 1 = like, 5 = do not like) and differences between ratings (right: unconventional music minus conventional music). Error bars indicate standard error of means

Comparison of our results with those by Gembris and Schellberg (2003)
Finally, we wanted to compare our results to those of Gembris and Schellberg (Reference GEMBRIS, SCHELLBERG, Kopiez, Lehmann, Wolther and Wolf2003) by means of a re-analysis. Because we used the same experimental method and sound examples – but different samples of subjects – we could, for example, compare the stability of effects. As Tables 8 and 9 show, the re-analysis of the original data confirms their finding of an open-earedness effect from grade 3 to 4 (age: 9 and 10 years; see Table 9, <alt − text> < ?CDATAψ3 < /alt − text> and <alt − text> < ?CDATAψ6 < /alt − text>). The re-analysis of data confirms Gembris and Schellberg's findings, although we used parametric instead of non-parametric methods of data analysis. We would like to emphasise that there are now results from two extensive samples which confirm an age-related change of musical preference. However, future studies will have to consider additional factors of influence to make clear predictions about the point in time when this transition occurs.
Descriptive statistics of the re-analysis of data by Gembris and Schellberg (Reference GEMBRIS, SCHELLBERG, Kopiez, Lehmann, Wolther and Wolf2003). U = mean rating for unconventional music, D = difference between mean ratings (unconventional minus conventional music)

Statistical tests for contrasts for the re-analysis of data by Gembris and Schellberg (Reference SCHELLBERG and GEMBRIS2003). The empirical estimation of contrasts (ψemp) results in a t value which is compared with the critical t value (t crit, 513,.0166 = 2.135) and tested for significance. Additionally, the effect size d (ψemp/MSwithin) is indicated (see Hager, Reference HAGER, Erdfelder, Mausfeld, Meiser and Rudinger1996)

Note. * = P < .0166 (one-tailed).
Discussion
Main findings
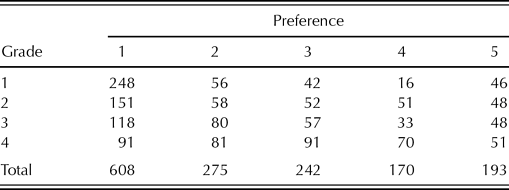
The main objective of this study was to look for age-dependent changes in musical preferences. Based on the same methodology as used in a previous study by Gembris and Schellberg (Reference GEMBRIS, SCHELLBERG, Kopiez, Lehmann, Wolther and Wolf2003), we found a decrease in the openness towards unconventional musical styles from grade 1 to 2. However, data analysis was not based on the ratings for single pieces, but on the grouping of sound examples in the categories of conventional and unconventional musical styles. This classification is according to the original open-earedness hypotheses by Hargreaves (Reference HARGREAVES1982a). However, we have to bear in mind that mean ratings for unconventional music did not exceed the mean scale range of about 3 out of 5 scale steps (see Table 3 and 5). This was also the case for the study by Gembris and Schellberg (Reference GEMBRIS, SCHELLBERG, Kopiez, Lehmann, Wolther and Wolf2003; see Table 8). The assumption of an overall tendency of ratings towards the polarity of liking can also be seen in the distribution of preference frequencies in different grades (see Table 10). In other words, we have to be careful in talking about the rejection of particular musical styles if only half of the preference scale is used for rating. From a different perspective, results could also be interpreted as an age-dependent decline in liking instead of an increase in disliking. Thus, we argue that a universal rejection of unconventional music cannot be validated by this finding. Our conclusion is supported by the findings of LeBlanc et al. (Reference LEBLANC, SIMS, SIIVOLA and OBERT1996): 2,262 subjects expressed their preferences for art music, jazz, and rock on a 5-point Likert scale with 1 for disliking and 5 for liking. However, the mean lowest rating (jazz music) did not fall below the value of 2 and the rating for art music was not found to be lower than 2.5. Additionally, the differences between the three styles were not greater than 1 scale point.
Frequency distribution of preference categories over grades (1 = like, 5 = do not like)

The question of unconventional music
An important issue in the selection of musical examples for the measurement of open-earedness is the question of unconventional music. The decision of Hargreaves (Reference HARGREAVES1982a) to use music regarded by adults as being unconventional does not seem to be the ideal way. A critical point is whether classical music can be regarded as unconventional music. In our opinion, there are two criteria for the classification of music as conventional/unconventional: (a) from the perspective of familiarity with the particular musical idiom (e.g. tonal music), and (b) from the perspective of its life-style relevance for adolescents. From the first perspective, classical music would be classified as conventional because it is indebted to the same tonal idiom as popular music. From the second perspective, classical music would be classified as unconventional because it plays no central role in the life-style of adolescents. This last perspective accords with the view of Hargreaves et al. (Reference HARGREAVES, MARSHALL and NORTH2003: 151f.) that ‘listening to pop music is such a central part of teenagers’ lives that it becomes a ‘badge of identity’ for many of them’. However, we are not convinced that researchers can decide this with certainty, and we therefore propose to limit unconventionality to ethnic or non-tonal avant-garde music. The decision which and how many stimuli best represent the respective categories was limited in our study, because we wanted to replicate Gembris and Schellberg's (Reference GEMBRIS, SCHELLBERG, Kopiez, Lehmann, Wolther and Wolf2003) study and thus had to use the same stimuli.
In our study, the decision to exclude classical music from the category of unconventional musical styles resulted in a disappearance of the open-earedness effect from grade 1 to 2 (see Table 5 and 6). One solution for the problem of unconventionality could be to use a pre-test which would ask for a subject's familiarity with music of different musical styles. In a second step, musical examples would be selected which fit each subject's musical ‘unconventionality profile’. Thus, we cannot rule out that open-earedness exists for unconventional music during elementary school, and at the same time musical preferences focus increasingly on popular music.
Style sensitivity and open-earedness
As Hargreaves et al. (Reference HARGREAVES, NORTH, TARRANT and McPherson2006) argued, style sensitivity to music of different genres develops during childhood. This sensitivity includes the dimension of liking. Thus preference ratings reflect an increasing awareness for differences between musical styles. Consequently, style sensitivity is mainly relevant for music within a musical idiom, such as tonal music. For example, in a comparison of cover versions of the Beatles’ songs performed in different musical styles, North and Hargreaves (Reference NORTH and HARGREAVES1997) found that liking for the excerpts was more associated with ratings for musical style than for the pieces themselves. Against this background, we can assume significant differences in preference judgements between different genres of conventional music. It is interesting that the concepts of open-earedness and style sensitivity are discussed independent of each other in Hargreaves et al. (Reference HARGREAVES, NORTH, TARRANT and McPherson2006). Studies reviewed in their essay with relevance for style sensitivity are related to the background of conventional music, and popular music is separated from classical music. On the other hand, the concept of open-earedness is reserved for unconventional music, such as avant-garde or computer music. In other words, we can assume an open-earedness for unconventional music in elementary school even while popular music becomes the favourite musical style at the same age within the idiom of conventional music. Additionally, as Hargreaves et al. (Reference HARGREAVES, MARSHALL and NORTH2003: 155) point out, we have to be aware that children's developing sensitivity to musical styles also has to take into account the social context in which stylistic perception and evaluation occur. For example, music also serves the function of forming individual and collective musical identities, and as Bourdieu (Reference BOURDIEU and Nice2007) revealed, when considering phases of adolescence, music also functions to create social distinction in society. Finally, we have to think about the method of measurement for the development of open-earedness. For instance, it could be that rating methods based on a like-dislike scale as used in previous studies and ours are only adequate for the measurement of musical preferences within a musical idiom but not between different (and maybe unfamiliar) idioms. Thus, we would like to propose additional dependent scales, such as ‘familiarity’, ‘interestingness’, or ‘associative exploration’ (curiosity behaviour) for the rating of open-earedness in unconventional music.
Gender effects
Behne (Reference BEHNE1996) also observed a gender-related effect with an increasing stereotyping of musical taste: At the age of 11.8 years there is no difference in the liking of soft and hard rock, but at the age of 15, boys generally prefer hard rock and girls soft rock. However, contrary to the study by Gembris and Schellberg (Reference GEMBRIS, SCHELLBERG, Kopiez, Lehmann, Wolther and Wolf2003), we could not confirm that boys show less negative ratings for unconventional music. In contrast, in our study girls showed a higher degree of dislike, particularly in grade 4 (F(3, 178) = 12.77; P < .05). Thus, gender-related differences in musical preferences for unconventional music should be interpreted with caution. This view is supported by Abeles and Chung (Reference ABELES, CHUNG and Hodges1996: 316) who concluded that there is more evidence for ‘no difference due to [the] gender end of the scale’.
Reliability of measurements
Due to reasons of parental consent, a retest could not be conducted. However, we refer to retest reliability as found in previous studies. For example, LeBlanc (Reference LEBLANC1979) found a reliability of r = .91 for class results with 91 days of difference between tests. LeBlanc and Cote (Reference LEBLANC and COTE1983) observed a retest reliability of alpha = .96 in fifth and sixth grade students. In a cross-cultural study investigating music listening patterns in adults, Lehmann (Reference LEHMANN1994) found a retest reliability of r = .88 after 3 months.
Alternative explanations for preference ratings
Even though we were able to observe a slight open-earedness effect, this effect cannot be clearly attributed to one definitive cause. Age as a simple biological variable is not a sufficient explanation, and it seems more likely that a cluster of different variables are combined with biological age and can give a reasonable explanation for age-dependent changes in musical taste. For example, Minkenberg (Reference MINKENBERG1991) found that in 5–10-year-olds, suitability for dancing is the main criterion for preferring particular music. This means that music of an unfamiliar musical style could also be accepted if it matches the children's needs for rhythm and tempo. As a second variable, the influence of media on musical taste should not be disregarded. The elevated preference for popular music can also be explained by the high degree of familiarity with this particular musical style caused by the amount of media exposure. As Kreutz (Reference KREUTZ2001) reported, 4th graders spend an average of 2 hours each day listening to music. Recent survey studies on the media usage of 6–13-year-olds in Germany (e.g., Frey-Vor & Schumacher, Reference FREY-VOR and SCHUMACHER2004) show that acoustical media play an important role for this age group: 50% have their own tape recorder, radio, or walkman. Of the children surveyed, 68% use these devices several times a week, and 32% of the children listen to the radio every day. Watching TV is the most frequently mentioned media usage, and TV is also used to watch music broadcasts. For example, 68% of the 6–13-year-olds prefer music programs such as ‘Top of the Pops’ or ‘The Dome’, and they watch the programs frequently. As authors from another survey study on media usage of children revealed, the upbringing of 2–5-year-olds is accompanied and formed by media (Feierabend & Mohr, Reference FEIERABEND and MOHR2004). For example, 17% of this age group have their own radio, and 15% listen to music every day.
Musical preferences and personality
As a final aspect, there is evidence for the influence of personality traits on musical preferences. For the adult population, Litle and Zuckerman (Reference LITLE and ZUCKERMAN1986) found a correlation between ‘sensation seeking’ and the preference for rock music. Other authors found a preference for exaggerated bass in the music of subjects with high scores in ‘psychoticism’ and ‘extraversion’ (McCown et al., Reference MCCOWN, KEISER and MULHEARN1997) or a relationship between the factor ‘openness to experience’ from the five-factor model of personality (Costa & McCrae, Reference COSTA and MCCRAE1992) and the general breadth of musical preference (Rawlings & Ciancarelli, Reference RAWLINGS and CIANCARELLI1997). For the population of school children, Kreutz and Litta (Reference KREUTZ and LITTA2004) found a correlation between high aggression scores and the preference for aggressive and fast music in 4th graders. Thus, it cannot be ruled out that there is a correlation between sensation seeking and openness to unconventional music.
Methodological proposals
A general problem present in all studies related to the investigation of musical taste by means of a sound questionnaire is the more or less non-systematic choice of musical examples and the usage of non-standardised rating methods. This results in an incomparability of results. Thus, we would like to initiate a discussion on a set of sound examples from different musical styles from which researchers could choose their test material. For example, in our study, unconventional music was represented by ethnic and avant-garde music only. Other unconventional styles, such as free jazz or extreme styles of heavy metal music, were not considered. Standardisation should also be achieved for the rating method. In elementary school children, iconographic rating scales (smiley scales) have been found quite useful.
A critical point is the influence of the student's subjective experiences on the ratings given. In the current study as well as in all previous studies, the students received explicit explanations about how to use the rating dimension. Of course, this is necessary in order to guarantee reasonable answers. Students were also informed about the polarities of the rating scale. However, the method of explicit explanation of the rating scale can be problematic in that subjects could possibly rate the music based not only on their subjectively perceived liking but also make a social judgement. For example, students might think they are supposed to give positive ratings for all of the music because they assume that the teacher likes this kind of music. Such theories could explain why none of the musical stimuli exceeded the neutral mid-scale level to reach a clear level of rejection. Therefore, we cannot be certain whether or not elementary school children would on average rate a musical stimulus between the scale points of liking and a neutral mid-scale position. Any solution to this problem needs to be sure that preference ratings are not influenced by the subjective expectations of the students. Thus, a dependent variable must be found that measures musical preference without allowing the subjects to know the real intention of the procedure. We presume that this method is the prerequisite in order to measure the entire bandwidth from the maximum liking to maximum disliking. This will be one of the tasks for future experiments in the field of musical preferences.
Acknowledgements
We are indebted to the students, Christoph Rosenplänter, Dominique Mayr, Lena Metten and Ulrike Schiller, who took on the task of data collection. Sound examples and raw data of all ratings can be obtained from the website http://musicweb.hmt-hannover.de/openearedness.