Introduction
The regulation of cell volume is essential for cell viability (Hoffmann et al., Reference Hoffmann, Lambert and Pedersen2009). Mammalian cells respond to a decrease in volume by increasing intracellular osmolarity, with the acute response being the activation of inorganic ion import using transporters in the plasma membrane (Hoffmann et al., Reference Hoffmann, Lambert and Pedersen2009). Decreased cell volume activates Na+/H+ exchangers of the NHE (Slc9) family, mainly the ubiquitous NHE1 (Slc9a1 gene product) (Alexander & Grinstein, Reference Alexander and Grinstein2006; Donowitz et al., Reference Donowitz, Ming Tse and Fuster2013). Activation of Na+/H+ exchange not only imports Na+ but also results in an increase in intracellular pH (pHi) because of the coupled H+ efflux. This in turn causes the secondary activation of HCO3 –/Cl– exchangers of the AE (Slc4) family (Romero et al., Reference Romero, Chen, Parker and Boron2013), which opposes the pHi increase and imports Cl– (Humphreys et al., Reference Humphreys, Jiang, Chernova and Alper1995; Jiang et al., Reference Jiang, Chernova and Alper1997). The net result is the coupled import of Na+ and Cl– to increase intracellular osmolarity without any net change in pHi. A second mechanism that can be involved in responding to decreased cell volume is the Na+,K+,2Cl– cotransporter NKCC1 (Slc12a2) (Arroyo et al., Reference Arroyo, Kahle and Gamba2013; Rasmussen et al., Reference Rasmussen, Muller, Jorgensen, Pedersen and Hoffmann2015). Like NHE1, NKCC1 can be quickly activated by a volume decrease. In most mammalian cell types, however, the NHE1-based mechanism is thought to constitute the principal acute response to cell volume decreases (Hoffmann et al., Reference Hoffmann, Lambert and Pedersen2009; Alexander & Grinstein, Reference Alexander and Grinstein2006).
The mechanisms linking cell volume sensing to cell volume regulation are incompletely understood (Alexander & Grinstein, Reference Alexander and Grinstein2006; Hoffmann et al., Reference Hoffmann, Lambert and Pedersen2009; Hoffmann & Pedersen, Reference Hoffmann and Pedersen2011; Rasmussen et al., Reference Rasmussen, Muller, Jorgensen, Pedersen and Hoffmann2015). NHE1 is a key regulator of pHi and is activated directly by decreased cytoplasmic pH through protonation of the NHE1 protein (Aronson et al., Reference Aronson, Nee and Suhm1982). NHE1 can also be activated downstream of growth factor signalling by direct phosphorylation (Malo & Fliegel, Reference Malo and Fliegel2006; Sardet et al., Reference Sardet, Counillon, Franchi and Pouyssegur1990). However, neither decreased pHi nor direct phosphorylation of NHE1 protein are implicated in its activation when induced by decreased cell volume (Alexander & Grinstein, Reference Alexander and Grinstein2006; Hoffmann et al., Reference Hoffmann, Lambert and Pedersen2009). Only one pathway has been clearly implicated in signal transduction between decreased cell volume and NHE1 activation. Janus kinase 2 (JAK2) was found to be phosphorylated and activated upon decreased cell volume in several cell types including 2-cell mouse embryos (Gatsios et al., Reference Gatsios, Terstegen, Schliess, Häussinger, Kerr, Heinrich and Graeve1998; Zhou & Baltz, Reference Zhou and Baltz2013; Xu et al., Reference Xu, Zhou, Meredith and Baltz2017). Activated JAK2 then phosphorylates calmodulin (CaM) which in turn binds to and activates NHE1 to mediate cell volume recovery (Garnovskaya et al., Reference Garnovskaya, Mukhin, Vlasova and Raymond2003). However, it appears unlikely that this non-canonical JAK2 signalling pathway is the sole mechanism of NHE1 activation by decreased cell volume, as complete inhibition of JAK2 fails to completely abolish NHE1 activation, at least in the cell types that have been examined thus far (Hoffmann et al., Reference Hoffmann, Lambert and Pedersen2009; Garnovskaya et al., Reference Garnovskaya, Mukhin, Vlasova and Raymond2003; Zhou & Baltz, Reference Zhou and Baltz2013).
In addition to JAK2, other kinases can be activated by cell shrinkage and therefore could have a role in activating NHE1. In several cell types, decreased cell volume has been shown to quickly stimulate phosphorylation of tyrosine residues on focal adhesion kinase (FAK aka PTK2). In general, the initial activation of FAK requires autophosphorylation of Y397. SRC then binds to the region of FAK that includes phosphorylated Y397, in turn phosphorylating other residues on FAK such as Y576/577, Y861, and Y925, leading to further activation of FAK (Schaller et al., Reference Schaller, Hildebr, Shannon, Fox, Vines and Parsons1994; Schlaepfer & Hunter, Reference Schlaepfer and Hunter1996; Schlaepfer et al., Reference Schlaepfer, Mitra and Ilic2004; Arold, Reference Arold2011; Rasmussen et al., Reference Rasmussen, Muller, Jorgensen, Pedersen and Hoffmann2015). Upon cell shrinkage, FAK is rapidly phosphorylated on Y397 in many (although not all) cell types that have been investigated (Lunn & Rozengurt, Reference Lunn and Rozengurt2004; Lunn et al., Reference Lunn, Jacamo and Rozengurt2007; Rasmussen et al., Reference Rasmussen, Muller, Jorgensen, Pedersen and Hoffmann2015) and therefore FAK was an attractive candidate to contribute to activation of NHE1 in cell volume regulation, including in embryos.
Early preimplantation embryos of mammals are especially sensitive to osmotic stress and decreased cell volume. In the mouse, relatively minor dysregulation of cell volume control causes development to become irreversibly blocked at the 2-cell stage (Lawitts & Biggers, Reference Lawitts and Biggers1992; Hadi et al., Reference Hadi, Hammer, Algire, Richards and Baltz2005; Baltz & Tartia, Reference Baltz and Tartia2010; Baltz & Zhou, Reference Baltz and Zhou2012). It was found that this embryonic arrest was likely to be due to the accumulation of inorganic ions via NHE1 needed to balance even physiologically normal external osmolarity (Zhou & Baltz, Reference Zhou and Baltz2013; Zhou et al., Reference Zhou, FitzHarris, Alper and Baltz2013; Xu et al., Reference Xu, Zhou, Meredith and Baltz2017). Because of the crucial role that cell volume regulation plays in early embryogenesis, their mechanisms have been extensively investigated (Baltz & Tartia, Reference Baltz and Tartia2010; Baltz & Zhou, Reference Baltz and Zhou2012). We have shown that mouse embryos throughout preimplantation development activate NHE1 in response to decreased cell volume and that NHE1 activity is needed to maintain their cell volumes (Zhou & Baltz, Reference Zhou and Baltz2013; Xu et al., Reference Xu, Zhou, Meredith and Baltz2017).
NHE1 has several roles that, besides cell volume regulation as detailed above, mainly include regulating pHi by mediating recovery from intracellular acidosis. It has previously been established that NHE1 is present and active in pHi regulation in mouse embryos (Gibb et al., Reference Gibb, Poronnik, Day and Cook1997; Steeves et al., Reference Steeves, Lane, Bavister, Phillips and Baltz2001; Harding et al., Reference Harding, Gibb, Johnson, Cook and Day2002; Siyanov & Baltz, Reference Siyanov and Baltz2013). NHE1 activity is elicited by decreased pHi throughout preimplantation development, exhibiting its highest activity at the 8-cell and morula stages (Siyanov & Baltz, Reference Siyanov and Baltz2013). By contrast, NHE1 activation by a cell volume decrease is most robust at the 2-cell stage with less activity at the 8-cell and morula stages (Steeves et al., Reference Steeves, Lane, Bavister, Phillips and Baltz2001; Siyanov & Baltz, Reference Siyanov and Baltz2013; Zhou & Baltz, Reference Zhou and Baltz2013; Xu et al., Reference Xu, Zhou, Meredith and Baltz2017).
NHE1 activation by decreased cell volume in mouse embryos, at least at the 1- and 2-cell stages, is entirely dependent on the action of tyrosine kinases, as their broad-spectrum inhibition by genistein completely prevents NHE1 activation (Zhou & Baltz, Reference Zhou and Baltz2013; Xu et al., Reference Xu, Zhou, Meredith and Baltz2017). JAK2 has been implicated as a tyrosine kinase mediating NHE1 activation at the 2-cell embryo stage (Zhou & Baltz, Reference Zhou and Baltz2013); it is rapidly activated upon a cell volume decrease and rapidly inactivated when volume is restored (Xu et al., Reference Xu, Zhou, Meredith and Baltz2017). At the 2-cell stage, much of NHE1 activation appears to be mediated by JAK2, but a significant proportion of NHE1 activation remains even when JAK2 is entirely inhibited (Zhou & Baltz, Reference Zhou and Baltz2013; Xu et al., Reference Xu, Zhou, Meredith and Baltz2017). By contrast, although NHE1 is also activated by a cell volume decrease at the 1-cell embryo stage (although to a lesser extent than at the 2-cell stage), its activation is almost entirely independent of JAK2; the JAK2-depedent portion only appears at the end of the 1-cell stage just before cleavage (Xu et al., Reference Xu, Zhou, Meredith and Baltz2017). This led naturally to the hypothesis that the same JAK2-independent component was present at both the 1-cell and 2-cell stages, with a JAK2-dependent component added at the 2-cell stage. JAK2 phosphorylation by decreased cell volume may peak at the 2-cell stage, as 8-cell embryos did not show a significant increase in tyrosine phosphorylation in response to a cell volume decrease (Zhou & Baltz, Reference Zhou and Baltz2013).
It has previously been shown that FAK (PTK2 protein) is present in mouse oocytes and fertilized eggs (McGinnis et al., Reference McGinnis, Luo and Kinsey2013; McGinnis & Kinsey, Reference McGinnis and Kinsey2015). The aim of this study was to determine if FAK autophosphorylation was required for activation of NHE1 in response to a cell volume decrease. The early preimplantation mouse embryo is one of only a few cell types in which the signalling leading to osmotic NHE1 activation has been elucidated (Garnovskaya et al., Reference Garnovskaya, Mukhin, Vlasova and Raymond2003; Hoffmann et al., Reference Hoffmann, Lambert and Pedersen2009; Zhou & Baltz, Reference Zhou and Baltz2013) and the only one in which JAK2-dependent signalling has been shown to appear during development (Xu et al., Reference Xu, Zhou, Meredith and Baltz2017). We focused on phosphorylation of FAK Y397 as it is the initial autophosphorylation event considered to be required for FAK activation. The results of this study did not support the hypothesis that FAK, at least its Y397 autophosphorylation, is involved in activation of NHE1 in mouse embryos.
Materials and methods
Chemicals and solutions
Chemicals were obtained from Sigma-Aldrich (Oakville, Ontario, Canada) unless otherwise specified. Components of culture medium were embryo-tested or cell culture-grade. The FAK inhibitor PF-562271 was manufactured by Selleck Chemicals (Houston, Texas). SNARF-1-AM (carboxyseminaphthorhodafluor-1-acetoxymethyl ester) was purchased from Invitrogen Molecular Probes (Eugene, OR, USA). Stock solutions were prepared for nigericin in ethanol and for valinomycin, SNARF-1-AM, and PF-562271 in dimethyl sulfoxide and stored at −20°C.
The medium used with embryos were modified HEPES-buffered potassium-supplemented simplex-optimized medium (KSOM) mouse embryo medium (Lawitts & Biggers, Reference Lawitts and Biggers1993) designated mHEPES–KSOM which contains (in mM) 95 NaCl, 2.5 KCl, 0.35 KH2PO4, 0.2 MgSO4, 10 Na lactate, 0.2 glucose, 0.2 Na pyruvate, 4 NaHCO3, 1.7 CaCl2, 0.01 tetrasodium EDTA, 0.03 streptomycin SO4, 0.16 penicillin G, and 21 HEPES (4-(2-hydroxyethyl)piperazine-1-ethanesulfonic acid, N-(2-hydroxyethyl)piperazine-N′-(2-ethanesulfonic acid)). Polyvinyl alcohol (PVA) was used instead of bovine serum albumin as the macromolecular component. pH was adjusted to 7.4 with NaOH. For pHi measurements, PVA was omitted, 9 mM of Na lactate was replaced with NaCl, and NaHCO3 was replaced with equimolar NaCl, resulting in bicarbonate-free mHEPES–KSOM (0bicHEPES–KSOM). Media were equilibrated with air and used at 37°C.
Collection of embryos
All mice were obtained from Charles River, St. Constant, QC, Canada). The Animal Care Committee (ACC) of the University of Ottawa approved all animal protocols. Euthanasia was by cervical dislocation by trained personnel. Because anaesthetic agents can interfere with membrane transporters, anaesthesia was not used, which is acceptable under the Canadian Council on Animal Care Guidelines on Euthanasia of Animals Used in Science, 2010 (Section 5.6) and was approved by the ACC.
Embryos were obtained from CF1 female mice 4–6 weeks of age. Females were superovulated by intraperitoneal injections of 5 IU equine chorionic gonadotropin (eCG) followed by human chorionic gonadotropin (hCG, 5IU) 47h later (both from Intervet, Kirkland, QC). Females were caged overnight with BDF1 (B6D2F1) males for mating. Embryos were flushed from excised oviducts with mHEPES–KSOM ~19–22h post-hCG for 1-cell embryos and ~42–44 h for 2-cell embryos. A brief exposure to hyaluronidase (300 mg/ml) was used to free 1-cell embryos from the cumulus matrix. Embryos that were not of high quality (e.g. with uneven blastomeres, granular cytoplasm, or fragmentation) were uncommon and were discarded.
Each female mouse yields about 10–15 embryos. For experiments in which pHi was measured on 9–12 embryos simultaneously, embryos were obtained from 1–2 females. For western blots, in which each lane contained lysate from 60 embryos, embryos were pooled from females until the requisite number was obtained.
Intracellular pH measurements
pHi was measured with a quantitative imaging microscope (ISee Imaging Systems, Raleigh, NC) as previously described (Zhou & Baltz, Reference Zhou and Baltz2013; Xu et al., Reference Xu, Zhou, Meredith and Baltz2017). Embryos were loaded with the pH-sensitive fluorophore, SNARF-1 by incubating them for 30 min with 5 µM SNARF-1-AM. pHi was determined by fluorescence ratio imaging using emission wavelengths of 600 and 640 nm with excitation at 535 nm. Images were divided after background subtraction to obtain 640/600 ratiometric images, which are dependent mainly on pHi. Ratios were calibrated using the nigericin/high K+ method with valinomycin (Thomas et al., Reference Thomas, Buchsbaum, Zimniak and Racker1979) as previously described (Baltz & Phillips, Reference Baltz and Phillips1999). All measurements were done at 37°C in air. NHE1 activity was measured by monitoring the pHi of a group of embryos simultaneously, first for 10 min at 250 mOsM and then for 15 min at 350 mOsM, for in total, 25 min. Where plots of pHi v. time are presented, the osmolarity is indicated within boxes on the time axis. Where its presence is indicated, embryos were exposed to the inhibitor (PF-562271) for ~30 min before osmolarity was increased and continued to be present in the higher osmolarity medium as previously described (Xu et al., Reference Xu, Zhou, Meredith and Baltz2017).
We have previously established and validated this method for measuring cell volume decrease-induced NHE1 activity in embryos (Zhou & Baltz, Reference Zhou and Baltz2013; Xu et al., Reference Xu, Zhou, Meredith and Baltz2017). Briefly, pHi was shown to increase in response to an increase in external osmolarity concomitant with the decrease in cell volume, and this increase was confirmed as being due to Na+/H+ exchange by showing that it did not occur in the absence of external Na or in the presence of amiloride, a general inhibitor of Na+/H+ exchange mediated by NHE isoforms (Zhou & Baltz, Reference Zhou and Baltz2013). The Na+/H+ exchanger activity was established as being due to NHE1 using the highly selective NHE1 inhibitor, cariporide, which completely blocked the pHi increase and impaired the ability of embryos to maintain their resting volumes (Zhou & Baltz, Reference Zhou and Baltz2013). Finally, unfertilized eggs and preimplantation embryos have been shown to express the Slc9a1 mRNA that encodes NHE1 (Siyanov & Baltz, Reference Siyanov and Baltz2013). Therefore, the rate of pHi increase upon a cell volume decrease has been established to reflect NHE1 activity. The initial rate of increase of pHi was determined by a linear least square fit to the initial portion of the curve to provide a quantitative measure of NHE1 activity (Xu et al., Reference Xu, Zhou, Meredith and Baltz2017).
Western blots
The primary antibodies used were as follows. For FAK phosphorylated on Y397, rabbit affinity-purified polyclonal raised against a peptide (ab81298, Abcam, Toronto, ON, Canada) was used at 1:15 000 dilution. For total FAK, the rabbit C-20 polyclonal directed against the FAK C-terminus (sc-558, Santa Cruz Biotechnology, Mississauga, ON, Canada) was used at 1:800 dilution. For GAPDH, rabbit FL-335 antibody against full-length GAPDH was used (sc-25778, Santa Cruz) at 1:500 dilution. The secondary antibody for all was HRP goat anti-rabbit IgG (1721019, Bio-Rad, Mississauga, ON, Canada) was used at 1:10 000 for Y397 and 1:5000 for FAK and GAPDH. All antibodies were blocked with 5% milk powder.
For western blots, embryos were isolated and then incubated in 250 mOsM medium for 30 min either in the presence of the FAK inhibitor PF-562271 or with vehicle (dimethyl sulfoxide) alone. The embryos were then transferred to 550 mOsM medium in the continued presence of the inhibitor or vehicle and incubated at 550 mOsM for 15 min. At the end of this incubation, the embryos (10 embryos per µl) were transferred onto the inside of the lid of a 0.2 ml microcentrifuge tube into an equal volume of 2× lysis buffer (containing 5 % SDS, 200 µM VO4, and 80 µM phenylarsine oxide) and, after lysis, centrifuged into the tube and stored at −80°C. In total, 60 embryos were added to each tube.
Embryo lysates (60 embryos per lane) were separated by SDS PAGE (10 % gels), transferred to nitrocellulose membranes, blocked for 1 h, and incubated with primary antibody overnight at 4°C. Blots were then washed and incubated with secondary antibody for 1 h at room temperature. Visualization was performed using an ECL Prime Detection Kit (Amersham, GE Healthcare UK Limited, Buckinghamshire, UK). Before incubation with primary antibodies, blots were cut at ~50 kDa. The upper portion was probed for Y397. After detection, these blots were stripped and re-probed for total FAK. The lower portion was probed for GAPDH.
Western blots band densities were quantified from scanned images of films with Image J (v1.51, NIH) using its standard algorithm (https://imagej.nih.gov/ij/docs/menus/analyze.html#gels). Relative band densities were normalized to the sum of the density on each western blot, which is arbitrarily set to 100. FAK Y397 phosphorylation was quantified by dividing each normalized band density to total FAK in the same lane.
Imposed cell volume decreases
Embryo cell volume decreases were imposed using hypertonic mHEPES–KSOM whose osmolarity was increased with the trisaccharide d-(+)-raffinose. Osmolarity was measured with a vapour pressure osmometer (model 5520, Wescor, Logan, UT, USA). We have extensively used hypertonic raffinose solutions for decreasing cell volume in embryos, as raffinose is not transported into or metabolized by mammalian cells and this use has been extensively validated in embryos (Dawson & Baltz, Reference Dawson and Baltz1997; Zhou & Baltz, Reference Zhou and Baltz2013; Xu et al., Reference Xu, Zhou, Meredith and Baltz2017). Briefly, a rapid cell volume decrease was imposed by changing the external osmolarity from the normal 250 mOsM of mHEPES–KSOM to a higher value, thus decreasing embryo cell volumes due to the increased external osmotic pressure. For pHi measurements, decreased cell volume was induced with 350 mOsM medium. We previously showed that the rate of pHi increase was robust at both 350 and 550 mOsM (Zhou et al., Reference Zhou, FitzHarris, Alper and Baltz2013). For western blots, we had previously shown for JAK2 that phosphorylation was more easily detected at 550 than 350 mOsM (Zhou & Baltz, Reference Zhou and Baltz2013). We therefore used 350 mOsM for pHi measurements to minimize cellular stress in live embryos during the measurements but 550 mOsM for western blots to minimize the number of embryos required per lane, as previously described and validated (Xu et al., Reference Xu, Zhou, Meredith and Baltz2017). Embryos remain viable through such exposures, as 2-cell embryos will develop to blastocysts following a 15 min exposure to 550 mOsM medium comparable to unexposed embryos (our unpublished observation).
Data analysis
Plots were generated, and statistical analyses performed using Prism 7 (GraphPad Software, San Diego, CA, USA). Data are presented as the mean ± standard error of the mean (sem). Means were compared by unpaired t-test (two groups) or one-way analysis of variance (ANOVA) (>2 groups) followed by Tukey’s multiple comparison test when the overall ANOVA indicated a significant difference. Difference of a mean to a theoretical value was tested by one-sample t-test. A P-value <0.05 was considered significant, but actual calculated P-values are reported here when reported by Prism.
Results
We first determined whether maximally inhibiting FAK would affect the ability of 2-cell embryos to activate NHE1 in response to a cell volume decrease. These experiments relied on our previously validated assay that detects volume-mediated increases in NHE1 activity as a marked intracellular alkalinization when cell volume is decreased by introduction of hypertonic medium (Zhou & Baltz, Reference Zhou and Baltz2013; Zhou et al., Reference Zhou, FitzHarris, Alper and Baltz2013; Xu et al., Reference Xu, Zhou, Meredith and Baltz2017). We used the selective FAK inhibitor PF-562271 at a high concentration that would be expected to completely block any FAK activity (Roberts et al., Reference Roberts, Ung, Whalen, Cooper, Hulford, Autry, Richter, Emerson, Lin, Kath, Coleman, Yao, Martinez-Alsina, Lorenzen, Berliner, Luzzio, Patel, Schmitt, LaGreca, Jani, Wessel, Marr, Griffor and Vajdos2008) and that was similar to concentrations previously used to inhibit FAK in other types of intact cells (Wiemer et al., Reference Wiemer, Wernimont, Cung, Bennin, Beggs and Huttenlocher2013; Yoon et al., Reference Yoon, Choi, Song, Do, Kang, Ko, Song and Kim2014). We chose PF-562271 because it was considered among the most selective for FAK and was being developed as an anti-cancer drug and therefore its selectivity had been extensively assessed (Roberts et al., Reference Roberts, Ung, Whalen, Cooper, Hulford, Autry, Richter, Emerson, Lin, Kath, Coleman, Yao, Martinez-Alsina, Lorenzen, Berliner, Luzzio, Patel, Schmitt, LaGreca, Jani, Wessel, Marr, Griffor and Vajdos2008; Wiemer et al., Reference Wiemer, Wernimont, Cung, Bennin, Beggs and Huttenlocher2013). PF-562271 is about 10-fold more selective for FAK over the closely related kinase PYK2 in in vitro assays; at higher concentrations it also exhibits inhibition of several cyclin-dependent kinases and GSK3 (Roberts et al., Reference Roberts, Ung, Whalen, Cooper, Hulford, Autry, Richter, Emerson, Lin, Kath, Coleman, Yao, Martinez-Alsina, Lorenzen, Berliner, Luzzio, Patel, Schmitt, LaGreca, Jani, Wessel, Marr, Griffor and Vajdos2008), which are, however, not implicated in cell volume regulation.
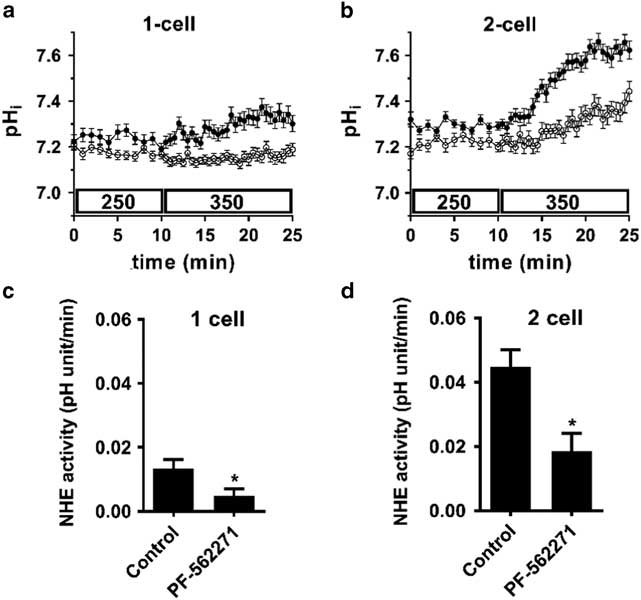
The addition of 10 µM PF-562271 significantly decreased the intracellular alkalinization induced by a cell volume decrease after introduction of hypertonic medium (350 mOsM 0bicHEPES-KSOM) in both 1- and 2-cell embryos (Fig. 1). In 1-cell embryos the inhibitor almost completely prevented the increase in intracellular pH, while in the 2-cell embryos it reduced the rate of intracellular alkalinization by ~50 % relative to the control.
Inhibition of NHE1 activity stimulated by a decreased cell volume in both 1-cell and 2-cell embryos by the selective FAK inhibitor PF-562271. Representative examples of pHi as a function of time in 1-cell (A) or 2-cell (B) embryos in the presence of PF-562271 (10 µM; open circles) or control (vehicle alone; 0.02 % DMSO; filled circles). Each trace represents the mean pHi (±sem) of 10 (A) or 11 (B) embryos measured simultaneously for each treatment. A decrease in cell volume was induced at t=10 min by replacing 250 mOsM with 350 mOsM medium. PF-562271 or vehicle was present from t=0). NHE1 activity was quantified as the mean rate of increase in pHi after introduction of 350 mOsM medium for N=3 independent repeats (C, D), examples of which are shown in (A) and (B). Each repeat had N=9–12 embryos within each treatment group. Means were compared within each embryo stage by t-test. *P=0.019 in (C), P=0.025 in (D). These initial results were consistent with the hypothesis that FAK mediates NHE1 activation by decreased cell volume at the 1-cell stage and that this component persists into the 2-cell stage when an additional component mediated by JAK2 is added.
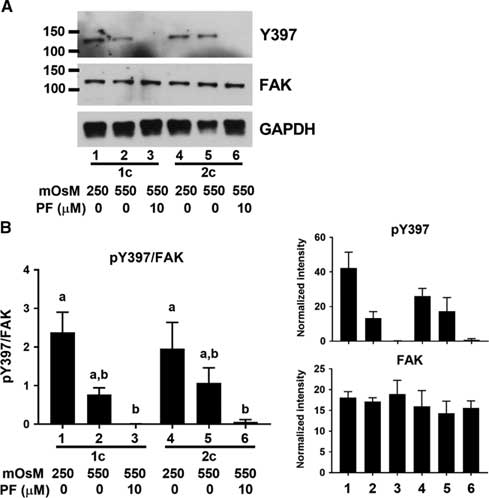
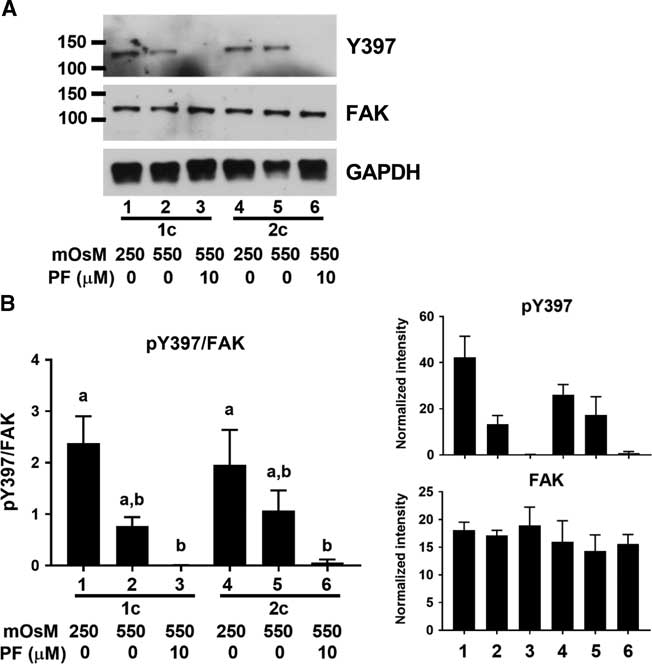
We next sought to determine whether FAK was indeed activated by decreased cell volume in early mouse embryos. As the initial activation of FAK requires autophosphorylation of Y397 (Arold, Reference Arold2011), we used an antibody that detects FAK phosphorylated on Y397. A band was detected at the expected size of ~125 kDa in both 1- and 2-cell embryos that were incubated in isotonic (250 mOsM) medium (Fig. 2A). The band detected likely represented a phosphorylated protein, as it was eliminated by the presence of PF-562271 (10 µM). When the cell volume of embryos was decreased by exposure to 550 mOsM medium for 15 min, there was, however, no increase in Y397 phosphorylation at either stage (Fig 2B). Therefore, it does not appear that FAK in early mouse embryos becomes further autophosphorylated and activated in response to decreased cell volume.
FAK Y397 phosphorylation in 1- and 2-cell embryos. (A) Representative example of western blot showing phosphorylated FAK Y397 and total FAK in 1-cell (lanes 1–3) and 2-cell (lanes 4–6) embryos at 250 mOsM, after 15 min at 550 mOsM, or with 10 µM PF-562271 as indicated by labels at bottom (60 embryos per lane). Vehicle (0.02 % DMSO) was present in controls. GAPDH was also probed as indicated. (B) Quantification of Y397 phosphorylation. Y397 band intensities were normalized to total FAK in the same lane (left). Bars that do not share the same letter are significantly different by ANOVA with Tukey’s multiple comparison test (a v. b, P<0.05; overall ANOVA P=0.005). Mean band densities measured for Y397 and FAK are shown at right. N = 3 independent repeats, each with 60 embryos/lane.
The observation that 10 µM PF-562271 inhibited NHE1 activation upon a cell volume decrease in both 1-cell and 2-cell stage embryos (Fig. 1) but FAK Y397 phosphorylation was not increased were possibly contradictory. Pharmacological inhibitors generally can have off-target effects, particularly at higher concentrations (Karaman et al., Reference Karaman, Herrgard, Treiber, Gallant, Atteridge, Campbell, Chan, Ciceri, Davis, Edeen, Faraoni, Floyd, Hunt, Lockhart, Milanov, Morrison, Pallares, Patel, Pritchard, Wodicka and Zarrinkar2008). PF-562271 is reportedly selective for FAK, but at higher concentrations could inhibit a number of other tyrosine kinases (Roberts et al., Reference Roberts, Ung, Whalen, Cooper, Hulford, Autry, Richter, Emerson, Lin, Kath, Coleman, Yao, Martinez-Alsina, Lorenzen, Berliner, Luzzio, Patel, Schmitt, LaGreca, Jani, Wessel, Marr, Griffor and Vajdos2008) as discussed above. Therefore, we hypothesized that, if the inhibition of NHE1 activity by a high concentration of PF-572271 was due to an off-target effect, the inhibitor might not affect NHE1 activation at lower concentrations in which it nonetheless could still block FAK Y397 phosphorylation. We therefore determined the lowest concentration of PF-562271 that could still inhibit the increase in alkalinization in 2-cell embryos after the introduction of hypertonic medium. This revealed that, while 5 µM PF-562271 significantly decreased the rate of intracellular alkalinization, up to 2.5 µM had no significant effect (Fig. 3), implying that NHE1 activation was not inhibited by PF-562271 at concentrations of 2.5 µM or less.
NHE1 activity in 2-cell embryos as a function of PF-562271 concentration. NHE1 activity induced by a cell volume decrease was measured as the mean rate of increase in pHi after introduction of 350 mOsM medium, as in Fig. 1. There was no significant decrease in NHE1 activity at any concentration of PF-562271 (filled circles) compared with vehicle only (0 µM), except 5 µM (**P<0.01 by ANOVA with Tukey’s multiple comparison test; overall ANOVA P=0.003). Each point represents the mean (± sem) of 5–7 independent repeats, except for 0 µM (N=23 due to inclusion of controls each day). NHE1 activities measured at 0 and 10 µM PF-562271 from Fig. 1 are shown (grey squares) for comparison (not included in statistical analysis here).

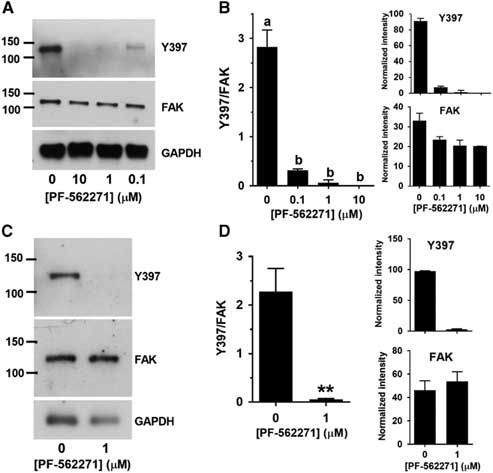
We then determined whether Y397 phosphorylation was inhibited by PF-562271 within this range. A pilot experiment indicated that both 2.5 and 5 µM PF-562271 eliminated Y397 phosphorylation as effectively as 10 µM (not shown), and so we tested lower concentrations. Y397 phosphorylation was almost completely eliminated by 0.1 µM PF-562271 and there were no detectable bands at 1 µM or 10 µM (Fig. 4A and B). Because we had found that 1 µM was well within the range in which there was no effect on NHE1 activation induced by decreased cell volume, we performed an independent set of measurements to confirm that this concentration completely eliminated Y397 phosphorylation (Fig. 4C and D). Therefore, NHE1 could still be maximally activated by a cell volume decrease at a concentration of PF-562271 (1 µM) that eliminated FAK autophosphorylation.
FAK Y397 phosphorylation in 2-cell embryos after 15 min at 550 mOsM at various concentrations of PF-562271. (A) Representative western blot of phosphorylated Y397, total FAK or GAPDH in 2-cell embryos at 0, 0.1, 1.0 and 10 µM PF-562271 (indicated at bottom; 50 2-cell embryos per lane). (B) Quantification of Y397 band intensity expressed as mean (±sem) relative to total FAK (example in (A)), analyzed as described in Fig. 2 legend. All bands differed from control (0 = vehicle only) by ANOVA with Tukey multiple comparison test (a v. b, P<0.0001; overall ANOVA P<0.0001). N=3 independent repeats. The mean inhibition at each concentration determined using Y397/FAK was 89 %, 98 %, and 100 % for 0.1, 1.0 and 10 µM, respectively. The values for Y397/FAK were also tested by one-sample t-test for difference from 0. The values were significantly different from 0 for 0 and 0.1 µM PF-562271 (P=0.015 and 0.010, respectively) but were not significantly different from 0 for 1.0 or 10 µM (P=0.42 and 1.0, respectively). (C) Representative western blot (60 embryos per lane) of independent test of 0 v. 1 µM PF-562271 in 2-cell embryos. (D) Quantification of N=3 separate repeats of western blots an example of which is shown in C. **P=0.01 by t-test.

Discussion
It has been well established that NHE1 is activated by decreased cell volume and is generally required for cell volume homeostasis in mammalian cells (Hoffmann et al., Reference Hoffmann, Lambert and Pedersen2009; Alexander & Grinstein, Reference Alexander and Grinstein2006) including in preimplantation embryos (Zhou & Baltz, Reference Zhou and Baltz2013; Xu et al., Reference Xu, Zhou, Meredith and Baltz2017). Furthermore, such NHE1 activation appears to be entirely dependent on the activity of tyrosine kinases as it is abolished by the broad-spectrum tyrosine kinase inhibitor, genistein (Krump et al., Reference Krump, Nikitas and Grinstein1997; Zhou & Baltz, Reference Zhou and Baltz2013; Xu et al., Reference Xu, Zhou, Meredith and Baltz2017). It has been shown in several types of mammalian cells, including 2-cell embryos, that JAK2 accounts for a portion of this regulation (Garnovskaya et al., Reference Garnovskaya, Mukhin, Vlasova and Raymond2003; Zhou & Baltz, Reference Zhou and Baltz2013; Xu et al., Reference Xu, Zhou, Meredith and Baltz2017) but a major component is JAK2-independent (Hoffmann et al., Reference Hoffmann, Lambert and Pedersen2009). Therefore, additional tyrosine kinase signalling is implicated but the kinase involved remains unidentified. The tyrosine kinase FAK (PTK2) had been proposed as a signalling mechanism involved as it has been shown to become phosphorylated and activated by decreased cell volume in a number of cell types (Lunn & Rozengurt, Reference Lunn and Rozengurt2004; Lunn et al., Reference Lunn, Jacamo and Rozengurt2007; Rasmussen et al., Reference Rasmussen, Muller, Jorgensen, Pedersen and Hoffmann2015).
The results reported here, however, do not support the hypothesis that the autophosphorylation of FAK on Y397 is likely to be involved in NHE1 activation in early mouse embryos. We detected FAK protein expression at both the 1-cell and 2-cell embryo stages, this is consistent with previous studies showing its expression in oocytes and early embryos (McGinnis et al., Reference McGinnis, Carroll and Kinsey2011, Reference McGinnis, Luo and Kinsey2013) but FAK autophosphorylation on Y397, considered to be an initial step in its activation, was not increased when cell volume was decreased at either stage. Furthermore, NHE1 activation was unaffected by concentrations of the FAK-selective inhibitor PF-562271 that rendered Y397 phosphorylation essentially undetectable by western blot.
We found that only the highest concentrations of PF-562271 that were tested (5 and 10 µM) inhibited NHE1 activation, which occurred well above the 0.1 and 1.0 µM that greatly diminished or abolished FAK Y397 phosphorylation in embryos (above) and other cells (Wendt & Schiemann, Reference Wendt and Schiemann2009; Yoon et al., Reference Yoon, Choi, Song, Do, Kang, Ko, Song and Kim2014) and well in excess of the reported IC50 for PF-562271 of ~5 nM in intact cells (Roberts et al., Reference Roberts, Ung, Whalen, Cooper, Hulford, Autry, Richter, Emerson, Lin, Kath, Coleman, Yao, Martinez-Alsina, Lorenzen, Berliner, Luzzio, Patel, Schmitt, LaGreca, Jani, Wessel, Marr, Griffor and Vajdos2008). Therefore, we interpret the inhibition of NHE1 activation by high concentrations of PF-562271 as likely to be to due to off-target inhibition of other tyrosine kinases, which has been reported to occur at high micromolar concentrations of the compound (Roberts et al., Reference Roberts, Ung, Whalen, Cooper, Hulford, Autry, Richter, Emerson, Lin, Kath, Coleman, Yao, Martinez-Alsina, Lorenzen, Berliner, Luzzio, Patel, Schmitt, LaGreca, Jani, Wessel, Marr, Griffor and Vajdos2008).
Had these results instead supported a role for FAK in the activation of NHE1 in embryos, additional experiments would have clearly been required in addition to using the single inhibitor, PF-562271. To establish a required role for FAK, additional selective inhibitors would have needed to be employed as well as independent techniques such as knockdown or dominant-negative inhibition of FAK. Indeed, this was the strategy we used to establish a role for JAK2 at the 2-cell stage, in which several different selective JAK2 inhibitors and expression of a dominant-negative JAK2 all produced similar results (Zhou & Baltz, Reference Zhou and Baltz2013). However, given that complete elimination of FAK Y397 phosphorylation failed to have a detectable effect on NHE1 activation, an investigation of PF-562271 specificity at the concentrations used in embryos was not pursued.
So far, the only signalling mechanism convincingly implicated in transducing a signal from decreased cell volume to NHE1 activation in mammalian cells (including 2-cell mouse embryos) remains the JAK2-calmodulin signalling pathway (Garnovskaya et al., Reference Garnovskaya, Mukhin, Vlasova and Raymond2003; Zhou & Baltz, Reference Zhou and Baltz2013; Xu et al., Reference Xu, Zhou, Meredith and Baltz2017). However, this mechanism only accounts for a portion of NHE1 activation and is not active in all cell types examined (Garnovskaya et al., Reference Garnovskaya, Mukhin, Vlasova and Raymond2003; Hoffmann et al., Reference Hoffmann, Lambert and Pedersen2009; Xu et al., Reference Xu, Zhou, Meredith and Baltz2017) including 1-cell mouse embryos (Xu et al., Reference Xu, Zhou, Meredith and Baltz2017). While the observation that generally inhibiting tyrosine kinase activity with genistein completely eliminates NHE1 activation (Zhou & Baltz, Reference Zhou and Baltz2013; Xu et al., Reference Xu, Zhou, Meredith and Baltz2017) implicates at least one other tyrosine kinase in addition to JAK2, the identities of this putative tyrosine kinase and other components of the signalling pathway remain unknown.
Despite our findings here, FAK is present and is likely to have roles in early embryos, as it has been shown that FAK localized in the egg cortex becomes activated upon sperm−egg binding and fusion (McGinnis et al., Reference McGinnis, Luo and Kinsey2013). FAK may also still play some role in the overall cellular response to decreased cell volume or increased tonicity independent of NHE1. FAK becomes phosphorylated in a number of cell types upon a cell volume decrease. This has been reported to involve phosphorylation of Y397 that eventually returns to baseline as well as phosphorylation of other tyrosine residues (e.g., Y576/577, Y861) which are longer lived (Lunn & Rozengurt, Reference Lunn and Rozengurt2004; Lunn et al., Reference Lunn, Jacamo and Rozengurt2007; Rasmussen et al., Reference Rasmussen, Muller, Jorgensen, Pedersen and Hoffmann2015). It has been shown that longer lived FAK phosphorylation protects cells from the long-term effects of increased osmolarity by inducing anti-apoptotic pathways (Lunn et al., Reference Lunn, Jacamo and Rozengurt2007). Therefore, while FAK may not have a role in mediating the acute recovery from perturbed cell volume, its longer-term phosphorylation may be involved in survival under conditions of chronic hypertonic stress. This could potentially be of importance to early embryos, which are subjected to developmental arrest when cell volume regulation is perturbed (Baltz & Zhou, Reference Baltz and Zhou2012), but this remains to be investigated.
Financial support
This work was supported by the Canadian Institutes of Health Research (grant nos. MOP115102, PJT152991).
Conflicts of interest
None.
Ethical standards
The authors assert that all procedures contributing to this work comply with the ethical standards of the relevant national and institutional guides on the care and use of laboratory animals. The ACC of the University of Ottawa approved all animal protocols, which conform to Canadian Council on Animal Care standards.