


Introduction
Currently, much is known about public pension dynamics in Canada. Cross-nationally, Canada’s public pension system is lauded as a success story for its low cost and its ability to provide many Canadians with an adequate retirement income base (Banting & Myles, Reference Banting and Myles2013; LaRochelle-Côté, Myles, & Picot, Reference LaRochelle-Côté, Myles and Picot2008; Myles, Reference Myles2000a). However, residency requirements mean that Canada’s public pensions favour the native-born and more established (longer-term) immigrants, leading to a greater reliance on private sources of income for newer Canadians. Yet here, too, immigrants face significant disadvantage. Data show that immigrants in Canada overall earn less than Canada’s native-born throughout their working years and disproportionately face barriers in accessing “good” jobs with strong employer pensions (Curtis & McMullin, Reference Curtis and McMullin2016). This situation prohibits immigrants’ ability to save privately for retirement, compounding disparities with the native-born in overall retirement savings.
Although new research has drawn attention to an increasing reliance on certain private pension platforms (i.e., employer pensions) for many Canadians since the mid-1990s (e.g., Curtis & McMullin, Reference Curtis and McMullin2017; Crossley & Spencer, Reference Crossley and Spencer2008; Drolet & Morissette, Reference Drolet and Morissette2015), at present, relatively little is known about disparities between native-born and immigrants in this domain. With this article we seek to fill this gap, examining private pension income in Canada for the native-born and successive waves of immigrants from 1991 to 2011 using five cycles of Canadian census data. We find that the success of Canada’s public pension system has overshadowed specific inequities that exist in private pension access, particularly for newer waves of immigrants and women in Canada.
Our data show that income from personal savings plans has declined for both native-born and immigrant Canadians (men and women) over two decades. However, native-born and immigrant men with 40-plus years of residency consistently earned more personal savings income than women or more recent immigrant cohorts, despite the overall decline. The story is very different, however, when it comes to employer pensions. On average, since 1991, native-born Canadian men experienced major gains in employer pension income. Canadian immigrant men with residency of 40-plus years also gained ground during this period. Conversely, all other cohorts’ income either remained stable, or declined, suggesting that native-born men were unequally rewarded with “good” jobs with strong pension benefits. The result has been growing savings disparities between immigrant and native-born seniors, often compounded by continued gender inequities in private pension savings. Ultimately, these results point to troubling income inequality trends for elderly Canadians and, in particular, for newer waves of immigrants and women.
Immigrant Inequality in Canada
Considerable research demonstrates an income disadvantage for Canadian immigrants over the life course (e.g., Kaida & Boyd, Reference Kaida and Boyd2011; Ng, Lai, & Rudner, Reference Ng, Lai, Rudner, Orpana and Ali2012; Preston et al., Reference Preston, Weiser, King, Mandell, Kim, Luxton and Kilbride2014). Immigrants’ income inequality is attributed to a wide variety of often overlapping individual and institutional-level factors, including migration histories, personal attributes and family arrangements, discrimination, and disrupted employment trajectories (Frances & Tator, Reference Frances and Tator2000; Goldring & Landolt, Reference Goldring and Landolt2011; Good Gingrich & Lightman, 2015). Combined, these factors result in a lack of income parity between native-born and immigrant Canadians, especially disadvantaging female and racialized minority immigrants, in part because these groups are disproportionately excluded from the “good” jobs that are accompanied by strong pension plan benefits (Marier & Skinner, Reference Marier and Skinner2008; Preston et al., Reference Preston, Kim, Hudyma, Mandell, Luxton and Hemphill2012). Inevitably, these labour market disparities directly impact immigrants’ ability to build personal savings for retirement.
It is well documented that immigrants have higher average levels of education than the native-born due to the stringent requirements of Canada’s immigration system, which targets individuals with relevant work experience, official language proficiency, and higher education. Yet, these qualifications often do not translate into more secure or higher paying jobs upon resettlement in Canada (Boyd & Thomas, Reference Boyd and Thomas2001; Ng et al., Reference Ng, Lai, Rudner, Orpana and Ali2012; Wald & Fang, Reference Wald and Fang2008). Rather, immigrants are among those who fill the lowest paying jobs, experience unusually high unemployment rates, suffer more negative impacts of a recession, and are not likely to catch up financially to their Canadian-born comparators in their working life (Aydemir & Skuterud, Reference Aydemir and Skuterud2005; Galabuzi & Teelucksingh, Reference Galabuzi and Teelucksingh2010; Javdani & Pendakur, Reference Javdani and Pendakur2014; Picot & Sweetman, Reference Picot and Sweetman2012). Mismatch between educational attainment and the occupation of employment for immigrants (in part due to the privileging of “Canadian work experience”) has led to widespread government and media attention that has focused, for example, on immigrant taxi drivers in Canada who hold PhDs (Imai, Stacey, & Warman, Reference Imai, Stacey and Warman2014; Xu, Reference Xu2012).
Length of residency in Canada necessarily influences the number of years an immigrant can partake in the Canadian labour market, as well as their eligibility for government pension benefits. However, a lack of recognition of foreign experience and credentials, along with language difficulties, are also key factors associated with reduced lifetime earnings for immigrants (Block, Galabuzi, & Weiss, Reference Block, Galabuzi and Weiss2014; Boyd & Cao, Reference Boyd and Cao2009; Guo, Reference Guo2013a). Bonikowska, Riddell, and Green (Reference Bonikowska, Riddell and Green2008), for example, reported that both foreign-acquired education and work experience are associated with lower returns for Canadian employment.
A result of immigrants’ labour market exclusion is that many foreign-born are located in precarious or informal segments of the Canadian labour force, where earnings and savings capacity are demonstrably lower (Noack & Vosko, Reference Noack and Vosko2012; Reitz, Reference Reitz and Triadafilopoulos2013; Vosko, Reference Vosko2009). In particular, racialized and female immigrants in Canada disproportionately hold jobs that are temporary, part-time, nonunionized, and/or outside the public sector (Cranford, Reference Cranford2012; Cranford & Vosko, Reference Cranford, Vosko and Vosko2006; Gazso, Reference Gazso2004). Thus, dynamics of race and gender often create additional barriers for immigrants in Canada’s labour market, leading to compounding challenges in building adequate savings for their retirement (Aydemir, Reference Aydemir2011; Lightman & Good Gingrich, Reference Lightman and Good Gingrich2012).
In tandem with the challenges many immigrants face in achieving “standard employment” (characterized by full-year, full-time, permanent work, typically on the employer’s premises, enjoying statutory benefits and entitlements) (see Vosko, Zukewich, & Cranford, Reference Vosko, Zukewich and Cranford2003), some immigrants send ongoing remittances to family members living abroad, thereby reducing their life course savings (Houle & Schellenberg, Reference Houle and Schellenberg2008; Patel, Reference Patel, Satzewich and Wong2006; Stewart et al., Reference Stewart, Neufeld, Harrison, Spitzer, Hughes and Makwarimba2006). Shooshtari et al. (Reference Shooshtari, Harvey, Ferguson, Heinonen and Khan2014), for example, found that remittance sending has significant effects on Filipino immigrants’ housing and living conditions in Canada; remitters are less likely than non-remitters to own their own home, controlling for age, sex, family income, and entry class. As well, some immigrants help aging family members migrate to Canada, often supporting them financially while they themselves attempt to socially and economically integrate (Preston et al., Reference Preston, Weiser, King, Mandell, Kim, Luxton and Kilbride2014).
Public Pension Inequality
Overall, Canada’s public pension system is highly regarded for its role in reducing senior poverty. According to Banting and Myles (Reference Banting and Myles2013), old age poverty rates are at approximately 7 per cent and are among the lowest of OECD nations, on par with Scandinavia where levels of spending per capita are much higher. Canada’s public pension system comprises three main components: (1) Old Age Security (OAS), a non-contributory pension provided to any Canadian citizen or legal resident aged 65 or older who has lived in Canada for 10 years or more after age 18; (2) the Guaranteed Income Supplement (GIS), a supplement to OAS for recipients with limited or no other income; and (3) the earnings-related Canada/Quebec Pension Plan (C/QPP), which is awarded to people who have contributed through employment deductions over their life course.
Taken together, these three policies provide the majority of Canadians with an adequate retirement income base, close to or just above the poverty line (Curtis & McMullin, Reference Curtis and McMullin2017; Curtis, Dong, Lightman, & Parbst, in press). However, many immigrants cannot access Canada’s public pension system in full. The residency requirements for OAS (and thus also GIS) are prohibitive to some, with full benefits received only after 40 years in Canada (Gazso, Reference Gazso2005). C/QPP is based on employer/employee contributions that reflect one’s level of income (i.e., higher earners have larger contributions). Thus, older immigrants arriving in Canada after age 50 have a relatively high risk of low income in retirement. This risk is even higher for more recent cohorts of immigrants, and particularly for those arriving from “non-traditional” (i.e., non-Western) countries, who are disproportionately racialized (McDonald & Worswick, Reference McDonald and Worswick2013). However, many older immigrants live with large extended families and rely on them for financial support, offsetting their low income levels to some extent (see Kaida & Boyd, Reference Kaida and Boyd2011).
Old Age Security
Canada’s Old Age Security (OAS) program, a universal flat benefit, was introduced in 1952, in recognition that many seniors in post-World War II Canada had little or no private savings. The payment was large enough to enable an individual or couple to live in modest, but frugal comfort (Lightman & Lightman, Reference Lightman and Lightman2017). As of 2015, the full payment received by seniors 65 and older was $565 (CAN) per month, up to an income of $72,809. Beyond that, benefits reduced at a rate of 15 per cent; at an income level of $117,194, benefits terminated entirely. Currently, the OAS program covers over 95 per cent of seniors, although fewer actually receive the total cash benefit due to the clawback.
The sole condition for OAS entitlement is a minimum period of residence in Canada. In 1977, residency requirements for OAS were amended so that 10 years of residence would qualify a Canadian immigrant for 10/40ths, or one quarter, of the full benefit. This means that only Canadian immigrants who have been in Canada for 40 years or longer receive full OAS benefits, disqualifying the many newer waves of immigrants. Notably, Canada has International Social Security Agreements that stipulate that immigrants may use periods of residency from their countries of origin to qualify sooner for OAS. However, although close to sixty countries have signed such agreements with Canada, the majority of these countries, to date, are in Europe, disproportionately benefitting older waves of immigrants from “traditional” source countries. Consequently, a high percentage of newer immigrants in Canada are from countries without such agreements, notably including those arriving from countries in Africa or from China Footnote 1 (Government of Canada, 2014; Kaida & Boyd, Reference Kaida and Boyd2011).
General Income Supplement
Canada’s public pension supplement – the General Income Supplement (GIS) – was established in 1966 as an income-tested complement to the OAS program, targeting seniors in low income. In 2015, a single person with no private pension earned $723 per month from the GIS. The maximum total benefit for OAS and GIS combined was $1,343 monthly, or a total annual retirement income of $16,113, well below the Statistics Canada low income cut-off of $23,861 for a single person (Service Canada, 2015). In addition, a smaller program, known as the Allowance, is available to spouses or partners, aged 60 to 64, in households where the other spouse receives the GIS. This program pays just over $1,000 per month to a maximum combined annual income of $31,680, after which it is clawed back (Service Canada, 2015).
The GIS is clawed back severely, to nearly 50 per cent. As of 2015, the maximum monthly payment was $766 and was given only to those with no income other than OAS. This fell to zero at $17,136 for a single individual and at about $23,000 combined income for a couple (depending on their circumstances) (Lightman & Lightman, Reference Lightman and Lightman2017; Human Resources and Skills Development Canada, 2010). Using Statistics Canada data from 1994 and 2004, Marier and Skinner (Reference Marier and Skinner2008) found that elderly women living alone and post-1970 immigrants face the greatest risk of depending on means-tested benefits in old age. Yet, as of 2015, more than one third of OAS recipients received full or partial GIS (Lightman & Lightman, Reference Lightman and Lightman2017).
Canada/Quebec Pension Plan
In addition to OAS/GIS and the Allowance, Canada also has a strong public earnings-related pension plan, the Canada/Quebec Pension Plan (C/QPP). C/QPP, established in 1966, is awarded to people who have contributed through employment deductions over their life course. All employed Canadians are required to contribute, and the first cohort to receive full C/QPP benefits turned 65 in 1976. Funded by employer and employee contributions, the C/QPP was designed to provide a retirement pension equivalent to 25 per cent of a worker’s average lifetime earnings (Baldwin, Reference Baldwin2009; Myles, Reference Myles2000b).
Myles (Reference Myles2000b) argued that the decline of income inequality in Canada from 1980 to 1996 was spurred by the growth of C/QPP benefits. He found that, from 1980 to the early 1990s, C/QPP income nearly tripled, rising from 8 to 20 per cent of the average income of Canadian seniors. Veall (Reference Veall2008) similarly found that the proportion of Canadian seniors with low income dropped from 37 per cent in 1970 to only 6 per cent in 2000. However, Milligan (Reference Milligan2008) attributed the reduction in old age poverty between 1970 and 2000 to the GIS rather than to Q/CPP.
Immigrants experience disadvantage in claiming their C/QPP (as well as OAS/GIS). The full benefit requires 40 years of employment contributions (Marier & Skinner, Reference Marier and Skinner2008). For many immigrants, this is beyond the scope of their working years in Canada, either due to migration to Canada later in their working life or because of various difficulties in accessing stable and well-paying jobs upon resettlement in Canada (Aboubacar & Zhu, Reference Aboubacar and Zhu2013; Guo, Reference Guo2013b; Kaida & Boyd, Reference Kaida and Boyd2011). As well, because Q/CPP contributions fluctuate based on income (i.e., higher earners contribute more), immigrants often contribute less. In 2011, Canada’s immigrants (as a collective) had a median monthly income of $1,489 from C/QPP, while native-born Canadians earned $1,526. Women, too, often experience disrupted employment patterns because of child rearing and other caring responsibilities, which affects their C/QPP earnings potential (Lightman & Lightman, Reference Lightman and Lightman2017; Nichols & Tyyskä, Reference Nichols, Tyyskä, Bauder and Shields2015; Rose, Carrasco, & Charbonneau, Reference Rose, Carrasco and Charboneau1998).
In sum, government spending through OAS entitlements, the means-tested GIS, and the tax-aided C/QPP, are crucial in keeping many seniors out of severe poverty. Yet it is evident that immigrants experience disadvantage in Canada’s public pension system as a result of both residency and employment requirements, reinforcing their dependence on private sources of savings in retirement.
Private Pension Inequality
As of 2000, Myles (Reference Myles2000b) predicted an increase in income inequality in Canada due to greater reliance on private pension plans. Myles forecasted that unequal access to employer-sponsored pension programs and personal registered retirement savings plans would lead to greater economic inequality among seniors. Curtis and McMullin (Reference Curtis and McMullin2017), supporting Myles’ prediction, found that private pension inequality has been extremely high since the 1990s and has remained high with little to no change. For example, the Gini coefficient for private pension income was 0.721 in 1996, 0.708 in 2001, 0.718 in 2006, and 0.709 in 2011. Thus, their data show large disparities in the amount of private pension incomes that retired Canadians have earned since the 1990s, with virtually no movement towards greater equality.
In Canada, private pensions – consisting of Personal Savings Plans (for example, Registered Retirement Plans [RRSPs] and Tax-Free Savings Accounts [TFSAs]) and Employer Pensions (Registered Pension Plans [RPPs]) or Registered Retirement Income Funds [RRIFs]) – are typically held by Canadians with above-average incomes, who are higher educated and work in jobs that fit the “standard employment” model (Vosko et al., Reference Vosko, Zukewich and Cranford2003). Thus, as private pensions have become an increasingly important source of income for many seniors, individuals in precarious work or with disrupted employment trajectories, who are disproportionately immigrants, racialized populations, and/or women, are disadvantaged later in life not only because (in some cases) of the residency requirements tied to public pensions, but also in the domain of private pension savings. Today, together with Q/CPP, the most important tax-assisted programs for seniors are the RPPs, RRSPs, and the relatively new TFSA.
Personal Savings Plans
As of 2015, the maximum annual contribution to a Registered Retirement Savings Plan (RRSP) was $24,930, all of which was deductible from income. Unused contribution eligibility from previous years could be carried forward to future years. However, the regressive impacts of personal savings plans are notable in two distinct ways. First, only those with substantial incomes have the surplus money to put aside $24,930 a year in an RRSP. Thus, most low-income earners cannot take advantage of the tax savings offered by contributing to RRSPs during their working lives. For the tax year 2013, there was approximately $790 billion in unused RRSPs, and the vast majority of this was attributed to low contribution rates by individuals with low and modest incomes. Second, because RRSP contributions are treated as deductions from taxable income, the tax savings for a given RRSP are greater for those in upper income brackets (Lightman & Lightman, Reference Lightman and Lightman2017).
TFSAs are a more recent addition to the stable of tax-aided savings vehicles in Canada. First offered in 2009, they largely operate outside the tax system: Contributions of up to $10,000 annually (as of 2015) are not tax deductible. The account grows over time tax-free and withdrawals are not subject to tax (because tax was already paid on the original contribution). TFSAs have become a very popular form of saving, retirement or otherwise – by 2012, total contributions exceeded those of RRSPs. Kesselman (Reference Kesselman2015) demonstrated that participation in the TFSA program, as for RRSPs, is highly skewed towards upper-income taxpayers. This is hardly surprising since lower-income individuals often do not have surplus savings to put into a TFSA annually, particularly when there is no immediate tax advantage. For tax year 2013, there was about $590 billion in unused TFSA contributions, virtually all of which was due to low participation by the poor. Footnote 2
Employer Pension Plans
In addition to RRSPs, employer-sponsored pensions (Registered Pension Plans) are also of great importance for many seniors. RPPs were first established in 1957 to offer tax assistance for private savings for people employed in paid work, as well as the self-employed. Participation is voluntary for each qualifying individual and contributions are tax deductible, again offering the most benefit to those with the highest incomes. Approximately 40 per cent of Canadian employees are covered by RPPs.
Drolet and Morissette (Reference Drolet and Morissette2015) found that, between 1977 and 2011, the proportion of the overall employed population covered by RPPs declined from 52 per cent to 37 per cent among men, mainly because of a drop in defined benefit (DB) plan coverage. However, among women, RPP coverage increased from 36 per cent to 40 per cent over the same period. Drolet and Morissette (Reference Drolet and Morissette2015) attributed this gender difference to the disproportionate rise of women employed in sectors with higher coverage rates, such as educational services, health and social assistance, and public administration. They also found that university graduates, individuals in larger workplaces, and those with higher hourly pay are far more likely to be covered by DB plans than those without.
Myles (Reference Myles2000a) noted that “the relative status of seniors in any period is a result of what might be called generational overlap” (p. 30). Thus, in examining private pension incomes from 1991 to 2011, it is necessary to consider the time period when these seniors were in their “prime” working years. For example, much of the increasing reliance on RPPs from 1991 to 2011 can be attributed to women entering “good” jobs in the 1970s and 1980s; by comparison, people who were retired in 1991 were 30 to 40 years old in the years 1956 to 1966, when female labour force participation was significantly lower and employer pensions had not yet reached maturation.
Building on our aforementioned review of the inequities between immigrants and the native-born in public pension access in Canada today, we now turn our attention specifically to private pension incomes over time. To our knowledge, no other Canadian research exists that explores private pension dynamics of native-born and immigrant Canadians longitudinally from 1991 using the most recent Canadian census data available. Ultimately, we argue that the success of Canada’s public system to reduce poverty has overshadowed private pension inequality, particularly for newer waves of immigrants and women. The following sections detail our research questions, methodology, and results.
Research Questions
Our research was guided by three main questions, informed by our prior review of the literature:
-
(1) It is well established that Canadian immigrants, particularly those in the first generation (the focus of this article), encounter difficulties earning high wages relative to the native-born. Given this disparity, we wonder, How does a life course of earnings inequality affect immigrants’ ability to build private retirement savings? Do immigrants (both male and female) with longer periods of residency eventually reach parity with Canada’s native-born?
-
(2) Since the 1990s, coverage for employer-based private pensions has declined for men and remained relatively stable for women. Yet, the amounts received by those with RPP access have increased rapidly. Have RPP changes impacted native-born and immigrant Canadians equally? Over time, has this contributed to or diminished the retirement savings disparity between native-born and immigrant Canadians?
-
(3) Lastly, we seek to measure gender differences in private pension income. Are gender inequalities more pronounced for private savings or for employer pensions, if at all? As women’s labour market participation increased in the 1970s and 1980s – time periods in which many individuals in our sample were in their prime working years – were women able to gain parity with men?
Data
Our study used microdata from Canada’s National Census spanning a 20-year period. Data was collected every five years for the two decades spanning 1991 to 2011, providing five waves for analysis. The census is a nationally representative and mandatory social survey Footnote 3 and is Canada’s most precise data resource on economic and ethnocultural characteristics. Each survey wave is drawn from a roughly 2 per cent sample of the Canadian population. We limited our data to retired Canadians, that is, those over the age of 64 who were not participating in the labour force. After missing cases were eliminated, our samples for each census period were 72,951 (1991), 75,267 (1996), 81,646 (2001), 88,361 (2006) and 92,805 (2011) for a total analytical sample of 411,030 individuals.
Dependent Variables
The Canadian Census includes two measures of private pension retirement income: employer pensions and investment income. Employer pensions refer to all income received from a Registered Retirement Income Fund (RRIF) or a Registered Retirement Savings Plan (RRSP) as a result of being a member of a workplace pension plan. Investment income refers to income received from deposits in banks, as well as interest on savings certificates, bonds and debentures, and all dividends from both Canadian and foreign corporate stocks and mutual funds. This measure includes investment income from Canadian and foreign sources. Neither measure includes lump sum benefits. Since our analysis pools income data from five census periods, we performed an income adjustment according to inflation to standardize all incomes to 2011 dollars.
Independent and Control Variables
Our focus is primarily on the relationship between length of residency in Canada and private pension income over time. To measure length of residency, we created a four-category variable: (1) 40-plus-year immigrants (the reference category) or “established immigrants”, (2) 26-to-39-year immigrants, (3) 10-to-25-year immigrants, and (4) 0-to-9-year immigrants or “recent immigrants”. Given the composition of immigrants in Canada, we controlled for visible-minority status and official language knowledge. Due to data limitations in the 1991 census, we were only able to include a dichotomous measure of visible-minority status coded as (1) White and (2) visible minority. Knowledge of official languages was coded as (1) English (the reference category), (2) French, (3) English and French, and (4) neither official language.
Several other control variables were also included in our analysis. As our intention was to examine dynamics of gender (as well as immigration) in private pension income, we coded gender into a dichotomous variable to subset our data at various stages of analyses. In addition, education was coded into three categories: (1) high school or less (the reference category), (2) community college, and (3) university. Footnote 4 We also controlled for marital status, coded as (1) married and cohabiting (the reference category), (2) widowed, (3) divorced, and (4) single. Age was included as a continuous variable.
Results
Descriptive Data
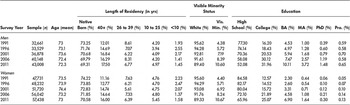
Our analysis begins with discussion of important descriptive trends in Canada from 1991 to 2011. Table 1 displays demographic information on age, length of residency, visible-minority status, and levels of education for all retired men and women in our sample. Beginning with men, for all census periods the average age is approximately 73, declining slightly in the more recent census periods. For length of residency, from 1991 to 2011 the composition of our sample shifts towards greater numbers of Canadian immigrants. For example, native-born Canadian men declined from 73.25 per cent of the population of males in 1991 to 69.31 per cent in 2011. Canadian immigrant men with 40-plus years of residency increased from 12.01 per cent of the population in 1991 to 17.50 per cent in 2011 – the largest increase of all residency categories. For Canadian immigrant men with 26 to 39 years of residency, the proportion declines – representing 8.61 per cent of the population in 1991 and 6.77 per cent in 2011 – whereas the remaining immigrant categories (10 to 25 and <10 years) remain relatively constant at about 4 per cent and 1 per cent of the male population respectively.
Descriptive information for independent and control variables, 1991–2011

Source: Canadian Census Microdata, 1991–2011, authors’ analysis
Table 1 also reports trends in visible-minority status. For men, the proportion of White Canadians declined from 95.62 per cent in 1991 to 89.40 per cent in 2011. Thus, visible minorities increased from 4.38 per cent of the population in 1991 to 10.6 per cent in 2011. These proportions are nearly identical for women. In terms of educational patterns, Table 1 demonstrates a trend of increasing average levels of education in Canada for men over time, as expected. The most notable decline is the proportion of men who hold a high school diploma or less, falling from 77.3 per cent of the population in 1991 to 52.08 per cent in 2011. The largest increase is seen for men with college degrees, rising from only 16.2 per cent in 1991 to 31.96 per cent in 2011.
Table 1 also shows equivalent trends for women. Overall, the patterns are very similar to those for men. The proportion of native-born women declined from 74.22 per cent of the female population in 1991 to 70.58 per cent in 2011. Similar to men, immigrant women with 40-plus years of residency increased from 11.16 per cent of the population of females in 1991 to 16 per cent in 2011, and women with 26 to 39 years of residency declined from 7.63 per cent of the female population in 1991 to 6.39 per cent in 2011. Women in all other residency categories remain relatively stable. However, women do substantially differ from men in their level of educational attainment. Although the overall trend is in the same direction – that is, fewer women held only a high school diploma in 2011 than in 1991 – the shift towards higher education is much less pronounced. For example, 84.50 per cent of women held high school diplomas or less in 1991, falling to 65.96 per cent in 2011 (7.20% higher than men in 1991 and 13.88% higher in 2011). The proportion of women who held a college or bachelor’s degree also increases over time. In 1991, 12.57 per cent of women held a college degree and 2.30 per cent held a bachelor’s degree. By 2011 these numbers increased to 25.07 per cent and 6.90 per cent respectively.
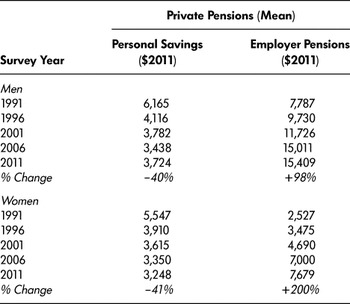
Next, Table 2 displays descriptive information for our dependent variables, without any distinction based on immigration status or length of residency. Beginning with personal savings (e.g., RRIFs and RRSPs), for both men and women the average amount of annual income declined over time. The average retired Canadian male earned $6,165 in private income in 1991, but only $3,724 in 2011 (a 40% decline). Women saw a similar decline, from $5,547 in 1991 to $3,248 in 2011 (a 41% decline). For both men and women, however, average income from employer pensions increased over time. For men, average employer pension rose from $7,787 in 1991 to $15,409 in 2011 (a 98% increase). Women saw an even greater percentage increase in employer pension income, yet the substantive amount is smaller. In 1991 the average woman earned $2,527 in employer pensions, while in 2011 this amount increased to $7,679 (over a 200% increase). Although these values present the overall Canadian trend, we note that they are somewhat misleading given that all men and all women are aggregated into each census period.
Descriptive information for economic variables, 1991–2011

Source: Canadian Census Microdata, 1991–2011, authors’ analysis
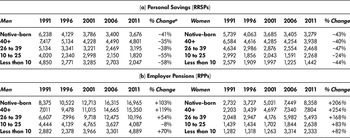
Table 3 takes the preliminary analysis in Table 2 one step further by presenting mean retirement income scores by gender and length of residency from 1991 to 2011. Although the values are raw and not subject to control tests, these data allow for some interesting preliminary conclusions. Turning first to patterns of personal savings: in 1991, native-born men earned $7,417 on average in retirement income from personal savings, followed by male immigrants with 40-plus years of residency who earned $6,238, male immigrants with 26 to 39 years of residency who earned $5,134, those with less than 10 years of residency who earned $4,850, and finally, male immigrants with 10 to 25 years of residency who earned the least, at $4,020. However, income from personal savings declined sharply by 2011. Interestingly, these data show that in 2011 male immigrants with 40-plus years of residency earned the most annually from private savings, followed by native-born Canadians, immigrants with 26 to 39 years of residency, immigrants with less than 10 years of residency, and, finally, immigrants with 10 to 25 years of residency ($4,801, $3,676, $3,195, $2,047, and $1,820 respectively). We see a near mirror image for women, with the exception that immigrants with less than 10 years of residency earned the least income from personal savings. Interestingly, by 2011 the income gap for personal savings significantly narrowed for men and women for all residency categories.
Mean private retirement incomes ($ amount) by gender and immigrant length of residency, 1991–2011

Source: Canadian Census Microdata, 1991-2011, authors’ analysis
RPP = Registered Pension Plan
RRSP = Registered Retirement Savings Plan
a The per cent change category was calculated using the following formula ((y2 – y1) / y1)*100. All numbers were rounded to the nearest decimal place.
Table 3 also shows the relationship between employer pensions and length of residency, separated by gender. Overall, women earned much lower annual incomes from employer pensions than men across the time period. From 1991 to 2011, native-born men saw the largest substantive increase in employer pensions (from $8,375 to $16, 965 on average, a 103% increase). Male immigrant Canadians with 40-plus years of residency also saw a large increase (from $7,011 to $15,350, a 119% increase). However, other male residency groups saw far fewer gains, both substantively and in terms of percentage change. Surprisingly, by 2011, immigrant Canadians with 10 to 25 years of residency saw a decline in employer income (from $4,444 in 1991 to $4,087 in 2011, an 8% decline). For women, in 2011 the native-born had a mean income from employer pensions of $8,358 (a substantive increase of $5,626 from 1991 and a 206% increase) while women with 40-plus years of residency earned $7,804 (an increase of $5,601 from 1991 and an impressive 254% increase). Women with 26 to 39 years of residency ($5,493 in 2011, a $3,445 increase) and 10 to 25 years of residency ($2,638 in 2011, a $1,199 increase) continued to have very low substantive levels of RPP income, despite large percentage increases. Women with fewer than 10 years of residency experienced the least employer pension income gains: by 2011, they earned on average $2,333, an increase of only $1,050 from 1991.
Overall, Table 3 illustrates several important national trends. First, as length of residency increases, so too does private pension income. Also, with the exception of men’s personal savings, Canada’s native-born tend to earn the most income from all private pension sources. In addition, for each measure of income, men (at all stages of residency) earn much more than their female counterparts, although women had greater increases in employer pension income in terms of percentage change for all residency categories. Lastly, there has been a general trend in Canada where annual income from personal savings has declined while annual income from employer pensions has risen over the two-decade period examined. Building on these findings, we next provide results from more rigorous statistical tests, evaluating private pension income patterns from ordinary least squares (OLS) models.
Regression Models
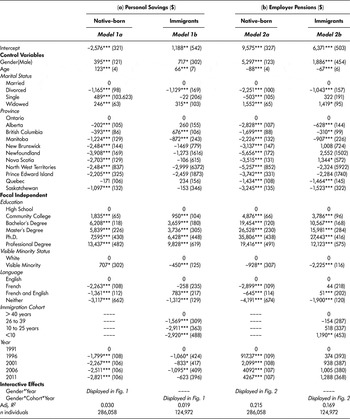
Table 4 presents four OLS models predicting private pension incomes – (a) for personal savings and (b) for employer pensions – for native-born Canadians (Models 1a and 2a) and Canadian immigrants (Models 1b and 2b). Footnote 5 Each of these models control for gender, age, marital status, province, and year (given that our cross-sectional data is pooled from five time periods in Canadian history). Footnote 6 We begin by comparing Model 1a (native-born) and Model 1b (immigrants), which predict personal savings pension income. Men and older seniors have marginally higher private savings for both native-born and immigrant Canadians. However, immigrants experience a significant disadvantage for their educational credentials for private savings, supporting previous research suggesting a mismatch between educational attainment and the occupation of employment for immigrants (e.g., Li & Li, Reference Li and Li2008; Wald & Fang, Reference Wald and Fang2008). Compared to high school diploma holders, native-born Canadian professionals earn $13,437 more in personal savings, whereas immigrant professionals earn only $9,828 more. This disparity is similar for individuals with PhDs (a $7,595 advantage compared to high school diploma holders for native-born versus $6,428 for immigrants), as well as for MA, bachelor’s, and community college degree holders. Thus, on average, immigrants earn much smaller private pension savings for their education than do Canada’s native-born.
Final ordinary least squares (OLS) models predicting private pension income for (a) personal savings and (b) employer pensions

Perhaps surprisingly, Model 1a shows that visible-minority native-born Canadians earn slightly more income from personal savings ($708 more on average) than White native-born Canadians, controlling for the other factors. However, the reverse is true in Model 1b for immigrant Canadians: visible-minority immigrants earn $450 less than White immigrants. In addition, these models also show strong language effects. In Model 1a, compared to English-only-speaking native-born Canadians, those who speak French ($2,263), French and English ($1,361), or neither official language ($3,117) earn less from personal savings. For immigrants (Model 1b), compared to English-only speakers, those who speak French ($258) or neither official language ($1,312) earn less, while French and English speakers earn $783 more.
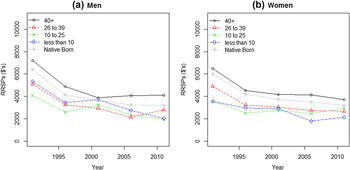
One final piece of evidence from Model 1a and Model 1b is presented in Figure 1. To understand how personal savings incomes have changed for men and women from 1991 to 2011, we derive fitted values for gender by survey year (Model 1a, native-born Canadians) and gender by cohort by survey year (Model 1b, immigrant Canadians) interaction terms. All other variables in these models are set to typical values (i.e., means for quantitative variables and proportions for categorical variables).
Personal savings for (a) men and (b) women according to length of residency, 1991–2011. Fitted values for native-born Canadians are from Model 1a. All variables except gender and year were set to typical values (i.e., means for quantitative variables and proportions for categorical variables). Fitted values for immigrants are from Model 1b. All variables except length of residency, gender, and year were set to typical values.

Figure 1 visually illustrates how private retirement savings income has changed for men –Panel (a) –and women – Panel (b) – from 1991 to 2011. We present the fitted values from the interaction terms in Model 1a and 1b. Figure 1 shows income changes for native-born Canadians, and Canadian immigrants with 40-plus, 26 to 39, 10 to 25, and less than 10 years of residency. In Panel (a), all immigrant residency cohorts demonstrate a personal retirement savings decline from 1991 to 2011. Interestingly, for each census period, immigrant men with 40-plus years of residency earned the most from private retirement savings. Also noteworthy is the strong stratification of income across immigrant residency cohorts. However, differences in income between these groups do not become more pronounced over time, suggesting that each group lost similar ground from 1991 to 2011. Moving to Panel (b) we see a near mirror image for women: immigrant women with 40-plus years of residency earned the most from personal retirement savings, and every residency cohort experienced an income decline from 1991 to 2011. Yet women in each residency cohort earned slightly less than men. These income differences are not as pronounced as one might expect, however. For example, native-born Canadian men earned on average $3,200 in personal retirement savings in 2011 while women in the same category earned $3,193. This suggests a degree of gender parity in this domain.
Next, we turn to our second set of models in Table 4 predicting employer pensions (RRIFs and RPPs) for native-born Canadians (Model 2a) and immigrant Canadians (Model 2b). As with private savings, these models also show that women earned less than men and that there is an immigrant disadvantage for returns on education in employer pensions. Compared to high school diploma holders, native-born Canadian professionals earned $19,416 more in personal savings, while immigrant professionals earned only $12,123 more. We see similar differences from those with PhDs ($35,806 versus $27,443), as well as those holding MA, bachelor’s, and community college degrees. These data show that immigrants earn much smaller employer pensions for their education than do Canada’s native-born, again supporting prior research demonstrating labour market exclusion from “good” jobs for immigrants in Canada (e.g., Bejan, Reference Bejan2011; Lightman & Good Gingrich, Reference Lightman and Good Gingrich2012; Javdani & Pendakur, Reference Javdani and Pendakur2014).
The findings for visible minorities in Models 2a and 2b are troubling. For both Canada’s native-born and immigrant populations, visible-minority Canadians earn less income ($928 less for native-born and $2,225 less for immigrant populations respectively) in employer pensions than equivalent White Canadians. However, the visible-minority disadvantage is much more pronounced for immigrants (in Model 2b), which takes on added weight given the growing proportion of racialized immigrants coming to Canada. These models also show strong language effects. However, there is no statistically significant difference in employer pension income for English versus French-speaking Canadian immigrants.
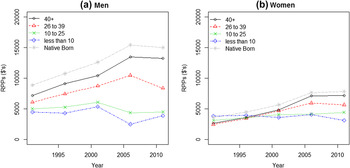
Finally, we turn to the results in Figure 2. Again, we calculate fitted values from the interaction terms in Model 2a (native-born Canadians) and Model 2b (immigrant Canadians). These results illustrate the relationship between residency cohort and employer pensions from 1991 to 2011. These are perhaps the most important findings tied to our central research questions. In Figure 2’s Panel (a), we see that in 1991 native-born Canadian men earned the most private pension income from employer pensions with average incomes of $8,870, followed by 40-plus ($7,195), 26 to 39 ($6,078), 10 to 25 ($5,022), and less than 10 ($4,471) years of residency immigrants. Thus, although employer pension income differences existed in 1991, the gap between each residency cohort is not overly pronounced. However, the story in 2011 is very different. Employer pension incomes for native-born men ($15,005), 40-plus-year residency ($13,214) and 26-to-39-year residency immigrants ($8,372) increased dramatically, while incomes for men in the 10 to 25 and less than 10 residency categories declined to $4,484 and $3,888 respectively. In other words, the employer pension income gap became much more pronounced by 2011, suggesting that income inequality in this regard grew substantially. For example, native-born men (51%), 40-plus-year residency (59%), and 26-to-39-year residency immigrants (32%) experienced notable percentage increases in employer pension incomes from 1991 to 2011. By contrast, 10 to 25 and less than 10-year residency immigrants experienced a percentage decline (–11% and –14% respectively) during this period, thus widening the employer pension income gap.
Employer pensions for (a) men and (b) women according to length of residency, 1991–2011. Fitted values for native-born Canadians are from Model 2a. All variables except gender and year were set to typical values (i.e., means for quantitative variables and proportions for categorical variables). Fitted values for immigrants are from Model 2b. All variables except length of residency, gender, and year were set to typical values

Panel (b) in Figure 2 shows the comparable relationship between employer pensions and residency cohort for women from 1991 to 2011. In contrast to men in Panel (a), we see that employer incomes for women were nearly equal across all residency cohorts in 1991. However, at this time, all women (even the native-born) earned lower incomes from employer pensions than the lowest income men (i.e., immigrants with less than 10 years of residency), demonstrating substantial gender inequity. By 2011, however, employer pension income differences by length of residency increased for women – demonstrating growing inequality between native-born and newer cohorts of immigrant women by 2011, similar to men. In 2011, native-born women earned on average $7,840 from employer pensions (a 75% increase from 1991), followed by 40-plus ($7,173, a 93% increase), 26 to 39 ($5,660, a 79% increase), 10 to 25 ($4,424, a 34% increase), and less than 10 years of residency immigrants ($3,092, a decline of 20%). Accordingly, although by 2011 women had made substantial income gains in employer pension income, overall their incomes were still very low compared to men’s, and differences between the native-born and immigrants had increased markedly.
Discussion and Limitations
In this article, we contribute to existing scholarship by offering an in-depth quantitative analysis of private pension income inequality for different waves of immigrants in Canada using census data from 1991 to 2011. Empirically, we provide several pertinent findings. Our first research question queried whether a life course of earnings inequality affects immigrants’ ability to save privately for retirement. To answer this question, we examined private savings disparities between the native-born and successive waves of immigrants to Canada. We found a major divide between the overall private savings of native-born and more “established” (or longer residency) immigrants, on the one hand, and immigrants from more recent cohorts, who overall had substantially lower private savings.
We note that mean private savings for immigrants with 40-plus-years of residency were slightly higher than the native-born for men and women in 2011, with each successive residency cohort earning higher income from personal savings. While this suggests a positive trajectory of financial integration for immigrants over the life course, it is significant that this precludes immigrants who come to Canada later in life. Even more importantly, due to the timing of these data, such “established” immigrants in our sample are far more likely to have arrived to Canada from traditional (e.g., Western) source countries. Thus, immigrants in Canada for 40-plus years are less likely to be visible minorities than newer immigrant cohorts, suggesting an acute and growing racial divide in private savings. As well, controlling for visible-minority status, our regressions demonstrate that immigrants (both male and female) benefit less from education than the native-born, for both private savings and for employer pensions, supporting prior research on immigrant labour market exclusion (e.g., Bejan, Reference Bejan2011; Lightman & Good Gingrich, Reference Lightman and Good Gingrich2012; Javdani & Pendakur, Reference Javdani and Pendakur2014).
Our second research question examined immigrant inequality in employer pension income. Here we note our most troubling findings. Supporting previous research (Crossley & Spencer, Reference Crossley and Spencer2008; Curtis and McMullin, Reference Curtis and McMullin2017; Drolet & Morissette, Reference Drolet and Morissette2015), the data demonstrate that employer pension incomes have overall grown significantly in Canada. Yet, although an income gap between immigrants and the native-born existed in 1991, it grew substantially by 2011. Since 1991, native-born and immigrant men living in Canada for 40-plus years witnessed incredible employer pension gains. However, all other immigrant cohorts, and most women, remained stable or declined during these decades. This reinforces prior findings of labour market exclusion from “good” jobs for newer waves of immigrants (who are disproportionately racialized) and women (e.g. Lightman & Good Gingrich, Reference Lightman and Good Gingrich2012; Javdani & Pendakur, Reference Javdani and Pendakur2014). As well, the data show that, overall, immigrants earn much smaller employer pensions for comparable levels of education than do Canada’s native-born. Figure 2, for example, visually demonstrates this major increase in immigrant inequality in employer pension income for both men and women over time. Here, again, the data show that immigrants are increasingly being excluded from the diminishing number of “good” jobs with strong employer pensions. Recall, for example, that men in the 10 to 25 and less than 10 years of residency categories experienced a percentage decline of 11 per cent and 14 per cent respectively, while native-born men increased their employer pension income by a full 51 per cent from 1991 to 2011.
Finally, in addressing our third research question, which focused on gender differences in private savings, here we report a modicum of positive news. We note that gender private savings income differences are not as pronounced as might have been expected, suggesting growing gender parity in this domain. Specifically, in terms of private savings, we note that after controlling for demographic factors, both men and women earned about the same amount of income from personal savings across each residency cohort from 1991 to 2011.
However, the sharp private pension income decline for both men and women during these two decades suggests that most older Canadian workers were adversely affected by the economic conditions they experienced during their working years. Some of these conditions include the recession in the 1980s, which impacted those with “standard employment” most; at the time these individuals were disproportionately men. In addition, the time period under analysis saw fluctuating unemployment rates, low earnings, rising debt, and the rise of precarious working conditions (Lightman & Lightman, Reference Lightman and Lightman2017; Vosko et al., Reference Vosko, Zukewich and Cranford2003; Yalnizyan, Reference Yalnizyan2010). These factors surely inhibited Canadians from saving privately for their retirement. Given current labour market trends, we believe that private savings will continue to decline for all residency cohorts, male and female, in the years to come (Crossley & Spencer, Reference Crossley and Spencer2008; Drolet & Morissette, Reference Drolet and Morissette2015; Marier & Skinner, Reference Marier and Skinner2008).
In terms of employer pensions, however, we find that in 1991 all women (immigrant and native-born) earned lower incomes from employer pensions than the lowest-income-earning men (i.e., recent immigrants with less than 10 years of residency). By 2011, however, women substantially increased their average share of incomes from employer pensions. According to national Canadian statistics, the proportion of women with employer pensions is rising and even surpassing men (Drolet & Morissette, Reference Drolet and Morissette2015; Milligan, Reference Milligan2015). This is because more women now work in sectors with higher coverage rates: for example, education, health care, social assistance, and public administration (Anderson & Hughes, Reference Anderson and Hughes2010; Lightman, Reference Lightman2016). Of course, this does not guarantee a narrowing of the gender pay gap in the coming years: Employed men, although their employer pension coverage may be declining, still earn higher wages in many sectors, which ultimately increases their income from employer pensions (Boudarbat & Connolly, Reference Boudarbat and Connolly2013; Drolet & Mumford, Reference Drolet and Mumford2012). As well, we note that this increase in employer pension income was not experienced by all women equally, given that employer pension earnings were stagnant for the most recent female immigrant cohorts.
We hasten to note that our findings are subject to four important limitations. First, our sample included only retired Canadians above the age of 64. Thus, elderly individuals who were currently in the labour market were excluded from our analysis. In doing so, it is possible that more affluent Canadian immigrants were excluded from our sample (i.e., those earning high incomes in the labour market who chose not to retire). On the other hand, one might argue that by excluding working Canadians we are in fact underreporting levels of income inequality, as it is also possible that people who chose to work past the standard retirement age did so out of economic necessity rather than affluence. A second major limitation of our findings is the use of a dichotomous variable for visible minority status in Canada. The data did not allow us to examine the considerable variation in private savings within visible minority groupings. Similarly, as a third limitation, our data do not distinguish between different entry categories of immigrants. Thus, it masks important economic variations between economic immigrants and those who arrive via family reunification or refugee categories (Elrick & Lightman, Reference Elrick and Lightman2016; Strang & Ager, Reference Strang and Ager2010).
Finally, a fourth limitation is that our data did not control for whether older immigrants have pension income from their sending countries. For example, in the United States, an individual need work for only 10 years to be eligible for Social Security benefits. The retirement income for immigrants who are entitled to benefits from another country, and specifically those who are highly skilled or wealthier, may offset to some degree the reported divisions in private savings between native-born and immigrant Canadians. However, this situation is less likely for immigrants coming from poorer nations and those from “non-traditional” source countries. Thus, future research on private pension income inequality in Canada should consider whether immigrants are more or less likely than the native-born to work after retirement age, account for source country social security benefits, and examine differences between visible minority groups and entry categories of immigrants.
In addition to these data limitations, we note that there is also a need for greater understanding of the role of the second-plus generation in acting as financial caregivers for elderly immigrant parents. However, to our knowledge, no quantitative and longitudinal data set exists in Canada at present that would provide insight into these questions. Lastly, we must also reflect on the impact of home ownership for private pensions. Most working and middle-class Canadians have more equity in real estate than they do in personal or employer pensions. It is possible that taking equity from home ownership into account would reduce (perhaps substantially) the levels of private pension inequality shown in our analysis. Yet, although the census includes a question on home ownership, it does not give sufficient information on how much equity Canadians have built from their mortgage payments. Considering that most new immigrants face strong challenges when integrating into the labour market after immigration, we find it unlikely that newer immigrants would be candidates for home ownership soon after their arrival to Canada, especially given rising housing prices in major urban centres. However, we must leave these questions for future research using a different data source.
Conclusions and Policy Implications
Overall, our data demonstrate ongoing divisions in private savings in Canada based on nativity and race. This reinforces prior findings of the undervaluing of foreign-acquired education and work experience, as well as the disproportionate representation of visible minority and female immigrants in precarious sectors of the labour market (Bonikowska et al., Reference Bonikowska, Riddell and Green2008; Lightman & Good Gingrich, Reference Lightman and Good Gingrich2012; Pendakur & Pendakur, Reference Pendakur and Pendakur2011). Thus, in future, there is a need to ensure that “good” jobs with strong employer pensions are distributed equally and impartially across Canada’s diverse populations. As well, we join with the National Advisory Council on Aging (2005) in advocating for the need for accessible education, skills upgrading, vocational retraining and rehabilitation, and job placements for older immigrant adults, as well as free English or French language classes designed with this population in mind.
Our research underscores the importance of expanding provincial and federal-level pension policies. Several Canadian provinces have tabled plans to expand their employer/employee pension contribution scheme. As well, our results reinforce the importance of making Old Age Security benefits a universal right for Canada’s immigrants, regardless of residency. Our data show just how disadvantaged newer immigrants are, and particularly women, when it comes to accumulating income from various private pension sources. Making OAS a citizenship right would substantially increase the retirement income of older Canadian immigrants.
Finally, we conclude by reflecting on the importance of social policy and the welfare state in modern society. Most welfare states have witnessed “an accelerating process [of] ‘risk privatization,’ in which stable social policies have come to cover a declining portion of the salient risks faced by citizens” (Hacker, Reference Hacker2004, pp. 243–244). Based on our data, we argue that government initiatives remain essential to combating senior poverty, but that they must be updated to meet the needs of the 21st century populace, alongside the changing structure of labour market inequality. We cannot presume the availability and superiority of family and voluntary resources for seniors to offset declines in government spending. It is a dangerous strategy to assign private responsibility for aging populations. Instead, as a society we must ensure that seniors, and especially those who are among the most vulnerable, including women and racialized populations, have the means to acquire an adequate and stable retirement income base both now and in future.