I. INTRODUCTION
Positive temperature coefficient of resistance (PTC) thermistors, based on polycrystalline n-type BaTiO3 (BT), show a large reproducible increase in grain boundary resistivity, just above the Curie temperature T C,Reference Heywang1,Reference Jonker2 also referred to as the switch temperature T S.3 This behavior is exploited in a variety of applications, including current surge protection devices, self-regulating heater elements, and temperature/current sensors.Reference Huybrechts, Ishikazi and Takata4 For high temperature applications above 130 °C, an isovalent A-site substitution of Pb2+ (added as PbTiO3 for which T C = 490 °C) for Ba2+ is conventionally used.Reference Kuwabara and Kumamoto5 However, Pb toxicity and Pb poisoning are among the most common health-related occupational and environmental hazards, so Pb-bearing components are being phased out in the manufacture of electronic devices.6 Recently, (1 − x/100)BaTiO3−(x/100)(Bi1/2Na1/2)TiO3 solid solutions have been proposed as a promising candidate for high T C Pb-free PTC devices.Reference Takeda, Shimada, Katsuyama and Shiosaki7–Reference Xiang, Takeda and Shiosaki9 This is because T C for (Bi1/2Na1/2)TiO3 is 320 °C. The resistivity jump above T C is associated with development of a double Schottky barrier (DSB), formed from a two-dimensional layer of segregated 3d transition metal acceptors (V, Cr, Fe, or Mn)Reference Ihring10 or adsorbed O2Reference Heywang1,Reference Jonker2 at the grain boundaries. Recent conductive mode (CM) microscopy studies, based on localized R–T measurements of BT-based PTC thermistors, have reported variations in the magnitude and a form of the PTC responseReference Kuwabara, Morimo and Matsunaga11 along with a diversity of grain boundary electrical structures.Reference Seaton and Leach12 Such variations have been associated with inhomogeneous dopant segregation and differences in interface misorientations.Reference Hayashi, Yamamoto and Sakuma13
CM microscopy is used to study local conductivity, grain boundary electrical activity, and band structures of polycrystalline semiconductors and electroceramics.Reference Russell and Leach14−Reference Leach16 The information it provides complements techniques like impedance spectroscopy (IS).Reference Seaton and Leach12 Three forms of CM signal contrast have been reported that are sensitive to the electrical properties of the electroceramic. These are: (i) resistive contrast arising from specimen acting as a current divider for the incident electron beam traveling to earth. A local resistance variation leads to signal discontinuity and a step contrast within the image,Reference Russell and Leach14 (ii) β-conductivity contrast arising from localized injection of mobile charge carriers by the electron beam, resulting in an enhanced local conductivity under voltage bias,Reference Russell and Leach15 and (iii) electron beam-induced current (EBIC) contrast arising from separation and collection of beam generated electron–hole pairs by the depletion field on either side of a charged grain boundary.Reference Seaton and Leach12,Reference Leach16
In the present contribution, the suitability of (Bi1/2K1/2)TiO3 (BKT)–BT solid solutions as a candidate for Pb-free PTC devices with a higher T C than that of the BT-based system has been investigated. For BKT, T C = 380 °C,Reference Buhrer17 which is higher than that of BNT. The synthesis and bulk low-field electrical properties of (1 − x/100)BaTiO3–(x/100)(Bi1/2K1/2)TiO3 PTC system are reported along with an analysis of the electrical structures present at individual grain boundaries using hot-stage CM microscopy.
II. EXPERIMENTAL
A. Materials synthesis
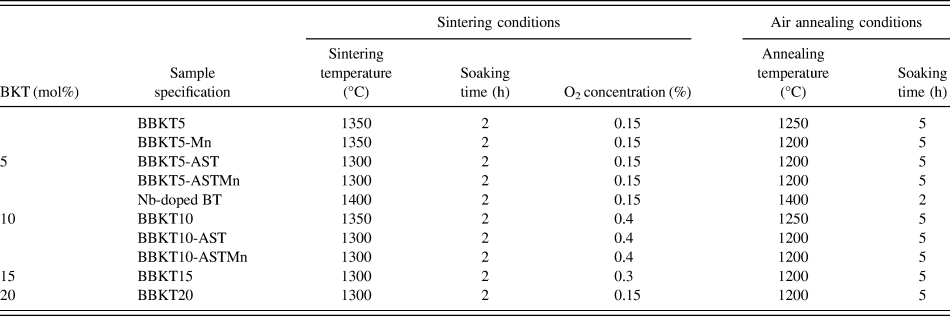
Ceramics in the system (1 − x/100)BaTiO3–(x/100)(Bi1/2K1/2)TiO3 (termed BBKTx, where x represents the mol% of BKT in solid solution with BT) were synthesized using a conventional solid-state ceramic fabrication technique. 99.99% pure powders of BaCO3 (Rare Metallic Co., Ltd., Chiyoda-ku, Tokyo, Japan), TiO2 (Mitsuwa Chemical Co., Ltd., Hiratsuka-shi, Kanagawa-ken, Japan), K2CO3 (Rare Metallic Co., Ltd.), and 99.999% pure Bi2O3 (Rare Metallic Co., Ltd.) were used as starting materials. Stoichiometric amounts of oxides and carbonates with x = 5–90 were weighed, mixed with acetone to form a thin slurry, and milled for 10 h with yttrium-stabilized zirconia (YSZ) balls. The powders were then dried at 100 °C for 10 h and calcined at 800 °C or 1000 °C for 2 h. The powders were remilled for 20 h, dried, and uniaxially pressed at 190 MPa into disks of 13 mm diameter × 1 mm thickness. Pellets were sintered at 1290–1320 °C for 2 h in air to form a series of dielectric ceramics. PTC materials were then prepared for x = 5, 10, 15, and 20 with additions of either, or both of, 5 mol% of Al2O3:SiO2:TiO2 (AST in the molar ratio 4:9:3) or 0.1 wt% MnCO3 (Rare Metallic Co., Ltd.). These samples were termed BBKTx, BBKTx-Mn, BBKTx-AST, and BBKTx-ASTMn according to the mol% BKT and the presence of Mn and/or AST additions (Table I). Green pellets were sintered at 1300–1350 °C for 2 h in flowing N2 and subsequently annealed in air at 1200–1250 °C for 5 h, which produced PTC ceramics. A donor-doped BT-based composition BaTi0.999Nb0.001TiO3 was also prepared by sintering in flowing N2 at 1400 °C for 2 h followed by annealing in air at 1400 °C for 2 h.
Summary of sintering and postsintering treatment schedules for BBKTx-based PTC ceramics.

B. Measurements
Phase identification was carried out by x-ray diffraction (XRD, M18XHFVA, MAC Science Co., Ltd.). Sample densities were measured using the Archimedes method with distilled water as the immersion medium. Microstructural characterization was carried out by scanning electron microscopy (SEM, SM-300, TOPCON Co., Ltd., Itabashi-ku, Tokyo, Japan) using secondary electron (SE) and backscattered electron (BSE) modes of imaging.
For electrical measurements, In-Ga eutectic alloy was applied to both polished surfaces of the ceramics as electrodes. Dielectric properties, including dielectric constant (εs), loss tangent (tanδ), and impedance (Z*) measurements, were carried out from room temperature (RT) to 500 °C over the frequency range of 100 Hz–1.5 MHz using an impedance analyzer (Agilent HP4194A, Agilent Technology, Co., Ltd., Hachioji, Tokyo, Japan). Temperature-dependent bulk resistivity (ρ(T)) was measured using a digital resistance meter (R8340, ADVANTEST Co., Ltd., Chiyoda-ku, Tokyo, Japan). For pyroelectric measurements, samples were pooled from RT to 120 °C in a silicone oil bath using a 4–7 kV/cm electric field for 30 min. The pyroelectric coefficient (γ) was calculated from the depolarization current measured from RT to 500 °C at a heating rate of 2 °C/min. Quantitative chemical analysis was carried out using electron probe microanalyzer (EPMA-1610, SHIMADZU Co., Ltd., Nakagyo-ku, Kyoto, Japan) equipped with five wave length dispersive x-ray spectrometer (WDS). WDS composition mapping was carried out over 250 × 250 μm2 area by adopting an acceleration voltage, beam current, beam diameter, and counting time of 15 kV, 10 nA, 1–2 μm, and 20 s, respectively, optimized for the presence of alkali (K) and volatile (Bi) elements. For bulk average quantitative composition analysis, a beam diameter of 100 μm along with a counting time of 500 s were adopted. Under the above conditions, no evaporation of Bi and K was observed. For CM characterization, a sample cross-section was prepared by cutting and polishing in colloidal silica. Pairs of 80 × 80 μm2 Ag(250 nm)/Ti(25 nm) electrodes with 20 and 40 μm interelectrode spacings were deposited using a photolithographic technique. The sample was mounted on a heating stage (GATAN HC1001, GATAN, Abingdon, Oxfordshire, UK) inside a SEM (JSM-6300, JEOL Ltd., Musashino 3-chrome, Akishima, Tokyo, Japan), which was connected to a temperature controller (ITC 5038, Oxford Instruments, Abingdon, Oxfordshire, UK). The CM signals were collected through tungsten probes, controlled by a micromanipulator, and were processed to generate a CM image.
III. RESULTS AND DISCUSSION
A. Structure and dielectric properties BBKTx system
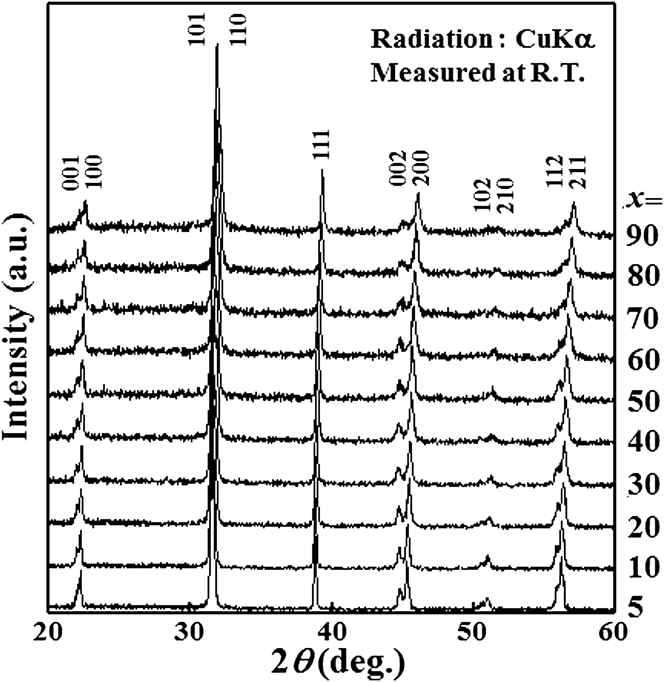
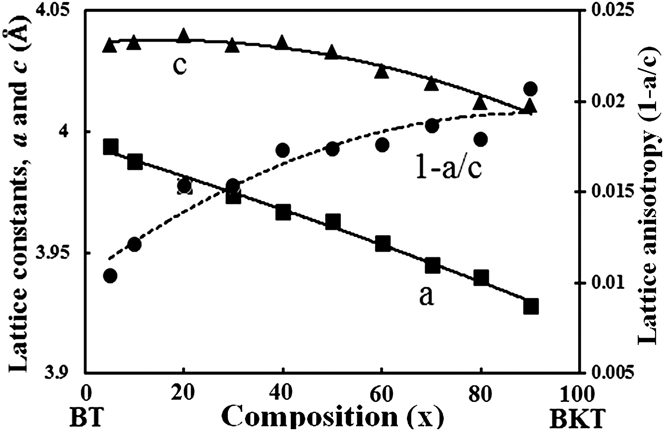
Figure 1 shows RT XRD profiles of dielectric BBKTx in the range of 0 < x ≤ 90. All diffraction peaks were successfully indexed as BaTiO3 (ICCD no. 05-0626) structure. This indicates that BBKTx remains single phase and exhibits a tetragonal symmetry throughout the composition range. The a- and c-axes decrease monotonously from 3.99 to 3.92 Å and from 4.03 to 4.01 Å, respectively, with increasing BKT content (Fig. 2). This is consistent with K1+ (1.33 Å) and Bi3+ (1.17 Å) ions gradually replacing the Ba2+ (1.42 Å) ion.
Powder XRD profile for BBKTx ceramics sintered in air for x = 5–90.
Variations in lattice constants (a- and c-axes) and lattice anisotropy obtained from XRD profiles in Fig. 1 for x = 5–90.
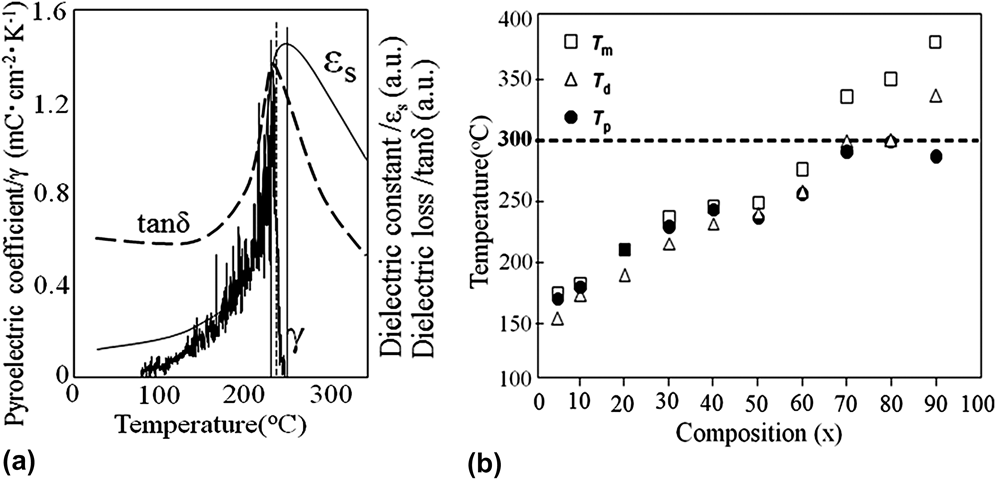
T C can be identified from the peaks in the temperature variation of second-order parameters, such as εs, tanδ, or γ. Figure 3(a) shows the temperature dependence of εs, tanδ, and γ measured at 1 MHz for BBKT50, with peaks at 251, 238, and 235 °C represented by T m, T d, and T p, respectively. Figure 3(b) shows the variation in these parameters in the range of 0 < x ≤ 90.
Variations in T m, T d, and T p for x = 5–90, and the inset shows a typical variations εs, tanδ, and γ with temperature with distinct peak values for 50 mol% BKT ceramics measured at 1 MHz.
In ferroelectrics, a strong depolarization current is observed at phase transitions. The temperature of the peak in γ (T P) obtained on heating the BBKTx ceramics indicates the temperatures at which ferroelectricity vanishes and can be considered as T C.Reference Takeda, Shimada, Katsuyama and Shiosaki7 As x increases from 5 to 80, T p (≈T C) steadily increases from 169 to 300 °C (Fig. 3). An increase in BNT content in BT from 0 to 100 mol% shifted T C from 130 to 230 °C.Reference Takeda, Shimada, Katsuyama and Shiosaki7 Thus, BKT is more effective in shifting the PTC effect toward higher temperatures through the formation of solid solutions compared with BNT.
B. Bulk PTC properties and microstructures
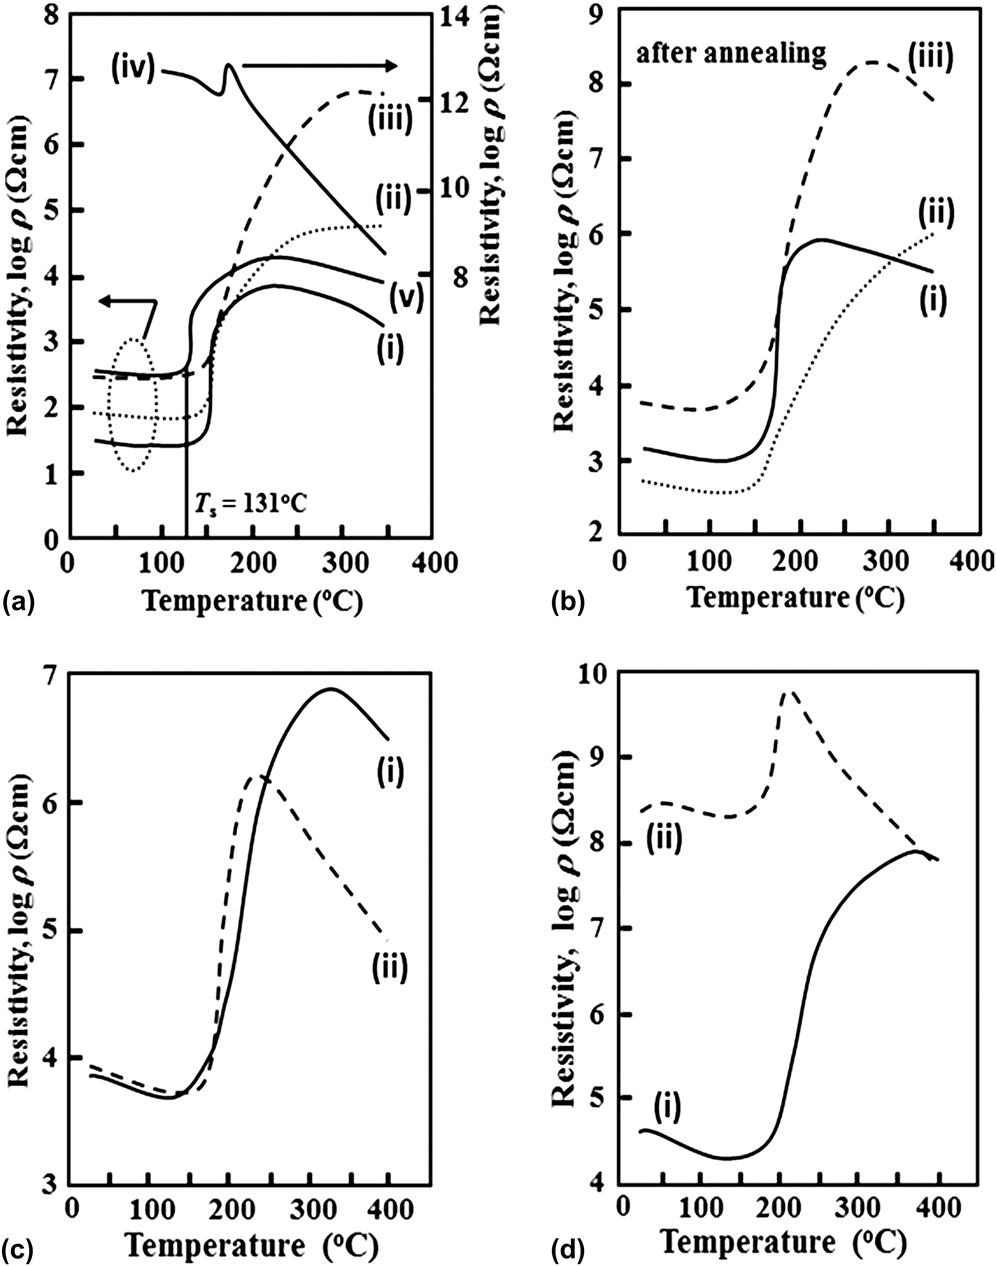
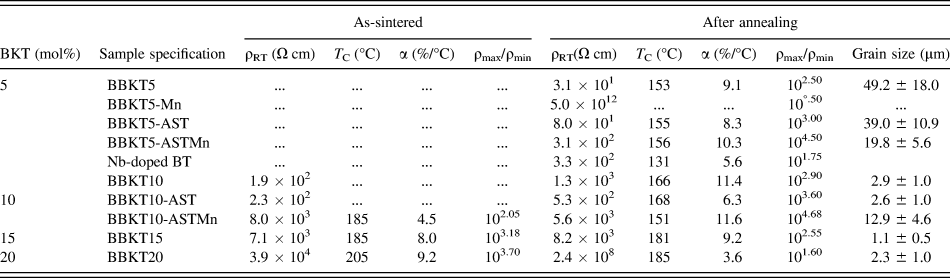
Figures 4(a)–4(d) depict the ρ(T) responses of BBKTx ceramics for 5–20 mol% BKT additions, respectively, where AST or ASTMn was added to examine its effect on the PTC responses of the new system. The corresponding processing conditions and electrical properties are room temperature resistivity (ρRT), T C for PTC devices is close to T S and is defined as the temperature at which ρ = 2 × ρmin,3 temperature coefficient of resistivity α (=ln(ρ(T 2)/ρ(T C)) × (T 2 − T C), where ρ(T C) = resistivity at T C, T 2 = T C + 30 °C, ρ(T 2) = resistivity at T 2),3 and PTC ratio (ρmax/ρmin) are tabulated in Tables I and II, respectively.
Variations in PTC characteristics for ceramics with (a) 5 mol% BKT content and annealed, specified as (i) BBKT5 (ii) BBKT5-AST (iii) BBKT5-ASTMn (iv) BBKT5-Mn (v) Nb-doped BT; (b) 10 mol% BKT content and annealed, specified as (i) BBKT10 (ii) BBKT10-AST (iii) BBKT10-ASTMn; (c) 15 mol% BKT content specified as (i) as sintered BBKT15 (ii) annealed BBKT15; (d) 20 mol% BKT content specified as (i) as sintered BBKT20 (ii) annealed BBKT20.
Variations in ρRT, T C, α, and ρmax/ρmin for as-sintered and annealed PTC ceramics and grain size after annealing.
As-sintered BBKT5 and BBKT10 ceramics exhibited 101–102 Ω cm ρRT with a very small PTC anomaly at 155 and 165 °C, respectively (not shown). In Fig. 4(a), (i–iii), annealed BBKT5, BBKT5-AST, and BBKT5-ASTMn ceramics exhibited well-developed PTC anomalies with ρRT ≤ 3.1 × 10² Ω cm, T C ≥ 153 °C, and α ≥ 8.3%/°C, with BBKT5-ASTMn ceramics having the highest T C (=156 °C), ρmax/ρmin (=104.5), and α (=10.3%/°C) values. In contrast, the Nd-doped BT ceramics [Fig. 4(a), (v)] exhibited a PTC anomaly at a lowest T C (=131 °C) with lower α (=5.1%/°C) and ρmax/ρmin (=101.75) values. The annealed BBKT5-Mn ceramic was completely insulating [Fig. 4(a), (iv)]. Following Ref. Reference Nakahara and Murakami18, the observed reduction in ρRT of insulating BBKT5-Mn by 10 orders of magnitude to 3.1 × 10² Ω cm due to addition of AST can be attributed to segregation of electron trap forming Mn at the grain boundaries. With 10 mol% BKT, as-sintered BBKT10-ASTMn exhibited a small ρmax/ρmin = 102.05 with α = 4.5%/°C at 185 °C (not shown), whereas a maximum in α (=11.6%/°C) and ρmax/ρmin (≈104.68) occurred after annealing accompanied by a reduction in T C to 151 °C, [Fig. 4(b), (iii); Table II]. An improved T C of 166 °C with ρmax/ρmin reduced to 102.9 was obtained for annealed BBKT10, whereas the annealed BBKT10-AST produced a maximum T C (=168 °C) and intermediate ρmax/ρmin (=103.6) with α reduced to 50% of that of both the annealed BBKT10 and BBKT10-ASTMn. In general, an increase in BKT content from 5 to 10 mol% shifted T C to higher temperatures except for ceramics with ASTMn (Table II) and such anomaly could be attributed to a large reduction in relative density from 83.2% to 69.9% with increase in x from 5 to10 for BBKTx-ASTMn, which could be due to a large evaporation of Bi and K with 10 mol% BKT. A reduction in sintering temperature of BBKT10-ASTMn would presumably improve T C by reducing evaporation of volatile elements. Moreover, the increase in ρmax/ρmin by 0.6 ± 0.1 and 1.9 ± 0.1 orders of magnitude by AST and ASTMn additions, respectively, for both BBKT5 and BBKT10, similar to BT-based PTC ceramics,Reference Illingsworth, Al-Allak, Brinkman and Woods19 can be attributed to grain boundary segregation of impurities,Reference Heywang1 Al3+(Reference Cheng20) and Mn2+(Reference Nakahara and Murakami18) acceptors, in the presence of AST.
The reduction in α by 8.8% and 44.7% associated with an increase in maximum resistivity temperature (Tρmax) by 75 °C and more the 180 °C with the addition of AST with BBKT5 and BBKT10, respectively, indicates the formation of deeper grain boundary acceptor states by segregated Al3+(Reference Cheng20,Reference Allak, Parry, Russell and Woods21) than the preexisting impurityReference Heywang1 and vacancyReference Takeda, Shimada, Katsuyama and Shiosaki7,Reference Shimada, Touji, Katsuyama, Takeda and Shiosaki8 traps. For BBKT15 and BBKT20, no AST or ASTMn were required to be added to produce reasonable ρmax/ρmin ≥ 103, whereas a rise in α by 13.2% and 2% due to addition of Mn to BBKTxAST for x = 5 and 10, respectively, indicates a rise in grain boundary trap density by the presence of additional Mn2+ ions.Reference Heywang1,Reference Jonker2
Following Figs. 4(c) and 4(d) and Table II, for as-sintered BBKT15 and BBKT20 ceramics, T C was further increased to 185 and 205 °C, respectively, and produced a ρmax/ρmin of 103.4±0.3, whereas annealing not only reduced T C by 4 and 20 °C of BBKT15 and BBKT20, respectively, but also significantly reduced the ρmax/ρmin of BBKT20 ceramics by raising ρRT by nearly 4 orders of magnitude. So, T C was successfully raised by the addition of high T C (=380 °C)Reference Buhrer17 BKT into low T C (=130 °C) BT for both as-sintered and annealed samples, similar to those observed for BBNTx-based ceramics.Reference Takeda, Shimada, Katsuyama and Shiosaki7–Reference Xiang, Takeda and Shiosaki9
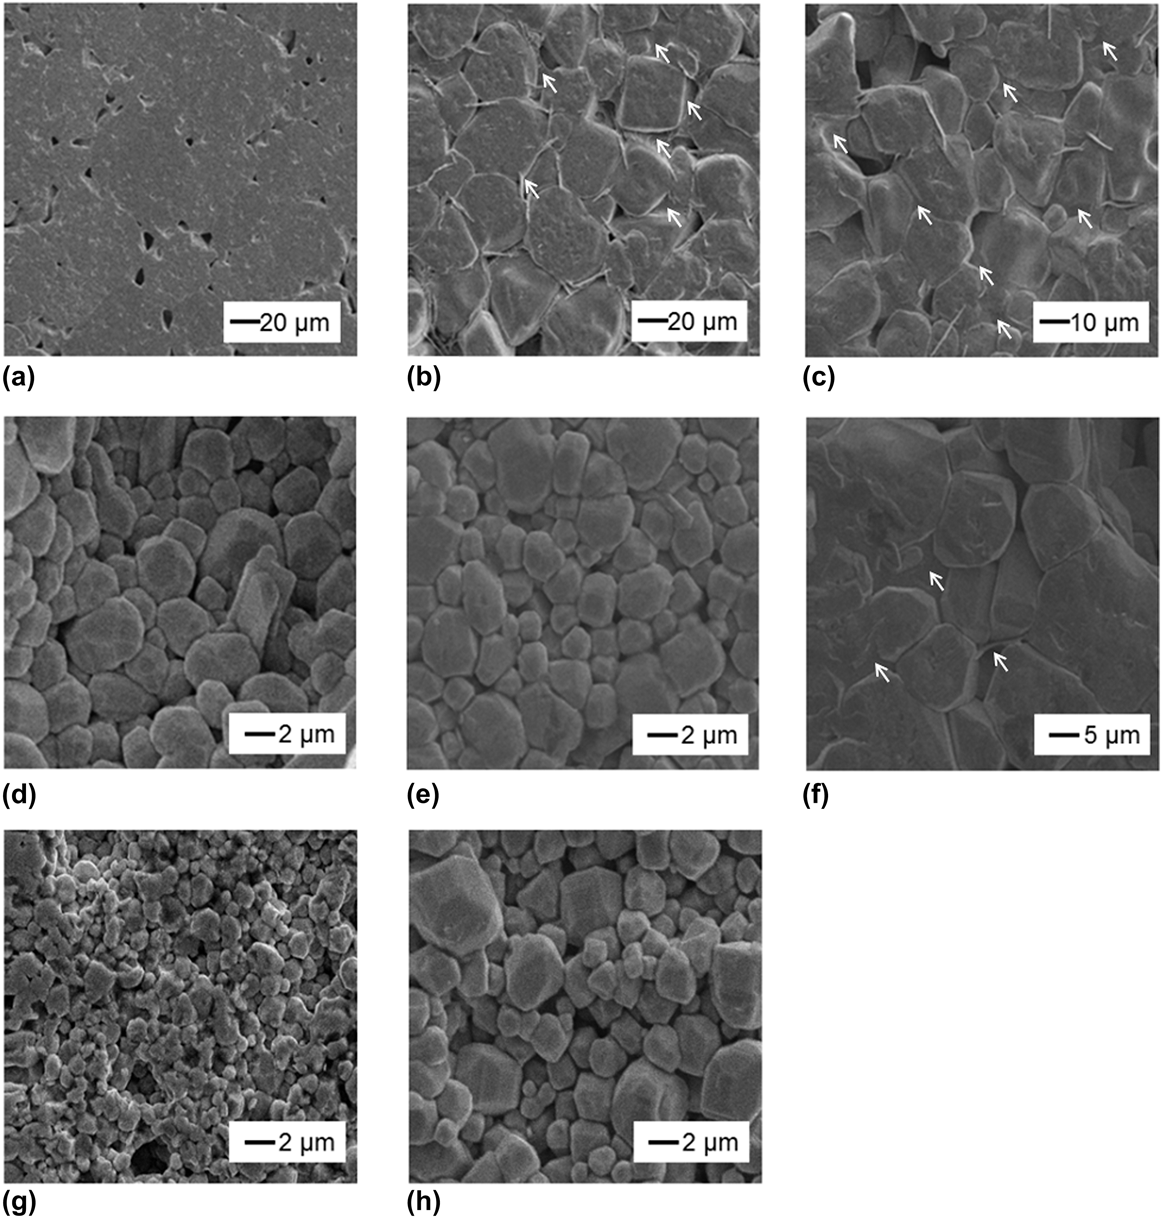
The microstructures of all annealed PTC ceramics in Figs. 5(a)–5(h) exhibit irregularly shaped grains with low aspect ratio. Intergranular and triple junction second phases could be observed in BBKT5-AST, BBKT5-ASTMn, and BBKT10-ASTMn ceramics (shown by arrow marks) similar to those observed in case of BT with AST additions.Reference Cheng20 A sudden decrease in grain size of BBKTx ceramics for x > 5 by more than 92% and an increase in ρRT by 7 orders of magnitude with an increase in x from 5 to 20 (Table II) was observed. A similar effect has also been reported for BBNTx-based PTC systems for x > 1.Reference Xiang, Takeda and Shiosaki22 As these novel lead-free high T C PTC materials were developed by combination of volatile BKT and nonvolatile BT, special emphasis was selectively given on Bi, K, and Ti for EPMA-WDS chemical analysis. The elemental distribution maps for Bi, K, and Ti appeared featureless indicating a homogeneous distribution of the elements within the BBKTx solid solution, which was further supported by the appearance of single-phase XRD patterns exhibiting a steady change in lattice anisotropy and Curie temperature with increase in x (Figs. 1–3). From EPMA-WDS quantitative analysis, bulk-averaged molar content ratios (Bianalysis:Kanalysis) in sintered BBKTx ceramics were determined to be 0.02:0.017, 0.038:0.03, 0.062:0.056, and 0.072:0.067 for x = 5, 10, 15, and 20, respectively, by fixing the Ti molar content to unity, as the B site defect formation in perovskite ABO3 structure was reported to be energetically least favorable.Reference Moriwaka23 The errors associated with the quantitative analysis fell under 1%. When these results were compared with the corresponding actual starting raw material molar ratios (Biraw-mat:Kraw-mat) of 0.025:0.025, 0.05:0.05, 0.075:0.075, and 0.1:0.1 obtained from the chemical formula: Ba(1−x/100)(Bi1/2K1/2)(x/100)TiO3, the ratios of decrement in molar values of Bi and K represented as ΔBi:ΔK (=|Bianalysis − Biraw-mat|:|Kanalysis − Kraw-mat|) were found to be 0.005:0.008, 0.012:0.020, 0.013:0.019, and 0.028:0.032, respectively, indicating an increase in evaporation of both elements with increase in x during high temperature processing. Such evaporation phenomena reduced the actual BKT content in BBKTx solid solution and hence could be responsible for our observed reduction in T C when sintering step was followed by another high temperature annealing step for x = 10–20. Furthermore, the excess evaporation of K over Bi (|Bianalysis − Kanalysis|) was 0.003 mol for x = 5, whereas it increased to ≥0.005 mol for x ≥ 10. Following the defect chemistry of n-type BT ceramics,Reference Chan and Smyth24 at lower BKT levels (x ≤ 5), a small amount of excess Bi3+ is compensated by free electrons, resulting in a low ρRT:
 $$2{\rm{B}}{{\rm{i}}_{\rm{2}}}{{\rm{O}}_{\rm{3}}} + 4{\rm{Ti}}{{\rm{O}}_{\rm{2}}} = \;4{\rm{Bi}}_{{\rm{Ba}}}^ \cdot + 4{\rm{T}}{{\rm{i}}_{{\rm{Ti}}}} + 12{{\rm{O}}_{\rm{O}}}{\rm{ + }}{{\rm{O}}_{\rm{2}}}\left( \uparrow \right) + 4{\rm{e'}}\quad .$$
SEM micrographs of samples (a) BBKT5 (b) BBKT5-AST, (c) BBKT5-ASTMn, (d) BBKT10, (e) BBKT10-AST, (f) BBKT10-ASTMn, (g) BBKT15, and (h) BBKT20, after annealing.
An increase in excess Bi3+ concentration with increasing BKT content shifts the compensating defects from electrons to vacancies:
 $$2{\rm{B}}{{\rm{i}}_{\rm{2}}}{{\rm{O}}_{\rm{3}}} + 6{\rm{Ti}}{{\rm{O}}_2} = 4{\rm{Bi}}_{{\rm{Ba}}}^ \cdot + 6{\rm{T}}{{\rm{i}}_{{\rm{Ti}}}} + 18{{\rm{O}}_{\rm{O}}} + 2{{\rm{V''}}_{{\rm{Ba}}}}\quad .$$
So, the rise in ρRT with BKT content could be associated with two separate phenomena: first a transition in compensation mechanism that is believed to form a frozen-in  ${{\rm{V''}}_{{\rm{Ba}}}}$-rich grain boundary layer during cooling from annealing temperatureReference Leach and Zubair25 and second, an increase in
 ${{\rm{V'''}}_{{\rm{Bi}}}}$ and
 ${{\rm{V'}}_{\rm{K}}}$ concentration in the crystal lattice associated with an increase in Bi and K evaporation, which inhibits reduction of Ti4+ to Ti3+ by neutralizing the charge associated with
 ${\rm{V}}_{\rm{O}}^{ \cdot \cdot }$ and reduces the effective bulk carrier concentration. According to DSB model,Reference Heywang1,Reference Jonker2 the grain boundary Schottky-type potential barrier being inversely proportional to effective bulk donor or carrier concentration the ρRT value increases.
 ${{\rm{V''}}_{{\rm{Ba}}}}$ has also been reported to act as a grain growth inhibitorReference Ting, Peng, Lu and Wu26 and hence reduces the grain size for x > 5 in our case. Although the grain size is gradually reduced by additions of AST and Mn for ceramics with 5 mol% BKT, there is an opposite trend for ceramics with 10 mol% BKT. The reason for this is currently unclear.
C. IS study
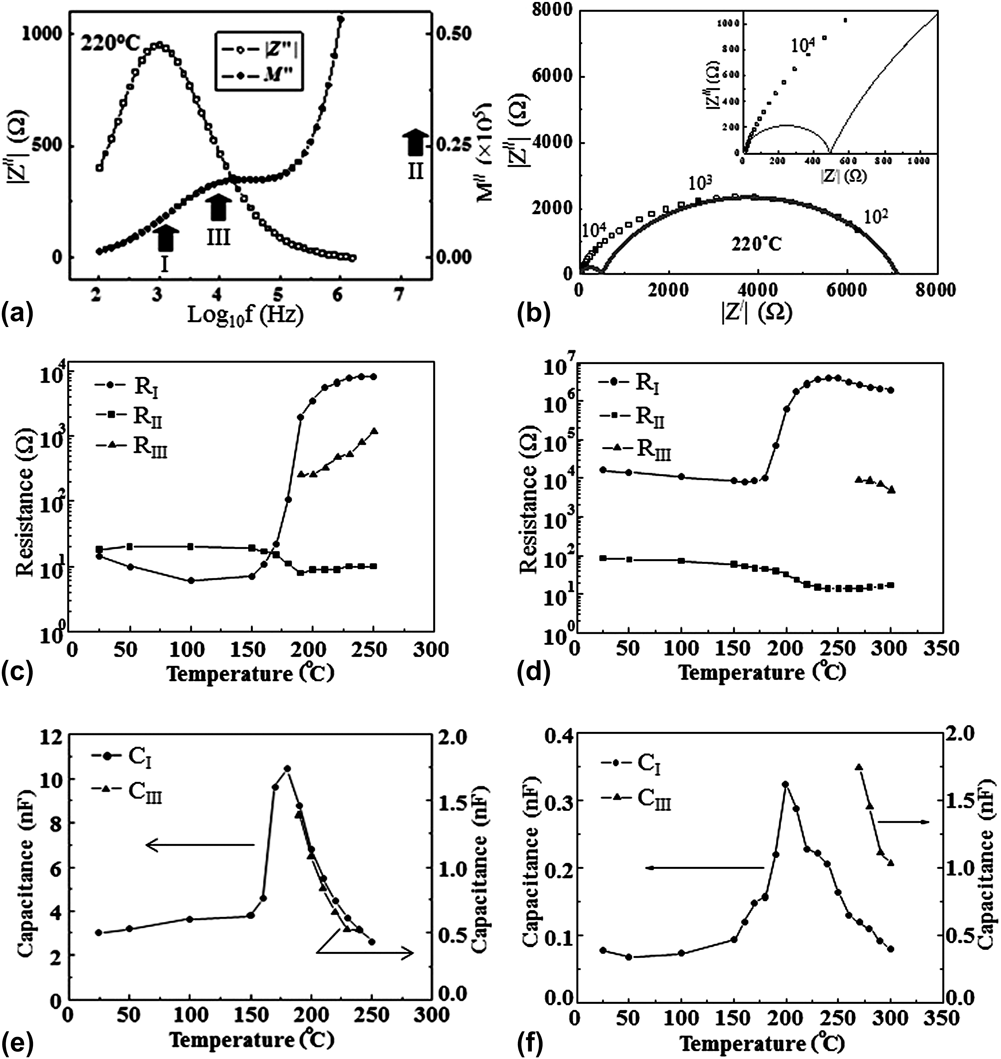
To investigate the PTC responses specific to different microstructural regions, a series of Cole–Cole and combined Z″ and M″ spectroscopic plots were constructed between RT and 300 °C. Typical examples of these are shown in Figs. 6(a) and 6(b) for BBKT5-ASTMn, collected at 220 °C. The lowest frequency Z″ and M″ peaks (marked as “I”) below 104 Hz in Fig. 6(a) are attributed to the grain boundary RC element.Reference Sinclair and West27 Since in these materials, the grain interior relaxation shows the lowest resistance (R) and capacitance (C) values,Reference Sinclair and West27 the corresponding M″ peak (“II”) is assumed to fall outside the measurement frequency range. An additional peak (“III”) with temperature-independent peak frequency has been attributed to a third RC element. The corresponding Cole–Cole plot [Fig. 6(b)] depicts an evidence of a much smaller second arc at higher frequencies, consistent with peak “III” in the M″ spectrum, and supporting the presence of a third RC element. The resistance variations in grain (R II), grain boundary (R I), and in the third RC element (R III) obtained from the highest frequency intercepts and diameters of low- and high-frequency semicircles, respectively, are shown in Figs. 6(c) and 6(d) for BBKT5-ASTMn and BBKT15 correspondingly. Only the grain boundary component makes a significant contribution to the PTC effect, whereas the grain core remains semiconducting for both ceramics, indirectly indicating that the resistance originates from a grain boundary potential barrier. The grain core semiconductivity is most likely to arise from reduction of Ti4+ by  ${\rm{V}}_{\rm{O}}^{ \cdot \cdot }$ generated while sintering the ceramics under N2 flow according to the following equation:
 $${\rm{Ba}}_{1 - x}^{2 + } \left( {{\rm{Bi}}_{{1 \mathord{\left/ {\vphantom {1 2}} \right. \kern-\nulldelimiterspace} 2}} {\rm{K}}_{{1 \mathord{\left/ {\vphantom {1 2}} \right. \kern-\nulldelimiterspace} 2}} } \right)_x^{2 + } {\rm{Ti}}^{4 + } {\rm{O}}_3^{2 - } = \;{\rm{Ba}}_{1 - x}^{2 + } \left( {{\rm{Bi}}_{{1 \mathord{\left/ {\vphantom {1 2}} \right. \kern-\nulldelimiterspace} 2}} {\rm{K}}_{{1 \mathord{\left/ {\vphantom {1 2}} \right. \kern-\nulldelimiterspace} 2}} } \right)_x^{2 + } {\rm{Ti}}_{1 - 2{\rm{\delta }}}^{4 + } {\rm{Ti}}_{2{\rm{\delta }}}^{3 + } {\rm{O}}_{3 - {\rm{\delta }}}^{2 - } + {\rm{\delta V}}_{\rm{O}}^{ \cdot \cdot } + \left( {{{\rm{\delta }} \mathord{\left/ {\vphantom {{\rm{\delta }} 2}} \right. \kern-\nulldelimiterspace} 2}} \right){\rm{O}}_2 \left( \uparrow \right)\quad .$$
(a) Cole–Cole and (b) combined Z″ and M″ spectroscopic plots for annealed BBKT5-ASTMn PTC ceramics; (c–d) temperature dependence of resistance of the RC elements for (c) annealed BBKT5-ASTMn, (d) as sintered BBKT15 PTC ceramics; (e–f) temperature dependence of capacitance of the RC elements for (e) annealed BBKT5-ASTMn, (f) as-sintered BBKT15 PTC ceramics.
The increase in resistance of the grain boundary component (R I) by 2.5 ± 0.3 orders of magnitude with increase in BKT content from 5 to 15 mol% [Figs. 6(c) and 6(d)] can be attributed to a rise in interface Schottky barrierReference Heywang1,Reference Jonker2,Reference Zubair and Leach28 height due to a more pronounced neutralization of donor type  ${\rm{V}}_{\rm{O}}^{ \cdot \cdot }$ by an enhanced Bi and K evaporation phenomena at higher BKT level as mentioned in Sec. III. B. A reduction in bulk Ti3+ concentration associated with such neutralization can be expressed as follows:
$$\eqalignb{ {\rm{Ba}}_{1 - x}^{2 + } \left( {{\rm{Bi}}_{{1 \mathord{\left/ {\vphantom {1 2}} \right. \kern-\nulldelimiterspace} 2}} {\rm{K}}_{{1 \mathord{\left/ {\vphantom {1 2}} \right. \kern-\nulldelimiterspace} 2}} } \right)_x^{2 + } {\rm{Ti}}^{4 + } {\rm{O}}_3^{2 - } = \;{\rm{Ba}}_{1 - x}^{2 + } \left( {{\rm{Bi}}_{{1 \mathord{\left/ {\vphantom {1 {2 - {\rm{\alpha }}}}} \right. \kern-\nulldelimiterspace} {2 - {\rm{\alpha }}}}}^{3 + } {\rm{K}}_{{1 \mathord{\left/ {\vphantom {1 {2 - {\rm{\beta }}}}} \right. \kern-\nulldelimiterspace} {2 - {\rm{\beta }}}}}^ + } \right)_x {\rm{Ti}}_{1 - \left[ {2{\rm{\delta }} - \left( {3{\rm{\alpha }}x + {\rm{\beta }}x} \right)} \right]}^{4 + } {\rm{Ti}}_{2{\rm{\delta }} - \left( {3{\rm{\alpha }}x + {\rm{\beta }}x} \right)}^{3 + } {\rm{O}}_{3 - {\rm{\delta }}}^{2 - } + {\rm{\alpha }}x{\rm{V'''}}_{{\rm{Bi}}} + {\rm{\beta }}x{\rm{V'}}_{\rm{K}} + \left( {{{{\rm{\alpha }}x} \mathord{\left/ {\vphantom {{{\rm{\alpha }}x} 2}} \right. \kern-\nulldelimiterspace} 2}} \right){\rm{Bi}}_{\rm{2}} {\rm{O}}_{\rm{3}} \left( \uparrow \right) + \left( {{{{\rm{\beta }}x} \mathord{\left/ {\vphantom {{{\rm{\beta }}x} 2}} \right. \kern-\nulldelimiterspace} 2}} \right){\rm{K}}_{\rm{2}} {\rm{O}}\left( \uparrow \right) + \left( {{1 \mathord{\left/ {\vphantom {1 2}} \right. \kern-\nulldelimiterspace} 2}} \right)\left[ {{\rm{\delta }} - \left( {{1 \mathord{\left/ {\vphantom {1 2}} \right. \kern-\nulldelimiterspace} 2}} \right)\left( {3{\rm{\alpha }}x + {\rm{\beta }}x} \right)} \right]{\rm{O}}_{\rm{2}} \left( \uparrow \right) + {\rm{\delta V}}_{\rm{O}}^{ \cdot \cdot } \quad . \cr} $$ This explains the observed increase in grain core resistance (R II) below T C by approximately an order of magnitude with 10 mol% rise in BKT content that requires ∼0.015 mol bulk O2 release per mol of BBKTx [obtained by using ΔBi:ΔK values for x = 5 and 15 from Sec. III. B into Eq. (4)] under the simplification assumptions that the electron hopping conductivity and the extent of grain core reduction remained the same irrespective of composition and processing. The resistance of the third element (R III) remains intermediate between grain core and grain boundary and cannot be considered as due to leads, etc., outside the furnace due to their high resistance values (102–104 Ω). We have attributed this to a  ${{\rm{V''}}_{{\rm{Ba}}}}$-rich outer grain shellReference Sinclair and West27 actively inhibiting grain growth in BBKTx ceramics as mentioned in Sec. III. B. Formation of a frozen in
 ${{\rm{V''}}_{{\rm{Ba}}}}$-rich layer has previously been reported for BBNTx system due to a transition in electronic to vacancy compensation mechanism for more than 1 mol% BNT content.Reference Xiang, Takeda and Shiosaki22 The capacitance data of grain boundary (C I) and grain shell (C III) extracted from M″ peak heights for BBKT5-ASTMn and BBKT15 ceramics are shown in Figs. 6(e) and 6(f), respectively. Grain boundaries for both ceramics exhibited ferroelectric behavior. The peak grain boundary capacitances occurred at 160 ± 10 °C and 200 ± 20 °C for 5 and 15 mol% BKT, respectively, which agree with the measured T C values in both cases (Table II). The capacitances of the third RC element (showing temperature-independent M″ peak frequencies) for both compositions exhibited a ferroelectric behavior. No distortions in Cole–Cole plots and no M″ peaks around 10 KHz could be observed below 200 °C for 5 mol% and below 270 °C for 15 mol% BKT to determine the R and C values of the third RC element. A stronger PTC response of the grain boundary over the grain shell indicates a more prominent trap activity at the grain boundary over the possible
 ${{\rm{V''}}_{{\rm{Ba}}}}$ at grain shell.
D. CM microscopy
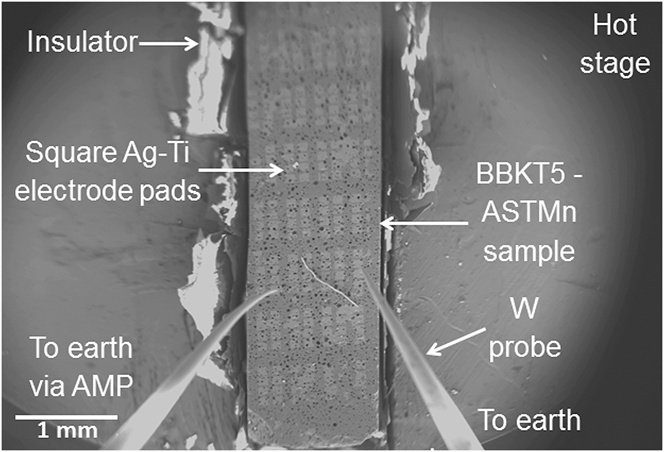
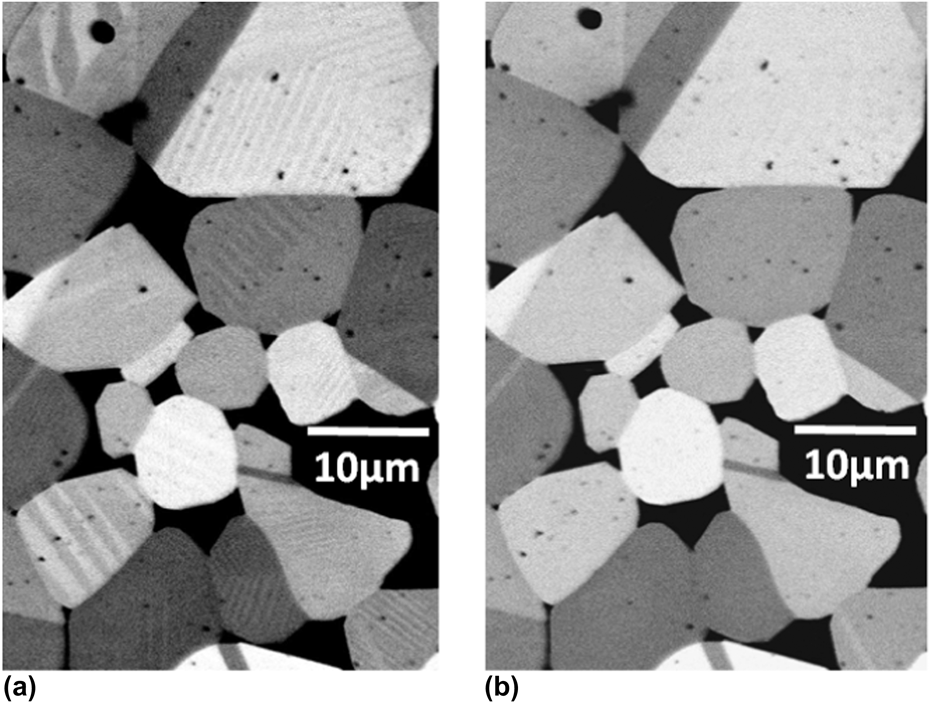
BBKT5-ASTMn ceramic was selected for detailed investigation of the electrical structure of the grain boundaries since it shows the strongest PTC effect and hence is likely to have the most prominent electrical activity. Figure 7 depicts the sample, mounted on a hot stage, inside the SEM vacuum chamber along with electrodes and contact probes, which collect the CM signal generated as a result of the electron beam impinging the sample. The hot-stage BSE images in Figs. 8(a) and 8(b) show that ferroelectric domains inside the grains disappear as the temperature is raised from 140 to 160 °C, indicating that T C is within this temperature range. This agrees with the T C value of BBKT5-ASTMn in Table II. For CM analysis, temperature was raised to Tρmax (=250 °C), where the grain boundary resistance is maximum [Fig. 6(c)], due to maximization of the grain boundary potential, according to the most widely accepted DSB model.Reference Heywang1,Reference Jonker2,Reference Zubair and Leach28
Real-time specimen configurations for CM microscopy.
Hot-stage BSE image of BBKT5-ASTMn PTC ceramic at (a) 140 °C, (b) 160 °C.
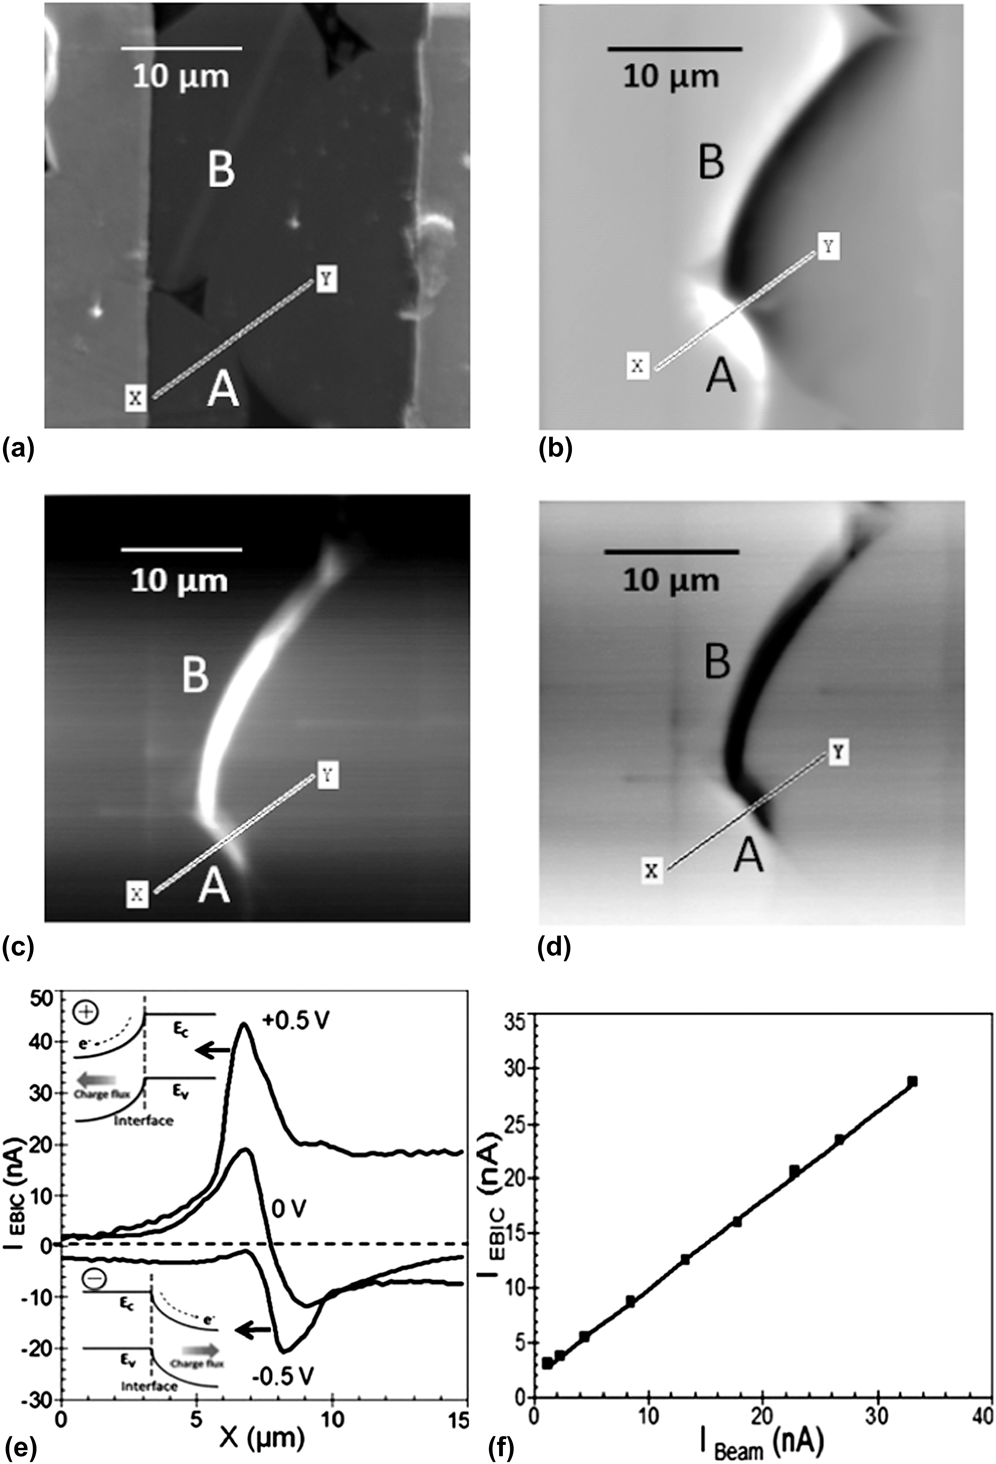
Figure 9(a) is an SE image of an area of the ceramic that was selected for this study. The edges of the electrodes are spaced 20 μm apart, which is comparable with the average grain size. The zero bias CM image of that area at 250 °C under 15 nA beam current in Fig. 9(b) shows typical bright–dark EBIC image contrast parallel to grain boundaries “A” and “B”, which is consistent with it being formed from a back-to-back interface DSB layerReference Heywang1,Reference Jonker2,Reference Leach16,Reference Palm29 formed by charge trapping at the grain boundary, which leads to a negatively charged grain boundary plane compensated by positive space charge layers, consisting of opposing electric fields extended into the grains on either side of the interface. As the beam rasters across a grain boundary plane, the opposing electric fields cause the EBIC generated by the separation of beam-induced electron–hole pairs in the depletion field to flow first in one direction and then in the other. In the CM image, this appears as bright–dark contrast running parallel to grain boundary or as symmetric positive–negative current peaks in EBIC line scan and is known as type-I EBIC contrast.Reference Leach16 Such contrast [Fig. 9(b)] is similar to that observed in commercial Pb-containing thermistorsReference Seaton and Leach12 but differs from those observe in hexagonal ZnO, where internal field generated by crystal anisotropy suppressed EBIC signal generation from one side of the grain boundary at zero bias and are known as type-II EBIC contrast.Reference Leach16 When sufficient positive [Fig. 9(c)] or negative [Fig. 9(d)] bias is applied across grain boundaries “A” and “B” through electrode pairs, a single bright or dark contrast apparently resembling type-II EBIC contrast appears. In Fig. 9(e), the zero bias EBIC line scan across the grain boundary “A” along “XY” produces alternating +ve and −ve peaks in the current profile, which are typical of symmetric band bending associated with two opposing electric fields on either side of the interface. With +0.5 V bias, the current profile produces a single positive current peak. A reversal in bias polarity produces a single negative current peak at the grain boundary corresponding to dark contrast. Under sufficient bias voltage, the barrier in one side of the interface reduces to zero due to band-flattening effect by compensation of space charge field while leaving a large band bending in the other. Under such flat band condition, the charge separating field is lost, and EBIC signal from that side disappears leaving only a single EBIC peak. A bias reversal reverses the situation as depicted in the insets of Fig. 9(e) for +0.5 and −0.5 V line scan profiles. This behavior confirms the existence of back-to-back DSB layer along grain boundaries of Pb-free thermistors and is consistent with the PTC effects in our samples based on the DSB model.Reference Leach16,Reference Palm29 Into further support of the case for a DSB layer, a contrast reversal upon change in bias polarity should be accompanied with a lateral shift equal to the width of e-beam excitation volume (η),Reference Palm29 which is 1.38 μm calculated for an accelerating voltage of 20 keV and a sample density of 4.99 g/cc. We have observed a peak shift of ∼1.4 μm in EBIC profile due to contrast reversal [Fig. 9(e)], which agrees with the η value. Figure 9(d) shows a linear variation in peak EBIC current (I EBIC) with beam current (I beam) with an EBIC gain (I EBIC/I beam) just under unity (=0.90 ± 0.05), which agrees with a previous observation of EBIC gain from type-I contrast for commercial thermistor grain boundary.Reference Seaton and Leach12 In BBKT5-ASTMn ceramics, the EBIC contrast forming charge traps could form from adsorption of O2 at the grain boundaries while annealing, which oxidizes Mn2+ at the grain boundaries to form electron traps with energy depth as high as 1.59 ± 0.01 eV.Reference Zubair and Leach30 The absence of any grain boundary-EBIC contrast in the CM image of the same area at 140 °C, i.e., below T C is also consistent with the suppression of charge-separating interface Schottky barrier by their interaction with the spontaneous polarization charges of the ferroelectric domains in tetragonal phase as predicted by the DSB model.Reference Jonker2,Reference Zubair and Leach30
(a) SE image of interelectrode area; (b–d) CM image of the same area at 250 °C under the condition of (b) 0 V, (c) −0.5 V, and (d) +0.5 V; (e) EBIC current line scans along “XY” showing a change in EBIC under different voltage bias conditions, (f) variations in EBIC with PE beam current at the EBIC active grain boundary.
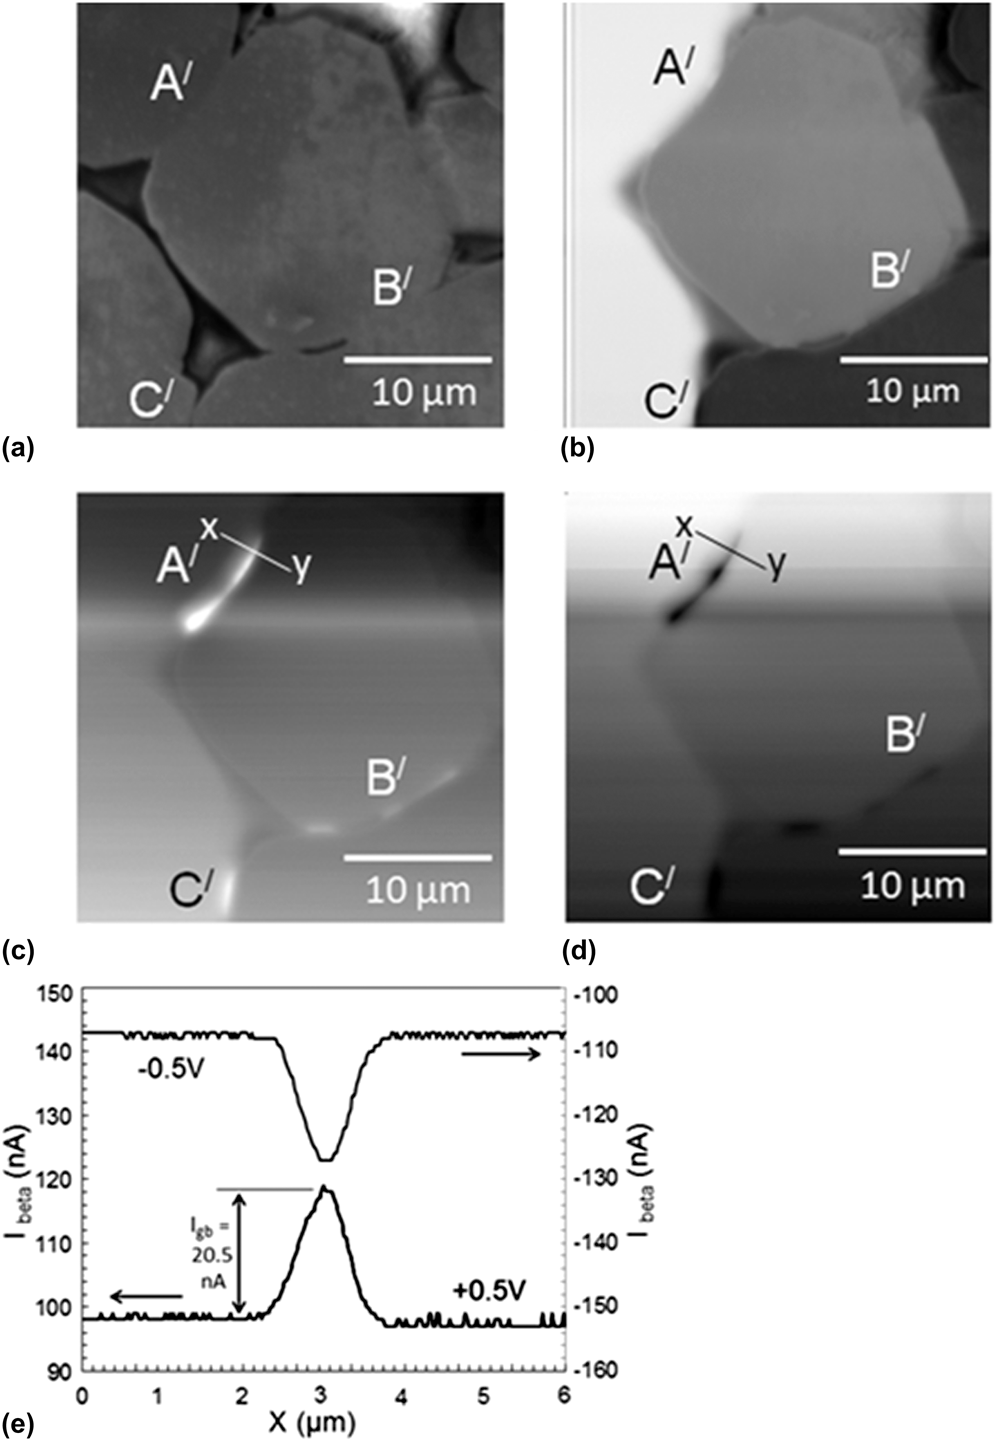
Figure 10(a) shows an SE image taken from a different area of the sample, with a local grain size of 20 μm and an electrode separation of 40 μm. The corresponding zero bias CM image under 1.5 nA beam current at 250 °C [Fig. 10(b)] exhibits resistive contrast identified by clear contrast steps along the grain boundaries. As a purely resistive grain boundary is traversed by a rastering electron beam, the proportion of incident beam current reaching the amplifier (through one of the contact probes) to generate the CM image undergoes an abrupt change producing a discontinuity in the resultant contrast level. However, under +0.5 and −0.5 V bias, only single bright and dark line contrasts appeared, respectively, coincident with some grain boundaries “A′,” “B′,” and “C′” as depicted in Figs. 10(c) and 10(d). Such line contrast is associated with β-conductivity rather than EBIC because of two reasons. First, at 0 V, no bright and/or dark contrasts were observed parallel to grain boundaries other than step contrasts [Fig. 10(b)] and second, a lateral shift in line contrast of less than 0.1 μm produced upon bias reversal was too small to be compared with η ≈ 1.38 μm. Therefore, to view the β-conductivity contrast, an image is collected under an external bias between two current collecting electrodes, where the image brightness contrast is controlled by the amount of excess current flow between the electrodes. When the electron beam rasters across the conductive grain interior under an applied field, any local injection of charge carriers fails to produce any significant change in bulk conductivity due to preexistence of a large concentration of mobile carriers associated with  ${\rm{V}}_{\rm{O}}^{ \cdot \cdot }$ and an excess of Bi3+ over K+ (by 0.003 mol) in the grains and the current flow between the electrode remains approximately unchanged for the interelectrode resistance being primarily dominated by the high resistive grain boundary regions. So, no β-conductivity contrast could be observed within the grain interior.Reference Russell and Leach15 But as the beam rasters across an insulating grain boundary region devoid of charge carriers, a sharp contrast in brightness level arises due to a significant rise in the current flow between the electrodes, as the local injection of mobile carriers by the electron beam decreases the resistivity of the grain boundary, which in turns significantly drops overall interelectrode resistance.Reference Russell and Leach15 At PTC grain boundaries, the mobile carrier density can significantly be reduced either by the existence of a
 ${{\rm{V''}}_{{\rm{Ba}}}}$-rich layer or a resistive intergranular second phase layer, all resulting in an n/i/n-type interfacial electrical structure.Reference Daniels and Wernicke31 Although from SE image [Fig. 10(a)], the β-conductivity active interfaces appeared free from any resistive film ultrathin insulating second phase layers could possibly be observed at a much higher magnification. High magnification BSE imaging along with electron backscatter pattern (EBSP) analysis characterized β-conductivity active grain boundaries as random high-angle interfaces devoid of any second phase film.Reference Leach and Seaton32 Recently, combined high-resolution transmission electron microscopy (HRTEM) and EBSP studies on PTC grain boundariesReference Hou, Zhang, Press, sitte and Dehm33 revealed thin (0.53 ± 0.09 nm) atomic disordered regions at high-angle grain boundaries that could be a potential source for point defects like cation vacancies and all the second phases predominantly accumulated at the triple junctions instead of forming thin intergranular film.Reference Hou, Zhang, Press, sitte and Dehm33,Reference Zubair and Leach34 The
 ${{\rm{V''}}_{{\rm{Ba}}}}$-rich third resistive element (R III) with resistance as high as 103–104 Ω compared with a low bulk resistance (R II) of ∼101 Ω, obtained from the IS study at 250 °C [Figs. 6(c) and 6(d)] could be a supporting evidence for the existence of low conductivity regions at the grain boundary interfaces. The resistance of the thin resistive grain boundary region can significantly be reduced through high-energy electron beam irradiation by one of the two possible ways. First, in case of an insulating grain boundary, the local injection of free electrons can lead to an abrupt increase in charge carrier concentration within the carrier depleted grain boundary region. This drops the grain boundary resistance for the resistivity of a material being inversely related to carrier concentration as followsReference Press and sitte35,Reference Palm, Steinbach and Alexander36 :
 $${\rm{\sigma }} = {1 \mathord{\left/ {\vphantom {1 {{\rm{\rho }} = e\left( {n{\rm{\mu }}_{\rm{e}} + p{\rm{\mu }}_{\rm{p}} } \right)}}} \right. \kern-\nulldelimiterspace} {{\rm{\rho }} = e\left( {n{\rm{\mu }}_{\rm{e}} + p{\rm{\mu }}_{\rm{p}} } \right)}}\quad ,$$
where, e is the electronic charge, n and p are the carrier (electron and hole) concentrations and μe and μp are electron and hole mobilities, respectively. Second, in case of a negatively charged grain boundary potential barrier,Reference Heywang1,Reference Daniels and Wernicke31,Reference Leach and Seaton32 when the electron–hole pairs are generated by the interaction of high-energy electron beam at the vicinity of the charged grain boundary layer, some of the holes could be drifted toward the grain boundary by the built-in field to neutralize the negative grain boundary charges instead of getting recombined with the counter electrons and reduce the barrier height or the grain boundary resistivity.Reference Palm, Steinbach and Alexander36Figure 10(e) shows typical quantitative CM line scan current profiles across grain boundary “A′” along “xy” with +0.5 and −0.5 V interelectrode biases. Here, the axes are offset to compensate for the large interelectrode standing current associated with preexisting bulk charge carriers under the applied bias. This reveals a large excess of interelectrode current flow of I gb = 20.5 ± 0.5 nA, represented by the current peaks in the line scan profiles, when the beam with a beam current of as low as 1.5 nA impinges the grain boundary. This indicates a sudden reduction in the resistance of the high resistive/insulating grain boundary component leads to a sharp rise in the interelectrode current flow due to carrier injection. The I gb peak reversal associated with a bias reversal arises from a reversal in the direction of current flow and an associated peak shift <0.06 μm is typical for β-conductivity.Reference Russell and Leach15 Although the n/i/n structures are expected to be accompanied with depletion layers on either side of a boundary layer,Reference Daniels and Wernicke31,Reference Leach and Seaton32,Reference Press and sitte35 the absence of any 0 V EBIC contrast superimposed over resistive contrast must be due to band bending being insufficient to permit adequate charge separation to produce any observable EBIC signal, which resulted in a much weaker PTC effect in vacancy-rich R III element compared with R I element (possibly rich in deep active traps like Mn/Al and adsorbed O2−(Reference Jonker2) [Fig. 6(c) and Sec. III. C]). Hence, the observed β-conductivity contrast and the resistive third component observed from the IS study complemented each other in favor of n/i/n-type grain boundary structure. So, our observation of distinct forms of contrast in different microstructural regions of BBKTx-based PTC ceramics reflects the diversity in electrical structure in individual grain boundaries, which we believe to be brought about by microstructural variations arising from inhomogeneities in local stoichiometry associated with evaporation of Bi and K and/or distribution of acceptor dopants. An earlier CM studyReference Leach and Seaton32 on grain boundaries in a fine-grained pure BT-based acceptor (Mn)-doped commercial thermistor also demonstrated the coexistence of β-conductivityReference Russell and Leach15 and EBIC contrast, arising from charge-separating DSB interfaces.Reference Zubair and Leach30 Such behavior is consistent with the coexistence of charged interfaces and mobile carrier depleted interfacial layers in different microstructural regions of the sintered body. This directly indicates that the range of grain boundary structures responsible for PTC effect is similar to both pure BT- and BBKTx-based electroceramics.
(a) SE image grain boundaries “A′,” “B′,” and “C′”; (b–d) CM images of boundaries at 250 °C under (b) 0 V, (c) +0.5 V, and (d) −0.5 V, (e) CM line scan current profiles along “xy” with applied biases of +0.5 and −0.5 V, and a beam current of 1.5 nA.
IV. SUMMARY
In this study, addition of BKT in BT was initially established as a potential method for shifting T C to as high as 300 °C with 80 mol% BKT addition to fabricate high T C Pb-free PTC thermistors. Additions of 5 mol% AST and 0.1 wt% MnCO3 improved PTC property. Although sintering under N2 flow followed by air annealing was necessary to achieve ρmax/ρmin and α as high as 104.5–104.7 and 10.3–11.6%/°C, respectively, for up to 10 mol% BKT, the annealing step was omitted to achieve high T C, α, and ρmax/ρmin above 10 mol% BKT content. A 107 times increase in ρRT and a 92% reduction in grain size in annealed samples with increasing BKT content was attributed to transition from electronic to  ${{\rm{V''}}_{{\rm{Ba}}}}$ compensation mechanism along with neutralization of
 ${\rm{V}}_{\rm{O}}^{ \cdot \cdot }$ by
 ${{\rm{V'''}}_{{\rm{Bi}}}}$ and
 ${{\rm{V'}}_{\rm{K}}}$ formed from evaporation of Bi and K. T C was found to rise from 131 to 205 °C with increase in BKT content from 0 to 20 mol%. Z* analysis of the Pb-free ceramics revealed free electron-rich semiconducting grain core, ferroelectric
 ${{\rm{V''}}_{{\rm{Ba}}}}$-rich outer grain shell, and grain boundary with deep traps contributing the most to bulk PTC responses. The T C obtained from grain boundary capacitance data agreed well with bulk T C within the measurement errors. The CM study on BBKT5-ASTMn ceramics at 250 °C revealed type-I EBIC contrasts in some grain boundaries consistent with the existence of interface back-to-back DSB layer. The disappearance of grain boundary EBIC signals with concurrent appearance of ferroelectric domains below T C directly supports the surface charge compensation phenomenon by spontaneous polarization. The pure resistive and β-conductivity contrasts observed in some other grain boundaries are consistent with the existence of n/i/n structure with possible weak depletion layer fields. This n/i/n structure could be interpreted by the presence of
 ${{\rm{V''}}_{{\rm{Ba}}}}$-rich grain boundary layers.
ACKNOWLEDGMENTS
The author gratefully acknowledges the financial support from Japan Society for Promotion of Science (JSPS) and the Nippon Sheet Glass Foundation.