1 Introduction
The high-pressure and -temperature fields inside a collapsing bubble have been studied for almost a century (Rayleigh Reference Rayleigh1917; Plesset & Prosperetti Reference Plesset and Prosperetti1977; Brennen Reference Brennen1995). Recently, the occurrence of shock waves inside the collapsing vapour bubble was observed (Magaletti, Marino & Casciola Reference Magaletti, Marino and Casciola2015). Hence, the extreme conditions inside the collapsing bubble are not yet completely clarified. Evaporation and condensation of vapour molecules are well known to play significant roles in such a collapse (e.g. Fujikawa & Akamatsu (Reference Fujikawa and Akamatsu1980), Gumerov (Reference Gumerov2000), Fuster, Hauke & Dopazo (Reference Fuster, Hauke and Dopazo2010), Lauer et al. (Reference Lauer, Hu, Hickel and Andreas2012), Prosperetti (Reference Prosperetti2017)). The difference between the behaviour of the molecules that are incident on and leave from the gas–liquid interface is essential for evaporation/condensation. However, vapour flow cannot be accurately described in classical fluid dynamics systems on the assumption of a local equilibrium. Hence, the analysis of the molecular gas dynamics based on the velocity distribution functions of the vapour molecules is essential to treat non-equilibrium gas flow (Cercignani Reference Cercignani2000; Sone Reference Sone2007). Indeed, useful knowledge regarding this process has already been obtained (for example, see Cercignani Reference Cercignani2000). The governing equation of the velocity distribution function is the Boltzmann equation.
The kinetic boundary condition (KBC) at the gas–liquid interface, which is the boundary condition for the Boltzmann equation at the interface, plays an important role in the region near the interface. Regarding the KBC of vapour, several studies have been performed to determine the rate of evaporation and the reflection of molecules based on molecular simulations in the case of a single-component system (for example, see Frezzotti (Reference Frezzotti2011), Fujikawa, Yano & Watanabe (Reference Fujikawa, Yano and Watanabe2011), Kon, Kobayashi & Watanabe (Reference Kon, Kobayashi and Watanabe2014, Reference Kon, Kobayashi and Watanabe2016, Reference Kon, Kobayashi and Watanabe2017), Kryukov & Levashov (Reference Kryukov and Levashov2016), Frezzotti & Barbante (Reference Frezzotti and Barbante2017)). The key parameter included in the KBC is the so-called condensation coefficient,
 $\unicode[STIX]{x1D714}$
(also called the mass accommodation coefficient). The value of
 $\unicode[STIX]{x1D714}$
is defined as
 $0\leqslant \unicode[STIX]{x1D714}\leqslant 1$
. For a low-temperature liquid (i.e. where the liquid temperature is near the triple point of the substance), the condensation coefficient at a plane surface is almost unity (
 $\unicode[STIX]{x1D714}\approx 1$
). However, in vapour bubble collapse experiments, the value of the condensation coefficient takes a lower value (
 $\unicode[STIX]{x1D714}=O(10^{-2})$
) (for example, see Akhatov et al. (Reference Akhatov, Lindau, Topolnikov, Mettin, Vakhitova and Lauterborn2001)). Hence, there is room to discuss differences in the results between molecular simulation and bubble collapse problems.
There are many factors pertaining to the difference in
 $\unicode[STIX]{x1D714}$
between a molecular simulation and bubble collapse experiments. In this paper, we focus on the influence of non-condensable molecules (NC gas molecules) contained in the vapour bubble. A new method was recently proposed for constructing the KBCs for a NC gas–vapour binary mixture in equilibrium using molecular dynamics (MD) simulations (Kobayashi et al.
Reference Kobayashi, Sasaki, Kon, Fujii and Watanabe2017). The results of this research showed that the value of the condensation coefficient decreased with an increase in the number of NC gas molecules in the vapour phase because of the obstacle of the evaporation/condensation of the vapour molecules by the adsorbed film of the NC gas molecules at the interface. These results also indicated that the value of the condensation coefficient can change when the bubble collapses, because the concentration of the NC gas molecules changes inside a collapsing bubble.
For NC gas–vapour bubble dynamics, the dynamics with heat and mass transfers at the bubble wall has been studied extensively (Matsumoto & Takemura Reference Matsumoto and Takemura1994; Kawashima & Kameda Reference Kawashima and Kameda2008; Kreider et al. Reference Kreider, Crum, Bailey and Sapozhnikov2011; Hao, Zhang & Prosperetti Reference Hao, Zhang and Prosperetti2017). However, these studies were conducted based on fluid-dynamics-type equations with a model boundary condition (e.g. the Hertz–Knudsen equation). There are no studies that investigate the NC gas–vapour bubble collapse problem based on the molecular gas dynamics analysis without using the model boundary conditions for fluid-dynamics equation.
Thus, investigating the concentration of NC gas molecules at the bubble wall and the influence of condensation coefficient on the bubble collapse is important in order to elucidate the reason for the differences in results between the molecular simulations and experiments in a vapour bubble collapse. In this study, we performed a numerical simulation by combining an analysis of the dynamics of a spherical bubble and molecular gas dynamics in order to replicate the evaporation/condensation vapour flow inside the bubble. We can treat the non-equilibrium phenomena at the bubble wall precisely based on the analysis of the Boltzmann equation, e.g. temperature jump due to evaporation/condensation.
First, we simulated a spherical bubble collapse with several constant values for the condensation coefficient. From these simulations, we clarified the influence of the value of the condensation coefficient on the bubble collapse. Furthermore, we investigated the influence of the initial vapour concentration and initial bubble radius on the bubble collapse. We then studied the drift of the NC gas molecules at the bubble wall when the bubble collapses and its influence on the condensation coefficient.
2 Problem setting
Here, we deal with the collapse of a spherical bubble. Figure 1 shows a numerical model for the present study. A spherical symmetrical bubble exists in an infinite region of liquid. The radial coordinate
 $r$
is defined from the centre of the bubble, and the problem is solved numerically as spherically symmetric, where physical quantities vary with respect to
 $r$
. The bubble is filled with NC gas and vapour. We consider the problem that the initial bubble begins to collapse from the elevation of the surrounding liquid pressure.
The initial temperatures of both the NC gas–vapour mixture and the liquid phase are uniformly
 $T_{0}$
. The initial bubble radius is
 $R_{0}$
(
 $=1\times l_{0}^{v}$
,
 $10\times l_{0}^{v}$
or
 $50\times l_{0}^{v}$
), where
 $l_{0}^{v}$
is the initial mean free path of the vapour molecules in the bubble (e.g. for water vapour at 300 K and the saturated vapour pressure,
 $l_{0}^{v}$
is approximately
 $1.8~\unicode[STIX]{x03BC}\text{m}$
). Hence, the bubble in this simulation is a micro-sized bubble. The liquid pressure at infinity
 $p_{\ell \infty }$
is set to
 $p_{\ell \infty }/p_{0}=5.0$
, where
 $p_{0}$
is the total pressure of the gas mixture inside the bubble at the initial condition, and
 $p_{0}=p_{0}^{v}+p_{0}^{g}$
, where
 $p_{0}^{v}$
is the initial vapour pressure taken to be the saturated vapour pressure at the initial temperature, and
 $p_{0}^{g}$
is the initial NC gas pressure. The initial number density ratio of the vapour and the NC gas is an important factor. We investigate the ratio as
 $N_{0}=n_{0}^{g}/n_{0}^{v}=9.0,1.0,0.5$
and 0.11, where
 $n_{0}^{g}$
is the initial number density of NC gas, and
 $n_{0}^{v}$
is that of vapour. Here,
 $n_{0}^{v}$
is the number density of the saturated vapour in all the simulations. For simplicity, we assume that the NC gas molecules are mechanically identical to those of the vapour. Therefore, the molecular mass of the vapour and the NC gas is the same, as is the diameter.
3 Equation of the radial motion of the bubble
The bubble radial motion accompanied with vapour evaporation and condensation is governed by Fujikawa & Akamatsu’s equation (Fujikawa & Akamatsu Reference Fujikawa and Akamatsu1980):
 $$\begin{eqnarray}\displaystyle & & \displaystyle R\ddot{R}\left(1-{\displaystyle \frac{2{\dot{R}}}{c_{\ell \infty }}}+{\displaystyle \frac{\dot{{\mathcal{M}}}^{v}}{\unicode[STIX]{x1D70C}_{\ell \infty }c_{\ell \infty }}}\right)+{\displaystyle \frac{3}{2}}{\dot{R}}^{2}\left(1+{\displaystyle \frac{4\dot{{\mathcal{M}}}^{v}}{3\unicode[STIX]{x1D70C}_{\ell \infty }c_{\ell \infty }}}-{\displaystyle \frac{4{\dot{R}}}{3c_{\ell \infty }}}\right)\nonumber\\ \displaystyle & & \displaystyle \quad -\,{\displaystyle \frac{\ddot{{\mathcal{M}}}^{v}R}{\unicode[STIX]{x1D70C}_{\ell \infty }}}\left(1-{\displaystyle \frac{2{\dot{R}}}{c_{\ell \infty }}}+{\displaystyle \frac{\dot{{\mathcal{M}}}^{v}}{\unicode[STIX]{x1D70C}_{\ell \infty }c_{\ell \infty }}}\right)-{\displaystyle \frac{\dot{{\mathcal{M}}}^{v}}{\unicode[STIX]{x1D70C}_{\ell \infty }}}\left({\dot{R}}+{\displaystyle \frac{\dot{{\mathcal{M}}}^{v}}{2\unicode[STIX]{x1D70C}_{\ell \infty }}}\right)\nonumber\\ \displaystyle & & \displaystyle \quad +\,{\displaystyle \frac{p_{\ell \infty }-p_{\ell 1}}{\unicode[STIX]{x1D70C}_{\ell \infty }}}-{\displaystyle \frac{R{\dot{p}}_{\ell 1}}{\unicode[STIX]{x1D70C}_{\ell \infty }c_{\ell \infty }}}=0,\end{eqnarray}$$
where,
 $$\begin{eqnarray}p_{\ell 1}=-{\displaystyle \frac{2\unicode[STIX]{x1D6FE}_{\ell }}{R}}+p_{w}-{\displaystyle \frac{\dot{{\mathcal{M}}}^{v2}(\unicode[STIX]{x1D70C}_{w}-\unicode[STIX]{x1D70C}_{\ell \infty })}{\unicode[STIX]{x1D70C}_{\ell \infty }\unicode[STIX]{x1D70C}_{w}}}-{\displaystyle \frac{4\unicode[STIX]{x1D707}_{\ell }}{R}}\left({\dot{R}}-{\displaystyle \frac{\dot{{\mathcal{M}}}^{v}}{\unicode[STIX]{x1D70C}_{\ell \infty }}}\right),\end{eqnarray}$$
and where
 $R(t)$
is the bubble radius,
 $t$
is the time,
 $\cdot$
denotes the time derivative,
 $c_{\ell \infty }$
is the speed of the sound of the liquid at infinity,
 $\unicode[STIX]{x1D70C}_{\ell \infty }$
is the density of liquid,
 $\unicode[STIX]{x1D6FE}_{\ell }$
is the surface tension coefficient of the liquid,
 $\unicode[STIX]{x1D707}_{\ell }$
is the viscosity coefficient of the liquid,
 $\dot{{\mathcal{M}}}^{v}$
is the mass flux passing through the interface induced by the phase change and
 $p_{w}$
and
 $\unicode[STIX]{x1D70C}_{w}$
are the total gas pressure and density composed of the NC gas and the vapour at the bubble wall, respectively. The parameter
 $\dot{{\mathcal{M}}}^{v}$
has a positive value when evaporation occurs. Here,
 $\dot{{\mathcal{M}}}^{v}$
,
 $p_{w}$
and
 $\unicode[STIX]{x1D70C}_{w}$
can be obtained from the simulation of the molecular gas dynamics using the Boltzmann equation for the binary gas mixture inside the bubble.
Schematic model of the present study.

Heat conduction in the liquid phase is solved by coupling the radial motion equation of the bubble.
 $$\begin{eqnarray}\displaystyle {\displaystyle \frac{\unicode[STIX]{x2202}T_{\ell }}{\unicode[STIX]{x2202}t}}+v_{\ell }\displaystyle {\displaystyle \frac{\unicode[STIX]{x2202}T_{\ell }}{\unicode[STIX]{x2202}r}}=D_{\ell }\left(\displaystyle {\displaystyle \frac{\unicode[STIX]{x2202}^{2}T_{\ell }}{\unicode[STIX]{x2202}r^{2}}}+{\displaystyle \frac{2}{r}}\displaystyle {\displaystyle \frac{\unicode[STIX]{x2202}T_{\ell }}{\unicode[STIX]{x2202}r}}\right),\end{eqnarray}$$
where
 $T_{\ell }$
is the liquid temperature,
 $v_{\ell }$
is the liquid velocity and
 $D_{\ell }$
is the thermal diffusion coefficient of the liquid. The values of water at 300 K are utilized herein for
 $\unicode[STIX]{x1D70C}_{\ell \infty }$
,
 $\unicode[STIX]{x1D6FE}_{\ell }$
,
 $\unicode[STIX]{x1D707}_{\ell }$
and
 $D_{\ell }$
.
The boundary conditions for (3.3) at the bubble wall are given as follows:
 $$\begin{eqnarray}\unicode[STIX]{x1D706}_{\ell }{\displaystyle \frac{\unicode[STIX]{x2202}T_{\ell }}{\unicode[STIX]{x2202}r}}\bigg|_{r=R}=\dot{{\mathcal{M}}}^{v}L+q_{r},\end{eqnarray}$$
where
 $\unicode[STIX]{x1D706}_{\ell }$
is the thermal conductivity of the liquid,
 $L$
denotes latent heat and
 $q_{r}$
is the heat flux from the bubble at the bubble wall. The temperature during the liquid phase far from the interface is fixed at the initial condition as follows:
 $$\begin{eqnarray}T_{\ell }=T_{0},\quad (r=500\ell _{0}^{v}).\end{eqnarray}$$
4 Governing equation of the NC gas and vapour
4.1 Velocity distribution function
The only unknown variable when analysing the molecular gas dynamics is the velocity distribution function,
 $f$
. We use a spherical coordinate expression,
 $f(\boldsymbol{r},\boldsymbol{\unicode[STIX]{x1D701}},t)$
, where
 $t$
denotes time,
 $\boldsymbol{r}=(r,\unicode[STIX]{x1D703},\unicode[STIX]{x1D711})$
is the physical coordinate and
 $\boldsymbol{\unicode[STIX]{x1D701}}=(\unicode[STIX]{x1D701}_{r},\unicode[STIX]{x1D701}_{\unicode[STIX]{x1D703}},\unicode[STIX]{x1D701}_{\unicode[STIX]{x1D711}})$
is the molecular velocity. The following transformation of the molecular velocity is utilized for the spherical symmetric problem (Sone Reference Sone2007):
 $$\begin{eqnarray}\unicode[STIX]{x1D701}_{r}=\unicode[STIX]{x1D701}\cos \unicode[STIX]{x1D703}_{\unicode[STIX]{x1D701}},\quad \unicode[STIX]{x1D701}_{\unicode[STIX]{x1D703}}=\unicode[STIX]{x1D701}\sin \unicode[STIX]{x1D703}_{\unicode[STIX]{x1D701}}\cos \unicode[STIX]{x1D713},\quad \unicode[STIX]{x1D701}_{\unicode[STIX]{x1D711}}=\unicode[STIX]{x1D701}\sin \unicode[STIX]{x1D703}_{\unicode[STIX]{x1D701}}\sin \unicode[STIX]{x1D713},\end{eqnarray}$$
where the ranges of
 $\unicode[STIX]{x1D701},\unicode[STIX]{x1D703}_{\unicode[STIX]{x1D701}}$
and
 $\unicode[STIX]{x1D713}$
are
 $0\leqslant \unicode[STIX]{x1D701}<\infty$
,
 $0\leqslant \unicode[STIX]{x1D703}_{\unicode[STIX]{x1D701}}<\unicode[STIX]{x03C0}$
and
 $0\leqslant \unicode[STIX]{x1D713}<2\unicode[STIX]{x03C0}$
, respectively. In this study, the bubble collapse is spherically symmetric; hence, the velocity distribution function
 $f$
is independent of
 $\unicode[STIX]{x1D713}$
. Therefore,
 $f$
is treated as a function of
 $r$
,
 $\unicode[STIX]{x1D701}$
and
 $\unicode[STIX]{x1D703}_{\unicode[STIX]{x1D701}}$
.
Macroscopic quantities, such as density, gas velocity and pressure, can be obtained only if the velocity distribution function is determined. Two velocity distribution functions (viz.,
 $f^{v}(r,\unicode[STIX]{x1D701},\unicode[STIX]{x1D703}_{\unicode[STIX]{x1D701}},t)$
and
 $f^{g}(r,\unicode[STIX]{x1D701},\unicode[STIX]{x1D703}_{\unicode[STIX]{x1D701}},t)$
) for the vapour and the NC gas are utilized herein.
4.2 Macroscopic quantities
The macroscopic quantities of each component (vapour or NC gas) are obtained from the following equations:
 $$\begin{eqnarray}\displaystyle & \displaystyle n^{\unicode[STIX]{x1D6FC}}=2\unicode[STIX]{x03C0}\iint f^{\unicode[STIX]{x1D6FC}}\unicode[STIX]{x1D701}^{2}\sin \unicode[STIX]{x1D703}_{\unicode[STIX]{x1D701}}\,\text{d}\unicode[STIX]{x1D701}\,\text{d}\unicode[STIX]{x1D703}_{\unicode[STIX]{x1D701}}, & \displaystyle\end{eqnarray}$$
 $$\begin{eqnarray}\displaystyle & \displaystyle \unicode[STIX]{x1D70C}^{\unicode[STIX]{x1D6FC}}=m^{\unicode[STIX]{x1D6FC}}n^{\unicode[STIX]{x1D6FC}}, & \displaystyle\end{eqnarray}$$
 $$\begin{eqnarray}\displaystyle & \displaystyle v_{r}^{\unicode[STIX]{x1D6FC}}={\displaystyle \frac{2\unicode[STIX]{x03C0}}{n^{\unicode[STIX]{x1D6FC}}}}\iint f^{\unicode[STIX]{x1D6FC}}\unicode[STIX]{x1D701}^{3}\cos \unicode[STIX]{x1D703}_{\unicode[STIX]{x1D701}}\sin \unicode[STIX]{x1D703}_{\unicode[STIX]{x1D701}}\,\text{d}\unicode[STIX]{x1D701}\,\text{d}\unicode[STIX]{x1D703}_{\unicode[STIX]{x1D701}}, & \displaystyle\end{eqnarray}$$
 $$\begin{eqnarray}\displaystyle & \displaystyle T^{\unicode[STIX]{x1D6FC}}={\displaystyle \frac{1}{3kn^{\unicode[STIX]{x1D6FC}}}}\left(2\unicode[STIX]{x03C0}m^{\unicode[STIX]{x1D6FC}}\iint f^{\unicode[STIX]{x1D6FC}}\unicode[STIX]{x1D701}^{4}\sin \unicode[STIX]{x1D703}_{\unicode[STIX]{x1D701}}\,\text{d}\unicode[STIX]{x1D701}\,\text{d}\unicode[STIX]{x1D703}_{\unicode[STIX]{x1D701}}-\unicode[STIX]{x1D70C}^{\unicode[STIX]{x1D6FC}}v_{r}^{\unicode[STIX]{x1D6FC}2}\right), & \displaystyle\end{eqnarray}$$
 $$\begin{eqnarray}\displaystyle & \displaystyle p^{\unicode[STIX]{x1D6FC}}=n^{\unicode[STIX]{x1D6FC}}kT^{\unicode[STIX]{x1D6FC}}, & \displaystyle\end{eqnarray}$$
 $$\begin{eqnarray}\displaystyle & \displaystyle q_{r}^{\unicode[STIX]{x1D6FC}}=-2\unicode[STIX]{x03C0}m^{\unicode[STIX]{x1D6FC}}\iint f^{\unicode[STIX]{x1D6FC}}\unicode[STIX]{x1D701}^{2}(\unicode[STIX]{x1D701}\cos \unicode[STIX]{x1D703}_{\unicode[STIX]{x1D701}}-v_{r}^{\unicode[STIX]{x1D6FC}})(\unicode[STIX]{x1D701}^{2}+v_{r}^{2}-2v_{r}\unicode[STIX]{x1D701}\cos \unicode[STIX]{x1D703}_{\unicode[STIX]{x1D701}})\,\text{d}\unicode[STIX]{x1D701}\,\text{d}\unicode[STIX]{x1D703}_{\unicode[STIX]{x1D701}}\equiv \unicode[STIX]{x1D706}_{\unicode[STIX]{x1D6FC}}{\displaystyle \frac{\unicode[STIX]{x2202}T^{\unicode[STIX]{x1D6FC}}}{\unicode[STIX]{x2202}r}},\quad & \displaystyle\end{eqnarray}$$
where subscript
 $\unicode[STIX]{x1D6FC}=v$
denotes vapour, and
 $\unicode[STIX]{x1D6FC}=g$
is the NC gas. Here,
 $n^{\unicode[STIX]{x1D6FC}}$
,
 $\unicode[STIX]{x1D70C}^{\unicode[STIX]{x1D6FC}}$
,
 $v_{r}^{\unicode[STIX]{x1D6FC}}$
,
 $T^{\unicode[STIX]{x1D6FC}}$
,
 $p^{\unicode[STIX]{x1D6FC}}$
and
 $q_{r}^{\unicode[STIX]{x1D6FC}}$
are the number density, density, radial flow velocity, temperature, pressure and heat flux of each component gas, respectively. Further,
 $m^{\unicode[STIX]{x1D6FC}}$
is the molecular mass, and
 $k$
is the Boltzmann constant. The integration with respect to
 $\unicode[STIX]{x1D701}$
and
 $\unicode[STIX]{x1D703}_{\unicode[STIX]{x1D701}}$
is performed over the
 $0\leqslant \unicode[STIX]{x1D701}<\infty$
and
 $0\leqslant \unicode[STIX]{x1D703}_{\unicode[STIX]{x1D701}}\leqslant \unicode[STIX]{x03C0}$
domains. The integration with respect to
 $\unicode[STIX]{x1D713}$
has already been conducted.
4.3 The Boltzmann equation for the binary gas mixture
The Boltzmann equation is the governing equation for the velocity distribution function. The vapour and the NC gas herein are governed by the Andries–Aoki–Perthame model (Andries, Aoki & Perthame Reference Andries, Aoki and Perthame2002) for its collision term. The molecules of each component are treated as a monoatomic gas by this model restriction.
The governing equation for
 $f^{\unicode[STIX]{x1D6FC}}(r,\unicode[STIX]{x1D701},\unicode[STIX]{x1D703}_{\unicode[STIX]{x1D701}},t)$
for the
 $\unicode[STIX]{x1D6FC}$
component
 $(\unicode[STIX]{x1D6FC}=v,g)$
is
 $$\begin{eqnarray}{\displaystyle \frac{\unicode[STIX]{x2202}f^{\unicode[STIX]{x1D6FC}}}{\unicode[STIX]{x2202}t}}+\unicode[STIX]{x1D701}\cos \unicode[STIX]{x1D703}_{\unicode[STIX]{x1D701}}{\displaystyle \frac{\unicode[STIX]{x2202}f^{\unicode[STIX]{x1D6FC}}}{\unicode[STIX]{x2202}r}}-{\displaystyle \frac{\unicode[STIX]{x1D701}\sin \unicode[STIX]{x1D703}_{\unicode[STIX]{x1D701}}}{r}}{\displaystyle \frac{\unicode[STIX]{x2202}f^{\unicode[STIX]{x1D6FC}}}{\unicode[STIX]{x2202}\unicode[STIX]{x1D703}_{\unicode[STIX]{x1D701}}}}=J_{M}^{\unicode[STIX]{x1D6FC}}+J_{M}^{\unicode[STIX]{x1D6FD}\unicode[STIX]{x1D6FC}},\end{eqnarray}$$
where,
 $$\begin{eqnarray}\displaystyle & \displaystyle J_{M}^{\unicode[STIX]{x1D6FC}}=K_{M}^{\unicode[STIX]{x1D6FC}}n^{\unicode[STIX]{x1D6FC}}\left[M^{\unicode[STIX]{x1D6FC}}\left(\unicode[STIX]{x1D701},\unicode[STIX]{x1D703}_{\unicode[STIX]{x1D701}},v_{r}^{\unicode[STIX]{x1D6FC}},{\displaystyle \frac{kT^{\unicode[STIX]{x1D6FC}}}{m^{\unicode[STIX]{x1D6FC}}}}\right)-f^{\unicode[STIX]{x1D6FC}}\right], & \displaystyle\end{eqnarray}$$
 $$\begin{eqnarray}\displaystyle & \displaystyle J_{M}^{\unicode[STIX]{x1D6FD}\unicode[STIX]{x1D6FC}}=K_{M}^{\unicode[STIX]{x1D6FD}\unicode[STIX]{x1D6FC}}n^{\unicode[STIX]{x1D6FD}}\left[M^{\unicode[STIX]{x1D6FC}}\left(\unicode[STIX]{x1D701},\unicode[STIX]{x1D703}_{\unicode[STIX]{x1D701}},{v_{r}}^{(\unicode[STIX]{x1D6FC})},{\displaystyle \frac{kT^{(\unicode[STIX]{x1D6FC})}}{m^{\unicode[STIX]{x1D6FC}}}}\right)-f^{\unicode[STIX]{x1D6FC}}\right], & \displaystyle\end{eqnarray}$$
 $$\begin{eqnarray}\displaystyle & \displaystyle M^{\unicode[STIX]{x1D6FC}}={\displaystyle \frac{n^{\unicode[STIX]{x1D6FC}}}{\left(2\unicode[STIX]{x03C0}{\displaystyle \frac{k}{m^{\unicode[STIX]{x1D6FC}}}}T^{\unicode[STIX]{x1D6FC}}\right)^{3/2}}}\exp \left(-{\displaystyle \frac{\unicode[STIX]{x1D701}^{2}+v_{r}^{2}-2v_{r}\unicode[STIX]{x1D701}\cos \unicode[STIX]{x1D703}_{\unicode[STIX]{x1D701}}}{2{\displaystyle \frac{k}{m^{\unicode[STIX]{x1D6FC}}}}T^{\unicode[STIX]{x1D6FC}}}}\right), & \displaystyle\end{eqnarray}$$
 $$\begin{eqnarray}\displaystyle & \displaystyle v_{r}^{(\unicode[STIX]{x1D6FC})}=v_{r}^{\unicode[STIX]{x1D6FC}}+2{\displaystyle \frac{\unicode[STIX]{x1D712}_{M}^{\unicode[STIX]{x1D6FD}\unicode[STIX]{x1D6FC}}}{K_{M}^{\unicode[STIX]{x1D6FD}\unicode[STIX]{x1D6FC}}}}{\displaystyle \frac{m^{\unicode[STIX]{x1D6FD}}}{m^{\unicode[STIX]{x1D6FD}}+m^{\unicode[STIX]{x1D6FC}}}}(v_{r}^{\unicode[STIX]{x1D6FD}}-v_{r}^{\unicode[STIX]{x1D6FC}}), & \displaystyle\end{eqnarray}$$
 $$\begin{eqnarray}\displaystyle & \displaystyle T^{(\unicode[STIX]{x1D6FC})}=T^{\unicode[STIX]{x1D6FC}}-{\displaystyle \frac{m^{\unicode[STIX]{x1D6FC}}}{3k}}{|v_{r}^{(\unicode[STIX]{x1D6FC})}-v_{r}^{\unicode[STIX]{x1D6FC}}|}^{2}+2{\displaystyle \frac{\unicode[STIX]{x1D712}_{M}^{\unicode[STIX]{x1D6FD}\unicode[STIX]{x1D6FC}}}{K_{M}^{\unicode[STIX]{x1D6FD}\unicode[STIX]{x1D6FC}}}}{\displaystyle \frac{m^{\unicode[STIX]{x1D6FD}}}{(m^{\unicode[STIX]{x1D6FD}}+m^{\unicode[STIX]{x1D6FC}})^{2}}}\left(T^{\unicode[STIX]{x1D6FD}}-T^{\unicode[STIX]{x1D6FC}}+{\displaystyle \frac{m^{\unicode[STIX]{x1D6FD}}}{3k}}{|v_{r}^{\unicode[STIX]{x1D6FD}}-v_{r}^{\unicode[STIX]{x1D6FC}}|}^{2}\right),\qquad \quad & \displaystyle\end{eqnarray}$$
and where
 $\unicode[STIX]{x1D6FD}$
is
 $\unicode[STIX]{x1D6FD}=g$
if
 $\unicode[STIX]{x1D6FC}$
is
 $\unicode[STIX]{x1D6FC}=v$
. Here,
 $J_{M}^{\unicode[STIX]{x1D6FC}}$
denotes the term according to the molecular collision of the
 $\unicode[STIX]{x1D6FC}$
–
 $\unicode[STIX]{x1D6FC}$
molecules, while
 $J_{M}^{\unicode[STIX]{x1D6FD}\unicode[STIX]{x1D6FC}}$
denotes that according to the molecular collision of the
 $\unicode[STIX]{x1D6FC}$
–
 $\unicode[STIX]{x1D6FD}$
molecules. Further,
 $K_{M}^{\unicode[STIX]{x1D6FC}}$
and
 $K_{M}^{\unicode[STIX]{x1D6FD}\unicode[STIX]{x1D6FC}}$
are the positive constants involved in the collision frequency of the molecules. Finally,
 $M^{\unicode[STIX]{x1D6FC}}$
is the Maxwell distribution, and
 $\unicode[STIX]{x1D712}_{M}^{\unicode[STIX]{x1D6FD}\unicode[STIX]{x1D6FC}}$
is a positive constant related to the moment of collision.
 $0<\unicode[STIX]{x1D712}_{M}^{\unicode[STIX]{x1D6FD}\unicode[STIX]{x1D6FC}}\leqslant K_{M}^{\unicode[STIX]{x1D6FD}\unicode[STIX]{x1D6FC}}$
is required for positive
 $T^{(\unicode[STIX]{x1D6FC})}$
. Hence, we set
 $\unicode[STIX]{x1D712}_{M}^{\unicode[STIX]{x1D6FD}\unicode[STIX]{x1D6FC}}=K_{M}^{\unicode[STIX]{x1D6FD}\unicode[STIX]{x1D6FC}}=K_{M}^{\unicode[STIX]{x1D6FC}}$
in the present simulation. The assumption
 $K_{M}^{\unicode[STIX]{x1D6FD}\unicode[STIX]{x1D6FC}}=K_{M}^{\unicode[STIX]{x1D6FC}}$
is suitable because the vapour and NC gas molecules are identical in this simulation.
The following transformation of the radial coordinate inside the bubble is introduced for the numerical simulation:
 $$\begin{eqnarray}\unicode[STIX]{x1D712}={\displaystyle \frac{r}{R}}.\end{eqnarray}$$
The range of
 $\unicode[STIX]{x1D712}$
is always
 $(0\leqslant \unicode[STIX]{x1D712}\leqslant 1)$
, and
 $\unicode[STIX]{x1D712}=1$
denotes the bubble wall. From the above equation, we can obtain the following relation:
 $$\begin{eqnarray}{\displaystyle \frac{\unicode[STIX]{x2202}f^{\unicode[STIX]{x1D6FC}}(r,\unicode[STIX]{x1D701},\unicode[STIX]{x1D703}_{\unicode[STIX]{x1D701}},t)}{\unicode[STIX]{x2202}t}}={\displaystyle \frac{\unicode[STIX]{x2202}f^{\unicode[STIX]{x1D6FC}}(\unicode[STIX]{x1D712},\unicode[STIX]{x1D701},\unicode[STIX]{x1D703}_{\unicode[STIX]{x1D701}},t)}{\unicode[STIX]{x2202}t}}-{\displaystyle \frac{\text{d}R}{\text{d}t}}{\displaystyle \frac{\unicode[STIX]{x1D712}}{R}}{\displaystyle \frac{\unicode[STIX]{x2202}f^{\unicode[STIX]{x1D6FC}}(\unicode[STIX]{x1D712},\unicode[STIX]{x1D701},\unicode[STIX]{x1D703}_{\unicode[STIX]{x1D701}},t)}{\unicode[STIX]{x2202}\unicode[STIX]{x1D712}}},\end{eqnarray}$$
where
 $\text{d}R/\text{d}t$
is redefined as the following relation by considering the mass conservation due to evaporation or condensation at the bubble wall (Fujikawa & Akamatsu Reference Fujikawa and Akamatsu1980; Fujikawa et al.
Reference Fujikawa, Yano and Watanabe2011):
 $$\begin{eqnarray}{\displaystyle \frac{\text{d}R}{\text{d}t}}\equiv v_{w}={\dot{R}}-{\displaystyle \frac{\dot{{\mathcal{M}}}^{v}}{\unicode[STIX]{x1D70C}_{\ell \infty }}}.\end{eqnarray}$$
Hence, equation (4.8) is rewritten using (4.14), (4.15), and (4.16) as follows:
 $$\begin{eqnarray}\displaystyle {\displaystyle \frac{\unicode[STIX]{x2202}f^{\unicode[STIX]{x1D6FC}}}{\unicode[STIX]{x2202}t}}+\left({\displaystyle \frac{\unicode[STIX]{x1D701}\cos \unicode[STIX]{x1D703}_{\unicode[STIX]{x1D701}}}{R}}-{\displaystyle \frac{v_{w}}{R}}\unicode[STIX]{x1D712}\right){\displaystyle \frac{\unicode[STIX]{x2202}f^{\unicode[STIX]{x1D6FC}}}{\unicode[STIX]{x2202}\unicode[STIX]{x1D712}}}-{\displaystyle \frac{\unicode[STIX]{x1D701}\sin \unicode[STIX]{x1D703}_{\unicode[STIX]{x1D701}}}{R\unicode[STIX]{x1D712}}}{\displaystyle \frac{\unicode[STIX]{x2202}f^{\unicode[STIX]{x1D6FC}}}{\unicode[STIX]{x2202}\unicode[STIX]{x1D703}_{\unicode[STIX]{x1D701}}}}=J_{M}^{\unicode[STIX]{x1D6FC}}+J_{M}^{\unicode[STIX]{x1D6FD}\unicode[STIX]{x1D6FC}}.\end{eqnarray}$$
(a) Molecular mass fluxes of vapour at the gas–liquid interface (bubble wall). (b) Normalized velocity distribution function of vapour molecules at the vapour–liquid interface for radial direction when the bubble collapses.

4.4 Kinetic boundary conditions of the Boltzmann equation for the binary gas mixture
The general form of the kinetic boundary conditions (KBCs) for (4.17) at the bubble wall for the vapour and the NC gas are given as follows:
 $$\begin{eqnarray}\displaystyle & \displaystyle f_{\mathit{out}}^{v}=[\unicode[STIX]{x1D714}_{\mathit{e}}n_{\ast }^{v}+(1-\unicode[STIX]{x1D714}_{\mathit{c}})\unicode[STIX]{x1D70E}_{w}^{v}]\,\hat{f}_{\ast }^{v}(T_{\ell w},v_{w}),\quad \text{for }\unicode[STIX]{x1D701}\cos \unicode[STIX]{x1D703}_{\unicode[STIX]{x1D701}}-v_{w}<0, & \displaystyle\end{eqnarray}$$
 $$\begin{eqnarray}\displaystyle & \displaystyle f_{\mathit{out}}^{g}=\unicode[STIX]{x1D70E}_{w}^{g}\,\hat{f}\,_{\ast }^{g}(T_{\ell w},v_{w}),\quad \text{for }\unicode[STIX]{x1D701}\cos \unicode[STIX]{x1D703}_{\unicode[STIX]{x1D701}}-v_{w}<0, & \displaystyle\end{eqnarray}$$
where
 $f_{\mathit{out}}^{v}$
and
 $f_{\mathit{out}}^{g}$
are the boundary conditions for the Boltzmann equation. The validity of
 $f_{\mathit{out}}^{v}$
was confirmed by several previous papers (e.g. Frezzotti (Reference Frezzotti2011), Fujikawa et al. (Reference Fujikawa, Yano and Watanabe2011), Kon et al. (Reference Kon, Kobayashi and Watanabe2014)). Terms
 $\hat{f}_{\ast }^{v}$
and
 $\hat{f}_{\ast }^{g}$
are the normalized Maxwell distribution of the liquid temperature at the bubble wall
 $T_{\ell w}(=T_{\ell }(r=R))$
and
 $v_{w}$
,
 $\hat{f}_{\ast }^{\unicode[STIX]{x1D6FC}}$
is written as
 $$\begin{eqnarray}\hat{f}_{\ast }^{\unicode[STIX]{x1D6FC}}={\displaystyle \frac{1}{\left(2\unicode[STIX]{x03C0}{\displaystyle \frac{k}{m^{\unicode[STIX]{x1D6FC}}}}T_{\ell w}\right)^{3/2}}}\exp \left(-{\displaystyle \frac{\unicode[STIX]{x1D701}^{2}+v_{w}^{2}-2v_{w}\unicode[STIX]{x1D701}\cos \unicode[STIX]{x1D703}_{\unicode[STIX]{x1D701}}}{2{\displaystyle \frac{k}{m^{\unicode[STIX]{x1D6FC}}}}T_{\ell w}}}\right),\end{eqnarray}$$
 $n_{\ast }^{v}$
is the saturated vapour number density at
 $T_{\ell w}$
,
 $\unicode[STIX]{x1D714}_{\mathit{e}}$
is the evaporation coefficient and
 $\unicode[STIX]{x1D714}_{\mathit{c}}$
is the condensation coefficient. The definition of each coefficient using the molecular mass fluxes at the vapour–liquid interface (bubble wall) shown in figure 2(a) (Fujikawa et al.
Reference Fujikawa, Yano and Watanabe2011; Kon et al.
Reference Kon, Kobayashi and Watanabe2014; Kobayashi et al.
Reference Kobayashi, Hori, Kon, Sasaki and Watanabe2016) is written as
 $$\begin{eqnarray}\unicode[STIX]{x1D714}_{\mathit{e}}={\displaystyle \frac{J_{\mathit{evap}}^{v}}{J_{\mathit{out}\ast }^{v}}}={\displaystyle \frac{J_{\mathit{evap}}^{v}}{m^{v}n_{\ast }^{v}\sqrt{{\displaystyle \frac{{\displaystyle \frac{k}{m^{v}}}T_{\ell w}}{2\unicode[STIX]{x03C0}}}}}},\quad \unicode[STIX]{x1D714}_{\mathit{c}}={\displaystyle \frac{J_{\mathit{cond}}^{v}}{J_{\mathit{coll}}^{v}}},\quad (0\leqslant \unicode[STIX]{x1D714}_{\mathit{e}},\unicode[STIX]{x1D714}_{\mathit{c}}\leqslant 1),\end{eqnarray}$$
where
 $J_{\mathit{out}\ast }^{v}$
is the outgoing molecular mass flux of vapour at the equilibrium state as the function of
 $T_{\ell w}$
,
 $J_{\mathit{evap}}^{v}$
is the evaporating molecular mass flux of vapour,
 $J_{\mathit{cond}}^{v}$
is the condensing molecular mass flux of vapour and
 $J_{\mathit{coll}}^{v}$
is the colliding molecular mass of vapour onto the vapour–liquid interface. The definition of
 $J_{\mathit{coll}}^{v}$
is shown in (4.23).
Several studies using molecular simulation have been performed to obtain the values of
 $J_{\mathit{evap}}^{v}$
and
 $J_{\mathit{cond}}^{v}$
to determine
 $\unicode[STIX]{x1D714}_{\mathit{c}}$
and
 $\unicode[STIX]{x1D714}_{\mathit{e}}$
because the values of
 $J_{\mathit{evap}}^{v}$
and
 $J_{\mathit{cond}}^{v}$
cannot be obtained in the framework of the molecular gas dynamics analysis. From the studies, the values of
 $\unicode[STIX]{x1D714}_{\mathit{c}}$
and
 $\unicode[STIX]{x1D714}_{\mathit{e}}$
take the same value in spite of the difference of the definitions (e.g. Kon et al.
Reference Kon, Kobayashi and Watanabe2017). Hence, we can treat
 $\unicode[STIX]{x1D714}_{\mathit{c}}=\unicode[STIX]{x1D714}_{\mathit{e}}=\unicode[STIX]{x1D714}$
, and call
 $\unicode[STIX]{x1D714}$
the condensation coefficient. We rewrite (4.18):
 $$\begin{eqnarray}f_{\mathit{out}}^{v}=[\unicode[STIX]{x1D714}n_{\ast }^{v}+(1-\unicode[STIX]{x1D714})\unicode[STIX]{x1D70E}_{w}^{v}]\,\hat{f}_{\ast }^{v}(T_{\ell w},v_{w}),\quad \text{for }\unicode[STIX]{x1D701}\cos \unicode[STIX]{x1D703}_{\unicode[STIX]{x1D701}}-v_{w}<0.\end{eqnarray}$$
Here,
 $\unicode[STIX]{x1D714}$
takes a value of approximately 0.9 in a low-temperature liquid, and this is specified by the liquid temperature (Kon et al.
Reference Kon, Kobayashi and Watanabe2017) in a single-component system. In the case of
 $\unicode[STIX]{x1D714}=0$
, equation (4.22) becomes the diffusion reflection condition as shown in (4.19); the vapour molecules behave as NC gas molecules.
The term
 $\unicode[STIX]{x1D70E}_{w}^{\unicode[STIX]{x1D6FC}}(\unicode[STIX]{x1D6FC}=v,~g)$
is defined as follows using the velocity distribution at the bubble wall:
 $$\begin{eqnarray}J_{\mathit{coll}}^{\unicode[STIX]{x1D6FC}}=m^{\unicode[STIX]{x1D6FC}}\unicode[STIX]{x1D70E}_{w}^{\unicode[STIX]{x1D6FC}}\sqrt{{\displaystyle \frac{{\displaystyle \frac{k}{m^{\unicode[STIX]{x1D6FC}}}}T_{\ell w}}{2\unicode[STIX]{x03C0}}}}=2\unicode[STIX]{x03C0}m^{\unicode[STIX]{x1D6FC}}\iint _{\unicode[STIX]{x1D701}cos\unicode[STIX]{x1D703}_{\unicode[STIX]{x1D701}}-v_{w}>0}[\unicode[STIX]{x1D701}\cos \unicode[STIX]{x1D703}_{\unicode[STIX]{x1D701}}-v_{w}]\,f^{\unicode[STIX]{x1D6FC}}\unicode[STIX]{x1D701}^{2}\sin \unicode[STIX]{x1D703}_{\unicode[STIX]{x1D701}}\,\text{d}\unicode[STIX]{x1D701}\,\text{d}\unicode[STIX]{x1D703}_{\unicode[STIX]{x1D701}}.\end{eqnarray}$$
The value of
 $\dot{{\mathcal{M}}}^{v}$
, evaporation/condensation mass flux used in (3.1) and (3.4) is obtained from the velocity distribution function of the vapour at the bubble wall. Figure 2(b) shows an example of the non-equilibrium velocity distribution function of vapour molecules for the radial direction (
 $\bar{\unicode[STIX]{x1D701}}_{r}=\unicode[STIX]{x1D701}_{r}/\sqrt{2kT_{0}/m^{v}}$
) at the bubble wall when the bubble collapses. The red line shows the KBC of vapour molecules at the bubble wall, and the blue line shows the velocity distribution function of colliding molecules from the gas phase to liquid phase. From the figure, we can see that the velocity distribution function is asymmetrical in shape with respect to the non-dimensional
 $\bar{v}_{w}(=v_{w}/\sqrt{2kT_{0}/m^{v}})$
, which means the velocity distribution function of vapour molecules becomes a non-equilibrium one at the bubble wall. In this case, condensation of vapour molecules occurs at the interface. The value of the evaporation/condensation mass flux,
 $\dot{{\mathcal{M}}}^{v}$
, is obtained from this non-equilibrium velocity distribution function at the bubble wall:
 $$\begin{eqnarray}\dot{{\mathcal{M}}}^{v}=J_{\mathit{out}}^{v}-J_{\mathit{coll}}^{v}=J_{\mathit{evap}}^{v}-J_{\mathit{cond}}^{v}=-2\unicode[STIX]{x03C0}m^{v}\iint [\unicode[STIX]{x1D701}\cos \unicode[STIX]{x1D703}_{\unicode[STIX]{x1D701}}-v_{w}]\,f^{v}\unicode[STIX]{x1D701}^{2}\sin \unicode[STIX]{x1D703}_{\unicode[STIX]{x1D701}}\text{d}\unicode[STIX]{x1D701}\,\text{d}\unicode[STIX]{x1D703}_{\unicode[STIX]{x1D701}},\end{eqnarray}$$
where
 $\dot{{\mathcal{M}}}^{v}$
has a positive value when evaporation occurs at the bubble wall to fit the definition of (3.1).
(a) Equilibrium MD simulation results (Kobayashi et al. Reference Kobayashi, Sasaki, Kon, Fujii and Watanabe2017) of the condensation coefficient of vapour molecules as a function of the number density ratio. The snapshot inside the figure shows the MD simulation. The NC gas in the MD simulation is neon, while the vapour is argon. (b) Microscopic view of the number density distributions at the gas–liquid interface.

Figure 3(a) shows the MD simulation results of the NC gas–vapour binary mixture problem (Kobayashi et al.
Reference Kobayashi, Sasaki, Kon, Fujii and Watanabe2017). The condensation coefficient decrease was organized as a function of the solubility of the NC gas molecules in the liquid in the paper. We cannot deal with the solubility of the NC gas molecules in this simulation. Hence, this figure shows the value of the condensation coefficient of vapour rewritten as the function of
 $n_{w}^{g}/n_{w}^{v}=N_{w}$
, where
 $n_{w}^{g}$
is the number density of NC gas at the bubble wall, and
 $n_{w}^{v}$
is the number density of vapour at the bubble wall. We use the data shown in Kobayashi et al. (Reference Kobayashi, Sasaki, Kon, Fujii and Watanabe2017). The MD simulation is an equilibrium calculation and not a bubble collapse problem. Hence, this simulation is shown only as a reference. The vapour molecules in the simulation are argon, while the NC gas molecules are neon. The temperature of the system is
 $T_{\ell }/T_{c}=0.566$
, where
 $T_{c}$
is the critical-point temperature of argon molecules. The value
 $N_{w}=0$
means that this is a pure vapour problem and
 $\unicode[STIX]{x1D714}$
takes a value of approximately 0.9 in a single-component problem. This figure shows that the condensation coefficient of vapour decreases lineally as the value of
 $N_{w}$
increases.
Figure 3(b) shows a microscopic view (at the molecular scale) of the relation between the position of the KBC and the adsorbed film of NC gas at the equilibrium state. The NC gas is dissolved in the liquid in accordance with Henry’s law, and the number density of NC gas takes a higher value at the adsorbed film. As shown in the figure, the position of the KBC in the framework of molecular gas dynamics is not the position of the density transition layer at the liquid surface. The distance between the position of the adsorbed film at the liquid surface and that of the KBC is a few molecular diameters. The value of
 $N_{w}$
is investigated at the position of the KBC, and the value is not the same as that of the adsorbed film. From our previous study (Kobayashi et al.
Reference Kobayashi, Sasaki, Kon, Fujii and Watanabe2017), the value of the condensation coefficient decreases because of the collision between the vapour molecules with the NC gas molecules composed of the adsorbed film.
Symmetrical conditions were utilized as the boundary condition of the Boltzmann equation at the centre of the bubble. From the above setting, we carried out the numerical simulation, as shown in the following sections.
5 Results and discussion
5.1 Influence of the condensation coefficient and initial number density ratio between the NC gas and vapour
Equations (3.1) and (3.3) were numerically solved using the fourth-order Runge–Kutta method and the implicit finite difference method, respectively. Equation (4.17) was solved using a finite difference method (Fujikawa et al.
Reference Fujikawa, Yano and Watanabe2011; Kon et al.
Reference Kon, Kobayashi and Watanabe2014). The Euler method and the second-order upwind method were utilized. The total number of grid elements was 800 000 (160(
 $r$
direction)
 $\times 100$
(
 $\unicode[STIX]{x1D701}$
direction)
 $\times 50$
(
 $\unicode[STIX]{x1D703}_{\unicode[STIX]{x1D701}}$
direction)). Each equation was normalized using
 $l_{0}^{v}$
,
 $\sqrt{2kT_{0}/m^{v}}$
, and the macroscopic quantities of the vapour at the initial state, where
 $\sqrt{2kT_{0}/m^{v}}$
was the most probable speed of vapour molecules in the initial condition.
First, we investigated the general influence of the value of the condensation coefficient on the bubble collapse. Figure 4 shows the time evolution of (i) the bubble radius, (ii) the total gas pressure at the centre of the bubble and (iii) the total vapour mass inside the bubble. In the simulation, the initial number density ratio was
 $N_{0}=1.0$
, and the initial bubble radius was
 $R_{0}=50\times \ell _{0}^{v}$
. The abscissa was normalized by
 $t_{0}$
,
 $$\begin{eqnarray}t_{0}=R_{0}\sqrt{{\displaystyle \frac{\unicode[STIX]{x1D70C}_{\ell \infty }}{\unicode[STIX]{x0394}p_{0}}}},\end{eqnarray}$$
where 0.915
 $t_{0}$
is the Rayleigh collapse time for a vacuum bubble (Rayleigh Reference Rayleigh1917; Brennen Reference Brennen1995), and
 $\unicode[STIX]{x0394}p_{0}=p_{\ell \infty }-p_{0}$
. Each result was obtained by changing the value of
 $\unicode[STIX]{x1D714}$
(
 $\unicode[STIX]{x1D714}=1.0,0.01$
and 0). Figure 4(a) shows that the first minimum bubble radius decreased as the value of
 $\unicode[STIX]{x1D714}$
increased. Moreover, the time the bubble takes to reach its minimum radius, that is, the collapse time,
 $t_{min}$
, reduced with an increase in
 $\unicode[STIX]{x1D714}$
(
 $t_{min}=0.989~t_{0}$
for
 $\unicode[STIX]{x1D714}=0$
, 0.976
 $t_{0}$
for
 $\unicode[STIX]{x1D714}$
= 0.01 and 0.945
 $t_{0}$
for
 $\unicode[STIX]{x1D714}=1.0$
). Hence, as shown in figure 4(b), the maximum total gas pressure increased with
 $\unicode[STIX]{x1D714}$
, caused by the violent bubble collapse.
Time evolution of (a) the bubble radius, (b) the total pressure of gas at the centre of the bubble and (c) the total vapour mass inside the bubble in the case of
 $R_{0}=50\times \ell _{0}^{v}$
,
 $N_{0}=1.0$
and
 $p_{\ell \infty }/p_{0}=5.0$
.

Time evolution of (a) the energy flux due to latent heat of condensation/evaporation
 $-\dot{{\mathcal{M}}}^{v}L$
, (b) heat flux
 $-q_{r}$
and (c) liquid temperature
 $T_{\ell w}$
when the first bubble collapse in the case of
 $R_{0}=50\times \ell _{0}^{v}$
,
 $N_{0}=1.0$
and
 $p_{\ell \infty }/p_{0}=5.0$
.

Snapshots of the density distribution of vapour and NC gas inside the bubble when
 $\unicode[STIX]{x1D714}=1.0$
,
 $R_{0}=50\times \ell _{0}^{v}$
,
 $N_{0}=1.0$
and
 $p_{\ell \infty }/p_{0}=5.0$
: (a) vapour and (b) NC gas, where
 $t_{1}=0.923~t_{0}$
,
 $t_{2}=0.936~t_{0}$
,
 $t_{3}=0.945~t_{0}$
,
 $t_{4}=0.963~t_{0}$
and
 $t_{5}=0.972~t_{0}$
.

The second maximum radius increased more than that of
 $\unicode[STIX]{x1D714}=0.01$
when
 $\unicode[STIX]{x1D714}$
is 1.0 because of the violent bubble rebound from the high pressure caused by the collapse. Figure 4(c) shows the total vapour mass inside the bubble,
 $\mathfrak{M}$
, normalized by
 $\mathfrak{M}_{0}$
during the initial state. In this figure,
 $\mathfrak{M}$
decreased as the bubble collapsed. The mass inside the bubble in the case of
 $\unicode[STIX]{x1D714}=1.0$
rapidly increased after the bubble collapses. This is caused by evaporation at the bubble wall. Evaporation occurred at the bubble wall in the case of
 $\unicode[STIX]{x1D714}$
= 1.0 when the pressure inside the bubble rapidly decreased and became less than the saturated vapour pressure. However, the magnitude of evaporation when
 $\unicode[STIX]{x1D714}$
is small (
 $=0.01$
) became smaller, and
 $\mathfrak{M}$
gradually decreased over time. The mass inside the bubble for
 $\unicode[STIX]{x1D714}=0$
was almost constant. In this case, the vapour mass flux at the bubble wall induced by the phase change became identically zero. However, the mass slightly decreased (by approximately 3 %) because of the numerical error, especially during the final stage of the first bubble collapse.
Figure 5 shows (a) the energy flux due to latent heat of condensation/evaporation
 $-\dot{{\mathcal{M}}}^{v}L$
, (b) heat flux
 $-q_{r}$
and (c) liquid temperature
 $T_{\ell w}$
in the case of first bubble collapse. In this figure, positive fluxes denote the heat transfer from the bubble to the liquid. As shown in the figure, the influence of the latent heat and heat flux became larger with the value of the condensation coefficient because of the violent bubble collapse: the rise of the liquid temperature becomes high with the condensation coefficient. However, the temperature increase is less than 1 %. From the results, we can conclude that the effect of the temperature variation is negligibly small on the condensation coefficient during the bubble collapse in this study.
Next, we show snapshots of the density distribution of the NC gas and vapour when
 $\unicode[STIX]{x1D714}$
is 1.0 in the case of
 $N_{0}=1.0$
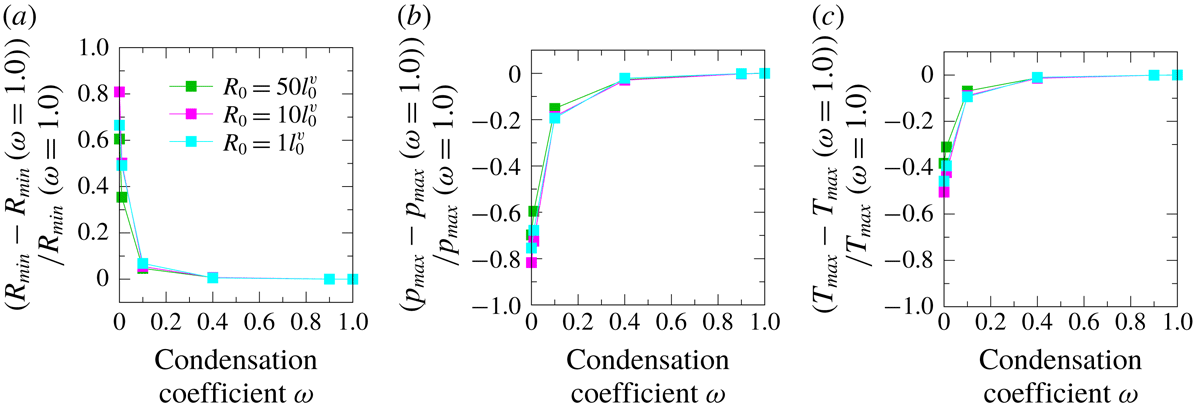
to investigate the molecular distribution of the NC gas and vapour inside the bubble during the final stage of the first bubble collapse, with figure 6 showing (a) the distribution of vapour and (b) that of NC gas. The contour was normalized by the initial number density of vapour,
 $n_{0}^{v}$
. Figure 6(a) shows that the vapour density at the bubble wall decreased with the collapse. The maximum value is shown at the centre of the bubble. Meanwhile, the NC gas density at the bubble wall increased (figure 6
b). The value became more than approximately 300 times larger than the initial number density of vapour at the bubble wall during the final stage of the collapse. Furthermore, a very thin NC gas layer was formed at the bubble wall when
 $t=t_{3}$
. The thickness of the thin NC gas layer was of the order of the mean free path of the gas molecules. This thin gas layer was also observed in the molecular gas dynamics analysis of the condensation flow for vapour and NC gas molecules (Taguchi, Aoki & Takata Reference Taguchi, Aoki and Takata2004). The concentration of the NC gas at the bubble wall decreased after the bubble collapsed. This is a typical example of the molecular behaviour of vapour and NC gas when the bubble collapses.
Relative ratios during the first bubble collapse of (a) the minimum bubble radius, (b) the maximum pressure at the centre of the bubble and (c) the maximum temperature at the centre of the bubble as a function of the condensation coefficient for several initial number density ratios,
 $N_{0}$
. In all simulations,
 $R_{0}=50\ell _{0}^{v}$
and
 $p_{\ell \infty }/p_{0}=5.0$
.

Data for the first bubble collapse with
 $\unicode[STIX]{x1D714}$
= 1.0 for several initial number density ratios, as shown in figure 7: minimum radius, maximum pressure at the centre of the bubble and maximum temperature at the centre of the bubble. In all simulations,
 $R_{0}=50\ell _{0}^{v}$
, and
 $p_{\ell \infty }/p_{0}=5.0$

We investigated the influence of the initial number density ratio,
 $N_{0}$
. Figure 7 shows the relative ratio of (a) the minimum radius,
 $R_{\mathit{min}}$
, (b) the maximum total pressure of the gas mixture at the centre of the bubble,
 $p_{\mathit{max}}$
, and (c) the maximum temperature for binary gas mixture,
 $T_{\mathit{max}}$
, at the centre of the bubble. The blue circle denotes
 $N_{0}=9.0$
, the green square denotes
 $N_{0}=1.0$
, the red triangle represents
 $N_{0}=0.5$
and the purple diamond denotes
 $0.11$
. The ordinate was normalized by the reference value, with each quantity at
 $\unicode[STIX]{x1D714}=1.0$
. Table 1 shows the values. A violent bubble collapse occurs when
 $N_{0}$
decreases, owing to the influence of vapour condensation at the interface.
The minimum bubble radius for
 $N_{0}=9.0$
did not change with the value of
 $\unicode[STIX]{x1D714}$
. Hence, the maximum pressure and temperature did not depend on the value of
 $\unicode[STIX]{x1D714}$
. From these results, we can infer that the saturated vapour pressure of water at atmospheric pressure and room temperature was approximately 3500 Pa. The number density ratio was approximately
 $N_{0}=30$
. The influence of the vapour phase change for the bubble collapse in this case was thus negligibly small, despite the difference in the condensation coefficient.
As the rate of the initial number density of vapour increased, that is,
 $N_{0}$
decreased, the minimum radius, maximum pressure and maximum temperature changed when
 $\unicode[STIX]{x1D714}$
took a smaller value,
 $\unicode[STIX]{x1D714}<0.4$
. By contrast, when
 $\unicode[STIX]{x1D714}>0.4$
, these quantities took constant values. This indicates that the influence is sufficiently small for bubble dynamics when
 $\unicode[STIX]{x1D714}$
changes at a value of 0.4 or more with a bubble collapse.
In order to investigate the reason for the almost constant values when
 $\unicode[STIX]{x1D714}>0.4$
, we investigated the vapour pressure at the bubble wall. Figure 8 shows the temporal evolution of the variation in the vapour pressure at the bubble wall from the initial condition for several
 $\unicode[STIX]{x1D714}$
. The initial number density ratio in all simulations was
 $N_{0}=1.0$
. The vapour pressure for the small
 $\unicode[STIX]{x1D714}$
(
 $=0$
, 0.1) varied with the bubble collapse. By contrast, the vapour pressure for a large
 $\unicode[STIX]{x1D714}$
(
 $=0.4$
, 1.0) kept the same value as the saturated vapour pressure. This result indicates that sufficient vapour condensation occurs at the bubble wall when
 $\unicode[STIX]{x1D714}>0.4$
. Therefore, vapour is not compressed at the bubble wall due to the condensation, and vapour pressure can be treated as a constant value when
 $\unicode[STIX]{x1D714}>0.4$
. As a result, the temporal evolutions of total gas pressure at the bubble wall,
 $p_{w}$
, total gas density,
 $\unicode[STIX]{x1D70C}_{w}$
, and mass flux due to evaporation/condensation,
 $\dot{{\mathcal{M}}}^{v}$
, as shown in (3.1), take almost the same value when
 $\unicode[STIX]{x1D714}>0.4$
, and the solutions of (3.1) become identical. This is the reason for the same tendency when
 $\unicode[STIX]{x1D714}>0.4$
in figure 7.
Temporal evolution of the vapour pressure at the bubble wall as a function of the condensation coefficient. In all simulations,
 $N_{0}=1.0$
,
 $R_{0}=50\ell _{0}^{v}$
and
 $p_{\ell \infty }/p_{0}=5.0$
.
 $p_{\ast }^{v}$
is the saturated vapour pressure.

According to the previous study, with regard to the bubble dynamics of a NC gas–vapour binary mixture, the vapour pressure was treated as a constant value (as a function of the liquid temperature) because ‘evaporation and condensation were very fast compared to the bubble dynamics time scale’ (Chahine, Kapahi & Hsiao Reference Chahine, Kapahi and Hsiao2016). This hypothesis is consistent at the bubble wall with our results when the condensation coefficient is higher than 0.4. However, as shown in figure 6(a), vapour was compressed at the centre of the bubble. A detailed analysis is needed to investigate the precise value inside the bubble when the bubble collapses.
5.2 Influence of the initial bubble radius
Relative ratios during the first bubble collapse of the (a) minimum bubble radius, (b) maximum pressure at the centre of the bubble and (c) maximum temperature at the centre of the bubble as a function of the condensation coefficient for several initial bubble radii. In all simulations,
 $N_{0}=1.0$
and
 $p_{\ell \infty }/p_{0}=5.0$
.

Data for a bubble collapse where
 $\unicode[STIX]{x1D714}$
= 1 for several initial radii, as shown in figure 9: minimum radius, maximum pressure at the centre of the bubble and maximum temperature at the centre of the bubble. In all simulations,
 $N_{0}=1.0$
and
 $p_{\ell \infty }/p_{0}=5.0$
.

We simulated the cases for
 $R_{0}=1\times \ell _{0}^{v}$
,
 $10\times \ell _{0}^{v}$
and
 $50\times \ell _{0}^{v}$
to investigate the influence of the condensation coefficient on several initial bubble radii (figure 9). The initial number density ratio in all cases was
 $N_{0}=1.0$
. As confirmed by Matsumoto & Takemura (Reference Matsumoto and Takemura1994), as the initial bubble radius decreases, a violent bubble collapse occurs. This tendency was organized using the non-dimensional diffusion coefficient between the vapour and the NC gas inside the bubble:
 $$\begin{eqnarray}\bar{D}^{v-g}={\displaystyle \frac{D^{v-g}}{R_{0}\sqrt{{\displaystyle \frac{\unicode[STIX]{x0394}p_{0}}{\unicode[STIX]{x1D70C}_{\ell \infty }}}}}},\end{eqnarray}$$
where
 $D^{v-g}$
is the diffusion coefficient between the vapour and the NC gas. From the above equation, the non-dimensional diffusion coefficient increases when the bubble radius decreases. In this case, the violent bubble collapse is induced (see table 2).
Figure 9 shows in (a) the relative ratio of the minimum radius, (b) the maximum pressure and (c) the maximum temperature at the centre of the bubble for several condensation coefficients. The minimum bubble radius with
 $\unicode[STIX]{x1D714}>0.4$
(figure 9(a)) was almost constant. As shown in the figure, the relative ratio of the minimum radius had the same tendency, despite the difference in the initial bubble radius, that is, in the magnitude of the bubble collapse. As a result, the maximum pressure (b) and the maximum temperature (c) had the same tendencies.
For even smaller bubbles (e.g. so-called nanobubbles), the curvature of the bubble radius influences on the saturated vapour pressure (Kelvin’s equation), the condensation coefficient (Fujikawa et al. Reference Fujikawa, Yano and Watanabe2011) and the surface tension. Hence, the treatment of the dynamics of such bubbles will be more complicated.
We showed the influence of condensation coefficient, initial number density ratio between NC gas and vapour and initial bubble radius on the bubble collapse. There are a lot of parameters for the collapse. For example, the sonoluminescence intensity is affected by the initial liquid temperature,
 $T_{0}$
(Hilgenfeldt, Lohse & Moss Reference Hilgenfeldt, Lohse and Moss1998; Yasui Reference Yasui2001). In this study, the influence of the initial number density ratio on the bubble collapse is related to that of the temperature dependence. However, we did not refer to the other parameters in the present study. The other parameters will be studied in future work.
5.3 NC gas concentration at the bubble wall and condensation coefficient
(a) The number density ratio of
 $n_{w}^{g}(R_{min})/n_{w}^{v}(R_{min})$
at the first bubble collapse for
 $\unicode[STIX]{x1D714}=0.9$
and
 $R_{0}=50\ell _{0}^{v}$
, where
 $n_{w}^{g}(R_{min})$
is the number density of NC gas at the bubble wall when the bubble has a minimum radius, and
 $n_{w}^{v}(R_{\mathit{min}})$
is that of vapour, respectively. (b) Time evolution of
 $N_{w}$
for
 $R_{0}=50\ell _{0}^{v}$
and
 $\unicode[STIX]{x1D714}=0.9$
at the bubble collapse. In all simulations,
 $p_{\ell \infty }/p_{0}=5.0$
.

In our recent study, using an equilibrium molecular dynamics (MD) simulation, the value of the condensation coefficient was shown to decrease with an increase in the number of NC gas molecules in the vapour phase (Kobayashi et al.
Reference Kobayashi, Sasaki, Kon, Fujii and Watanabe2017). We investigated the ratio of the number density of the NC gas and vapour molecules at the bubble wall during the final stage of the first bubble collapse,
 $n_{w}^{g}(R_{\mathit{min}})/n_{w}^{v}(R_{\mathit{min}})=N_{w}^{R_{\mathit{min}}}$
, as a function of
 $N_{0}$
for
 $\unicode[STIX]{x1D714}=0.9$
to estimate the influence of the NC gas molecules on the condensation coefficient.
Figure 10(a) shows the relation between
 $N_{w}^{R_{\mathit{min}}}$
and
 $N_{0}$
. The initial bubble radius in this simulation was
 $R_{0}=50\ell _{0}^{v}$
. We can see that the value of
 $N_{w}^{R_{\mathit{min}}}$
increased as the value of
 $N_{0}$
decreased. In the case of a higher
 $N_{0}$
(
 $N_{0}=9.0$
),
 $N_{w}^{R_{\mathit{min}}}$
exceeded 250. Furthermore, with a lower
 $N_{0}$
(
 $N_{0}=0.11$
),
 $N_{w}^{R_{\mathit{min}}}$
became approximately 2700. The reason for this is the violent bubble collapse caused by the increase in vapour concentration in the initial state (see table 1). This result indicates that we cannot neglect the influence of a small number of NC gas molecules in the initial condition on the concentration at the bubble wall when the bubble collapses.
Figure 10(b) shows the time evolution of
 $N_{w}$
during bubble collapse. As shown in figure 10(b), when the bubble had the minimum radius, the value of
 $N_{w}$
took a higher value. In addition, the rise time was fast; the time was approximately 10 times the mean free time of vapour molecules at the initial state.
For reference, we show the equation of the condensation coefficient of vapour from the equilibrium MD simulation of an Ar–Ne system (Kobayashi et al. Reference Kobayashi, Sasaki, Kon, Fujii and Watanabe2017):
 $$\begin{eqnarray}\unicode[STIX]{x1D714}=-0.0347N_{w}+0.8742,\quad (0\leqslant \unicode[STIX]{x1D714}\leqslant 1),\quad {\mathcal{R}}^{2}=0.9985,\end{eqnarray}$$
where
 ${\mathcal{R}}^{2}$
is the coefficient of determination, and when the value of
 $N_{w}\geqslant$
25.1931, the value of
 $\unicode[STIX]{x1D714}$
is zero. As shown in the above equation, the condensation coefficient can be organized as the linear function of
 $N_{w}$
. The condensation coefficient becomes 0.5 when
 $N_{w}$
is approximately 10.8, and the value becomes zero when
 $N_{w}$
is 25.1931. This decrease is caused by the collision between the NC gas molecules composed of the adsorbed film and vapour molecules. As shown in Bird (Reference Bird1994), the collision number is a linear function of the number density; as the number of NC gas molecules increases at the liquid surface, the collision number increases. Even if the molecular species is changed, this tendency does not change. Hence, the linear decrease of the condensation coefficient with respect to the value of
 $N_{w}$
is not dependent on molecular species.
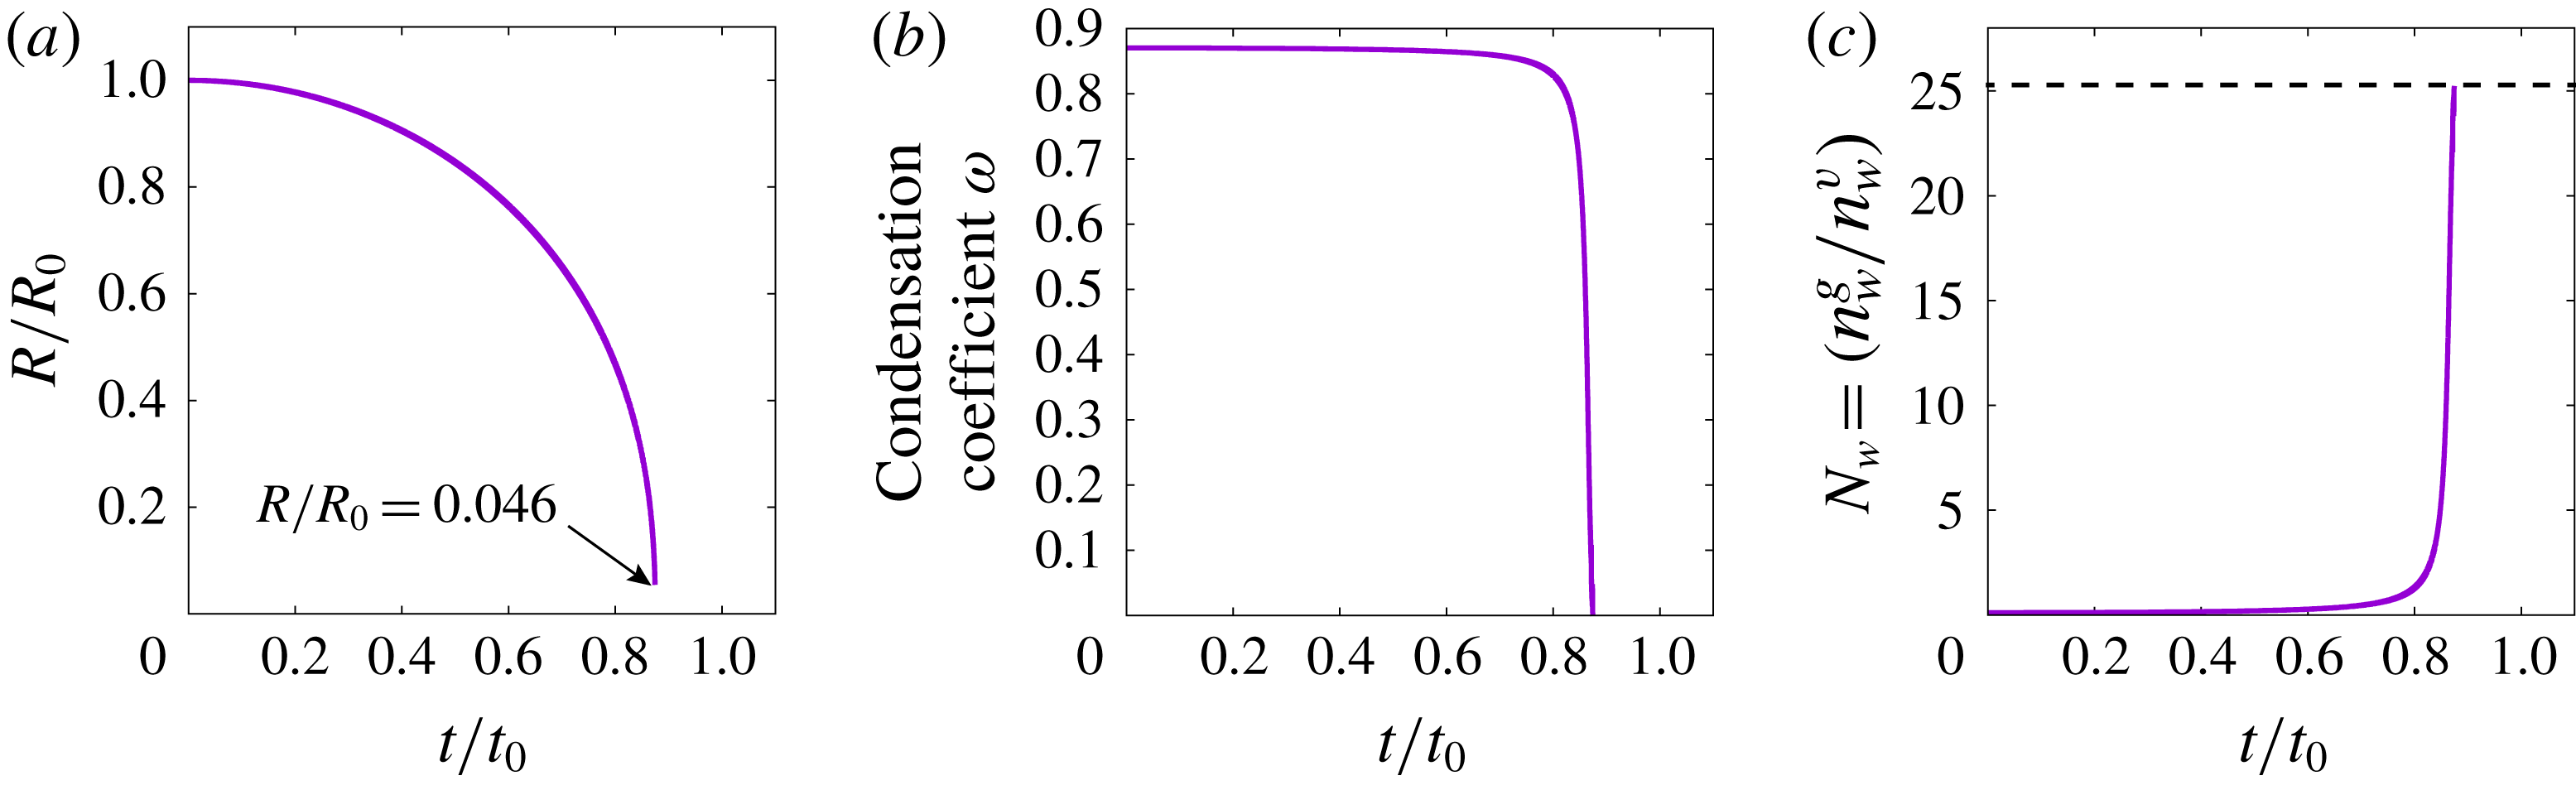
Temporal evolution of (a) bubble radius, (b) the condensation coefficient and (c) the value of
 $N_{w}$
at the bubble wall using (5.3). In this simulation,
 $N_{0}$
is 0.11,
 $R_{0}$
is
 $50\ell _{0}^{v}$
and
 $p_{\ell \infty }/p_{0}$
is
 $5.0$
. When the value of
 $N_{w}=25.1931$
(shown in figure (c) as dotted line),
 $\unicode[STIX]{x1D714}$
becomes zero.
The decrease in the condensation coefficient is caused by the adsorbed film, acting as an obstacle at the liquid surface, as described in figure 3(b). In general, the number density of the adsorbed film is much larger than that in the KBC,
 $n_{w}^{g}$
. The large number of NC gas molecules at the bubble takes minimum radius affects the adsorbed film, and the value of the condensation coefficient can decrease to much less than 0.4, according to the MD simulation results shown in (5.3); the vapour molecules behave as NC gas molecules when
 $\unicode[STIX]{x1D714}$
takes small values (much less than
 $\unicode[STIX]{x1D714}=0.4$
).
To investigate the influence of the dynamics condensation coefficient, we shows the results of the first bubble collapse by changing the condensation coefficient based on (5.3). The values of
 $N_{0}=0.11$
,
 $R_{0}=50\ell _{0}^{v}$
and
 $p_{\ell \infty }/p_{0}=5.0$
. Figure 11(a) shows the temporal evolution of bubble radius, figure 11(b) the condensation coefficient and figure 11(c) the value of
 $N_{w}$
at the bubble wall. The results show the condensation coefficient during the bubble collapse decreased with the increase in
 $N_{w}$
. When the bubble radius became around the minimum radius, the value of
 $N_{w}$
was approximately 25. When the condensation coefficient reduces to zero, the vapour molecules behave as the NC gas molecules. Then, the value of
 $n_{w}^{g}$
shows a tendency to take the high value with the bubble collapse as shown in figure 6(b). On the other hand, the value of
 $n_{w}^{v}$
also takes high value due to the NC gas behaviour of the vapour molecules. As a result,
 $N_{w}$
kept the value at which the condensation coefficient was zero. From the results, we can conclude that the condensation coefficient falls to zero in the case of the dynamics condensation coefficient due to the violent NC gas drift at the bubble wall. Equation (5.3) is that obtained from the equilibrium MD simulation. Hence, the equation of condensation coefficient in the non-equilibrium state is needed to predict the precise value of the condensation coefficient when the bubble collapses.
We do not address the NC gas solubility from the gas phase to the liquid phase. Hence, the NC gas concentration in this simulation became much higher when the bubble had the minimum radius. However, from our results, we can conclude that the influence of the drift of a NC gas with lower solubility at the gas–liquid interface on the condensation coefficient is not negligible when the bubble collapses. We suppose that this is one of the reasons for the difference in the condensation coefficient between the MD simulation (
 $\unicode[STIX]{x1D714}\approx 1$
) and the vapour collapse experiment (
 $\unicode[STIX]{x1D714}=O(10^{-2})$
) (Akhatov et al.
Reference Akhatov, Lindau, Topolnikov, Mettin, Vakhitova and Lauterborn2001) if the vapour bubble contains a small number of NC gas molecules in the experiment.
6 Conclusions
In this study, we described a numerical simulation that combines bubble dynamics and molecular gas dynamics in the collapse of a spherical micro-sized bubble filled with NC gas and vapour. The model equation of the Boltzmann equation was used for the binary mixture inside the bubble with the KBC at the bubble wall. Radial bubble motion was governed by Fujikawa & Akamatsu’s equation. The dynamics of a gas bubble containing a small or large amount of vapour was numerically investigated using these equations.
We summarize the results as follows:
(i) When the bubble contains a large number of NC gas molecules (in this study,
 $N_{0}=9.0$
), the influence of the condensation coefficient on bubble collapse is negligible.
(ii) When the bubble contains a small number of NC gas molecules and the bubble collapse is weak, that is, the NC gas concentration is low at the bubble wall, the condensation coefficient takes large value (
$\unicode[STIX]{x1D714}>0.4$
when
$N_{w}<O(10)$
, estimated by (5.3)), the bubble collapse takes the same tendency. In this case, the vapour pressure is the saturated vapour pressure at the liquid temperature.(iii) When the bubble contains a small number of NC gas molecules and the bubble collapses violently, the condensation coefficient can take a small value; the vapour molecules can behave as the NC gas molecules.


Our results indicate that a small number of NC gas molecules have a large influence on bubble collapse. To predict the high-pressure and -temperature fields inside a collapsing bubble containing a small number of NC gas molecules, the value of the condensation coefficient of vapour in a non-equilibrium state for a binary gas mixture is important. Future work is aimed at obtaining the condensation coefficient in a non-equilibrium state.
Acknowledgements
This work was supported by JSPS KAKENHI Grant Number 16K06064. Many people, especially Professor H. Takahira (Osaka Prefecture Univ.), have made valuable comments and suggestions.