Introduction
Phonological selectivity in native language (L1) acquisition is a phenomenon where children preselect which target words they attempt to produce and how they react to words that they perceive, based on the words’ phonological characteristics, and on the children's phonological abilities (Adam & Bat-El, Reference Adam and Bat-El2009; Cohen, Reference Cohen2012; Ferguson & Farwell, Reference Ferguson and Farwell1975; Fletcher et al., Reference Fletcher, Chan, Wong, Stokes, Tardif and Leung2004; Goad & Rose, Reference Goad, Rose, Kager, Pater and Zonneveld2004; Kay-Raining & Robin, Reference Kay-Raining and Robin1998; Kiparsky & Menn, Reference Kiparsky, Menn and Macnamara1977; Leonard et al., Reference Leonard, Schwartz, Chapman, Rowan, Prelock, Terrell and Messick1982; Macken & Ferguson, Reference Macken, Ferguson and Nelson1983; Redford & Miikkulainen, Reference Redford and Miikkulainen2007; Schwartz, Reference Schwartz, Smith and Locke1988; Shibimoto & Olmsted, Reference Shibimoto and Olmsted1978; Vihman, Depaolis, & Keren-Portnoy, Reference Vihman, Depaolis and Keren-Portnoy2014). Yavas (Reference Yavaş1995), for example, examined the phonology of a Portuguese–Turkish bilingual child during the first 50-word period (1;7–1;10) and found clear evidence of avoidance of target words with an initial fricative in both languages, which he attributed to language-independent segmental restrictions.
The literature suggests various models which could explain the different patterns of phonological selectivity in children's productions. One notable theory is that of Error Selective Learning, which accounts for selectivity using an acquisition pattern where children first avoid tokens containing marked structures and then repair them, before finally producing them faithfully (Becker, Reference Becker2012; Becker & Tessier, Reference Becker and Tessier2011; Tessier, Reference Tessier, Baumer, Montero and Scanlon2006, Reference Tessier2009). For example, in one study which found support for Error Selective Learning, Becker (Reference Becker2012) examined developmental data from a child acquiring Hebrew as an L1. In this study, Becker focused on avoidance patterns with regard to two structures: word-initial complex onsets and word-final sonorant codas. He found evidence of avoidance in both cases, with the child initially avoiding these structures, despite their frequent appearance in adult speech. This avoidance was followed by the child starting to attempt words containing these structures at a growing rate, while producing them primarily unfaithfully, although with a growing degree of success.
The present study focuses on a similar type of phonological selectivity, in the acquisition of clusters in English. It examines whether children attempt to produce words with CCC clusters only after they have successfully produced words containing a CC cluster of the same type (i.e., coda or onset). This is an important question, since answering it would provide insights into phonological selectivity and into how children acquire the phonology of their L1.
Research background
Clusters in English
In English, complex codas containing up to four consonants are permissible (e.g., [skʌlpts] ‘sculpts’), as are complex onsets containing up to three consonants (e.g., [splæʃ] ‘splash’), with complex codas being more common than complex onsets. Furthermore, shorter clusters are more common than longer ones, so that CC clusters are more common than CCC clusters of the same type (Brown, Reference Brown2012; Gregová, Reference Gregová2010).
There are two notable differences between complex codas and onsets in English. First, complex onsets are more constrained in terms of permissible clusters, especially in the case of CCC clusters, as these clusters are limited to those containing an /s/ + voiceless stop + approximant, such as /spl/ (e.g., [splɪt] ‘split’), /str/ (e.g., [striːm] ‘stream’), /skr/ (e.g., [skriːm] ‘scream’), and /spr/ (e.g., [sprɪŋ] ‘spring’) (Gregová, Reference Gregová2010). Second, while complex codas can be heteromorphemic (e.g., asked), complex onsets in English are always monomorphemic, meaning that they are always a part of the root morpheme (Oz, Reference Oz2014). However, it is important to note that in terms of markedness, neither type of cluster is considered inherently more marked than the other (Levelt, Schiller, & Levelt, Reference Levelt, Schiller and Levelt2000).
In terms of acquisition, consonant clusters are one of the structures that children struggle to acquire in English, with certain clusters being acquired as late as around the age of eight years on average (Smit, Hand, Freilinger, Bernthal, & Bird, Reference Smit, Hand, Freilinger, Bernthal and Bird1991). Until they manage to master these structures, children frequently deal with them using a variety of techniques, including cluster reduction, cluster simplification, epenthesis, metathesis, and coalescence (McLeod, Doorn, & Reed, Reference McLeod, Doorn and Reed2001). Of these, the most frequently used technique is cluster reduction, which involves the deletion of one or more of the consonants from the cluster, as in the case of [pænts] → [pæn] ‘pants’, where two of the consonants in the CCC coda are deleted, which reduces it to a simple coda that is easier for the child to produce (McLeod et al., Reference McLeod, Doorn and Reed2001).
Morphological markers
In English, word-final morphological markers in the form of inflectional morphemes serve as the word-final consonant in many complex codas, especially in the case of triconsonantal codas, and in nearly all codas containing four consonants. These markers include, most notably, the plural suffix -s (e.g., [teksts] ‘texts’), the third person singular suffix -s (e.g., [wɑnts] ‘wants’), and the past tense suffix -d (e.g., [pɑːrkt] ‘parked’) (Oz, Reference Oz2014).
The presence of these suffixes is important to the present analysis for two reasons. First, because, as stated above, these suffixes appear in a large portion of complex codas. Second, because the acquisition of these suffixes occurs at a later stage than the acquisition of some of the content words with which they appear (Kirk & Demuth, Reference Kirk, Demuth, Beachley, Brown and Conlin2003; Sundara, Demuth, & Kuhl, Reference Sundara, Demuth and Kuhl2011), meaning that the occurrence of these suffixes could affect which target words with a complex coda the children attempt to produce. Essentially, this means that the morphological complexity of certain clusters could contribute to their markedness in a way that affects the acquisition patterns in the study, especially in situations where the complexity of CCC clusters causes them to be attempted at a later stage than CC clusters.
/s/ clusters
/s/ clusters are clusters that contain an /s/ or a /z/ in syllable-edge position. In some cases, the inclusion of the /s/ as part of the syllable would lead to a sonority decrease or to a plateau towards the syllable's nucleus. This signifies a violation of the Sonority Sequencing Principle (SSP), which denotes that the sonority of consonants in a syllable should increase towards a syllable's nucleus (Clements, Reference Clements, Dressler, Luschützky, Pfeiffer and Rennison1992; Gregová, Reference Gregová2006; Steriade, Reference Steriade1982).
Since the inclusion of the /s/ in clusters would lead to a violation of the Sonority Sequencing Principle in languages that do not otherwise violate it, the /s/ is sometimes regarded as ‘extrasyllabic’, as an ‘appendix’ to the syllable, or as an ‘adjunct’ (Barlow, Reference Barlow2001; Borowsky, Reference Borowsky1989; Clements & Keyser, Reference Clements and Keyser1983; Ito, Reference Ito1986; Levelt et al., Reference Levelt, Schiller and Levelt2000; Steriade, Reference Steriade1982). However, the notion of extrasyllabicity in its various forms is controversial, and there are studies which argue against it, while proposing alternative ways to analyze these segments, such as heterosyllabicity (Goad & Shimada, Reference Goad, Shimada, Iyer and Kusmer2014; Hall, Reference Hall2002).
Nevertheless, this potential extrasyllabicity is important to take into account, since it's possible that, if there is a difference in the phonological structure of /s/ clusters compared to other types of clusters, then this difference could affect the target words that the children attempt to produce. Essentially, it's possible that there are phonological differences between clusters that violate the SSP and clusters that do not, which could serve as a confounding variable in the present study, if it causes children to attempt to produce CCC clusters at a later stage than CC clusters.
Frequency
Children acquiring their L1 are sensitive to the frequency of linguistic structures in that language, which affects their L1 perception and production (Ambridge, Kidd, Rowland, & Theakston, Reference Ambridge, Kidd, Rowland and Theakston2015; Lieven, Reference Lieven2010; Vihman et al., Reference Vihman, Depaolis and Keren-Portnoy2014). Kirk and Demuth (Reference Kirk, Demuth, Beachley, Brown and Conlin2003), for example, showed that children acquiring English as an L1 generally produce coda clusters before they produce onset clusters, since coda clusters are significantly more frequent in English.
In addition, studies also show that the frequency of specific words affects the age at which these lexical items are acquired by children, and can also affect the production of the structures that these words contain (Braginsky, Yurovsky, Marchman, & Frank, Reference Braginsky, Yurovsky, Marchman, Frank, Papafragou, Grodner, Mirman and Trueswell2016; Kuperman, Stadthagen-Gonzalez, & Brysbaert, Reference Kuperman, Stadthagen-Gonzalez and Brysbaert2012; Ota & Green, Reference Ota and Green2013). Kuperman et al. (Reference Kuperman, Stadthagen-Gonzalez and Brysbaert2012), for example, found a direct log-linear relationship between the frequency of individual words in English and the age at which they are acquired by children.
However, there are also studies which demonstrate that frequency does not always affect acquisition patterns, or that its influence is heavily moderated by other factors (Cohen, Reference Cohen2015; Gierut & Dale., Reference Gierut and Dale2007; Lieven, Reference Lieven2010; Sosa & Stoel-Gammon, Reference Sosa and Stoel-Gammon2012). For example, Adam and Bat-El (Reference Adam and Bat-El2009) showed that frequency does not explain why children avoid iambic targets at an early stage of Hebrew L1 acquisition, a pattern which they attribute to a universal trochaic bias.
Overall, prior research suggests that frequency sometimes plays a role in the L1 acquisition of various phonological units, such as phonemes, clusters, and syllables, so that units that appear more frequently in child-directed speech are generally acquired earlier by children. Furthermore, the frequency of specific lexical items in the target language can also sometimes affect the acquisition of those items, as well as the production of phonological structures that these lexical items contain. However, research also shows that this influence is variable, so that it does not always play a significant role in acquisition, and so that, even when it does play a role, it varies in terms of effect size and in terms of how it is moderated by other factors.
Research questions
Prior research shows that children produce long clusters only after they have produced their shorter counterparts (i.e., clusters of the same type but with fewer segments), after controlling for factors such as the position of the cluster (e.g., Gnanadesikan, Reference Gnanadesikan, Kager, Pater and Zonneveld2004; Levelt et al., Reference Levelt, Schiller and Levelt2000). However, previous studies did not examine whether children attempt to produce longer clusters only after they have successfully produced their shorter counterparts, meaning that these studies did not examine whether children demonstrate selectivity in the target tokens that they attempt to produce, based on the clusters that they contain and based on the child's phonological abilities.
As such, the present study examines whether children acquiring English as an L1 only attempt to produce target tokens with a CCC coda after they have successfully produced tokens containing a CC coda, and whether the same applies to onsets. That is, we examine not only whether tokens containing longer clusters are produced only after tokens containing their shorter counterparts, but also whether tokens with longer clusters are attempted only after tokens with shorter clusters are successfully produced.
Methodology
The corpus
The data in the corpus were collected by Compton and Streeter (Reference Compton and Streeter1977), who used a diary method where the children's parents kept track of their utterances by recording them in a notebook at least four days a week, covering about four hours a day, with the hours scattered throughout the child's waking hours. The parents were speech pathologists, and received training in phonetic transcription of child speech prior to the study. Reliability rates for the transcriptions were assessed by having some of the sessions transcribed by both a parent and the principal investigator of the original study, and by recording some of the sessions, which were then also transcribed by both the parents and the principal investigator. According to Compton and Streeter, “these reliability checks indicated a high agreement of the phonetic transcriptions and, particularly, for the consonants (approximately 90%)” (Reference Compton and Streeter1977, p. 100). The corpus was later prepared for the PhonBank project by Pater (Reference Pater1997), and is currently listed there as the ‘Compton & Pater Corpus’.
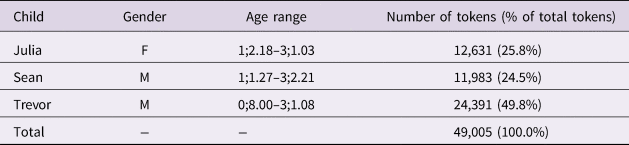
The three children in the study were all acquiring American English, as spoken in California. None of them had any learning or language-related impairments. Background data for the children are shown in Table 1.
Background data for the children in the study

Data analysis
Organizing the corpus
The corpus was analyzed using the Child Phonology Analyzer (CPA), developed by Gafni (Reference Gafni2015, Reference Gafni2019). The study focused on monosyllabic words with a monophthong, in order to avoid confounds due to factors such as syllable position, stress, and variation in syllabification (Dobrich & Scarborough, Reference Dobrich and Scarborough1992; Kay-Raining & Robin, Reference Kay-Raining and Robin1998; Shibimoto & Olmsted, Reference Shibimoto and Olmsted1978; Yavaş, Reference Yavaş1995).
The corpus was organized in the following manner. First, tokens which could not be analyzed due to missing or partial information were removed from the sample. This included cases where either the target or the output were not specified, as well as cases where only a place-holder value was specified. In addition, the CPA was used in order to detect tokens where there were four or more unfaithful segments, and these cases were also removed from the analysis, as they predominantly represented cases where the parsing algorithm failed to separate utterances into tokens correctly. This occurred primarily due to the insertion or deletion of whole words in an utterance; for example, cases where the target utterance ‘I want drink’ was matched with the output utterance ‘want drink’, so that ‘I’ was parsed as the target for ‘want’ and ‘want’ was parsed as the target for ‘drink’. Further manual analysis of the tokens led to the removal of a small number of additional tokens not identified by the algorithm, where such issues were directly evident (e.g., a case with [maɪ] ‘my’ in the target and [saks] ’socks’ in the output); all such cases in tokens which contain a cluster are listed in the Supplementary materials, available at <https://doi.org/10.1017/S0305000919000345>.
Following this, the corpus was searched for tokens containing a complex coda or onset. These tokens were separated into ‘target’ and ‘output’ tokens, with a separate analysis for codas and onsets. Cases where there was an output token with a cluster without a corresponding cluster in the target were removed, as it was difficult to determine whether the children perceived them as containing a cluster, especially as many of these tokens contained clusters which are impermissible in English, such as [dɪɡk] in the output, corresponding to [dɪɡ] ‘dig’ in the target. Overall, these cases accounted for only 100 (1.8%) of the tokens with a complex coda, and only 63 (2.7%) of the tokens with a complex onset, and all such tokens are listed in the supplementary materials. Furthermore, an examination of the data shows that their removal did not significantly affect the production patterns examined in the study. All the data that were used in the final analysis are also available in the supplementary materials.
Analyzing the data
Each token was categorized based on the type of cluster that it contained (i.e., CC/CCC, coda/onset) and based on whether the token denotes a target or an output. The children's production patterns were then examined in order to determine whether attempts at target words with a CCC cluster occurred only after the successful production of a CC cluster of the same type (in terms of the cluster being an onset or a coda).
The statistical significance of the distributions, which were aggregated for the three children based on whether the cluster was an onset or a coda, was calculated using a chi-squared goodness-of-fit test, which compared the expected and observed counts of two groups of tokens. The first group consisted of target tokens with a CCC cluster, while the second group contained all the target tokens which did not have a CCC cluster. Separate calculations were run for onsets and for codas. Expected counts were derived using the mean overall proportion of the CCC cluster in the corpus for each child, and were calculated from the beginning of the recorded utterances for that child, up to the point of the initial appearance of successful CCC productions. Essentially, this means that, in the case of codas, for example, the expected count of each child was equal to the number of CCC-coda tokens that the child produced throughout the corpus, divided by the total number of tokens that they produced, and then multiplied by the number of tokens that they produced up to the point where they produced their first CCC-coda token. Then, these individual expected counts were summed in order to calculate the overall expected count of CCC-coda tokens in the corpus, and this is the expected count that was used in the final calculation.
There were two reasons why the proportion of CCC targets was calculated based on the children's productions, rather than based on data from child-directed speech. First, words containing these clusters could be attempted at a different rate by the children than at the rate which appears in child-directed speech, due to confounding variables such as cumulative complexity, and using the children's own rates of CCC targets mitigates the potential influence of such factors. Second, the children generally had different proportions of words with CCC clusters, a fact which would not be accounted for by using data from child-directed speech. Nevertheless, in all cases, tests of statistical significance were run in two variations, the first of which used expected counts that were based on the children's productions, as explained above, and the second of which were based on the frequency of CCC targets in child-directed speech, using data from the corpus that was used when accounting for the possible effects of frequency, as described below.
In addition, Yates’ continuity correction was applied to all calculations, in order to account for the low expected counts for the CCC targets. In addition, Monte Carlo simulation with 10,000 replications were run in order to complement each chi-squared test, once again to account for the low expected counts for CCC targets.
In addition, the following factors were considered, in order to account for potential confounds:
a. Morphological complexity: The children's productions were analyzed in order to examine how the acquisition of suffixes affected the acquisition patterns of complex codas. Specifically, the goal was to see whether the acquisition of these morphological markers could explain the delay in the acquisition of CCC clusters compared to CC clusters.
b. /s/ clusters: In the present analysis, we initially categorized /s/ clusters similarly to clusters containing different segments in word-edge positions. Then, the children's productions were analyzed in order to examine how the presence of /s/ clusters in word-edge positions affected the relevant acquisition patterns, and specifically whether this could explain the variation in the acquisition order of CC/CCC clusters. This analysis applied to both onsets and codas, and in the latter case, the morphological status of the /s/ was accounted for in the analysis.
c. Sonority: In addition to /s/ clusters, sonority could also be a potential confound, if variations in sonority could be a factor that children use when it comes to deciding whether or not to produce a target word. This issue is partially addressed through the analysis of /s/ clusters, but sonority could also be a confounding factor in other cases, since not all /s/ clusters are SSP violating (e.g., /sl/ in the onset and /ns/ in the coda). Furthermore, both in /s/ clusters and in non-/s/ clusters, there can be variations in terms of sonority, even when the cluster is not SSP violating (for example, /pl/ has a greater sonority rise than /sn/). As such, the sonority of the segments in the target tokens that the children attempted to produce was analyzed, in order to determine whether different clusters were attempted at a different age based on this factor.
d. Frequency: The frequency of CC/CCC clusters in child-directed speech was examined, based on the number of the words that contain these types of clusters. Data came from the CHILDES Parental Corpus (Li & Shirai, Reference Li and Shirai2000; MacWhinney, Reference MacWhinney2000). This corpus consists of nearly 2.6 million word tokens and over 24,000 word types, collected from different sources of child-directed speech in English. These words were phonemicized using the CMU Pronouncing Dictionary (2014), and monosyllabic tokens containing complex codas/onsets were identified using the CPA. Then, the log-frequency of such tokens in child-directed speech was calculated, both in general for each structure (i.e., CC/CCC coda/onset), as well as for individual lexical items of each type. The phonemicization based on the CMU dictionary was performed using the interface at < lingorado.com/ipa/>. Utterances which could not be phonemicized using the CMU dictionary were discarded. This included 6,402 word types (26.5%) and only 32,071 word tokens (1.2%), consisting primarily of non-word utterances with a very small number of tokens (e.g., zzzz and brrrr, each with a single token).
In addition to these confounds, the acquisition patterns of target tokens with a complex coda containing a homorganic nasal + stop/fricative were also examined, since they accounted for a large portion of the children's target tokens with a complex coda.
Results: codas
Acquisition patterns
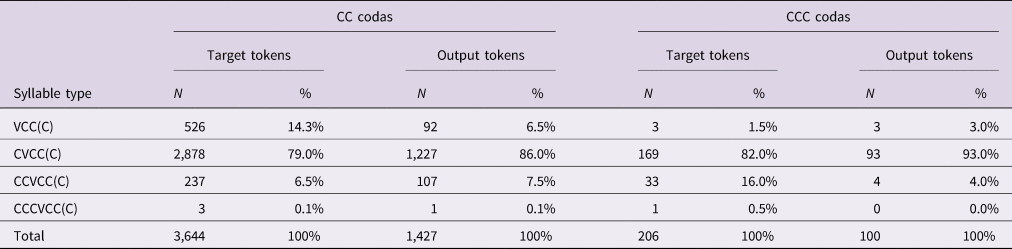
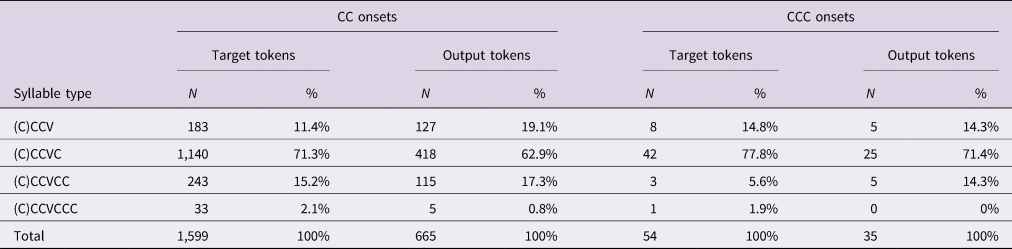
There were 27,632 monosyllabic target tokens in the corpus (64.5% of the tokens), which represents the portion of monosyllabic target tokens out of the total number of target tokens after the corpus cleanup process (N = 42,857). Of these, 3,850 target tokens (13.9%) had a complex coda; the majority (3,644, 94.65%) contained a CC coda, while a minority (206, 5.35%) contained a CCC coda. After separating the targets and outputs into separate tokens, there were 5,377 tokens in the final analysis, of which 3,850 (71.6%) were target tokens, and 1,527 (28.4%) were output tokens. 5,071 (94.3%) of the tokens contained a CC coda, and 306 (5.7%) contained a CCC coda. The information regarding the distribution of tokens containing these codas is shown in Table 2.
Distribution of tokens with a CC or CCC coda. Percentages refer to the portion of these tokens out of the total number of tokens of the same type, in terms of CC/CCC and target/output (e.g., the number of VCC target tokens out of all CC target tokens).

Note. There were no clusters containing more than three consonants in the sample.
The data in Table 2 show that children successfully produce a CC coda in 39.2% of the cases where they attempt to produce a target with a CC coda, while they successfully produce a CCC coda in 48.5% of the cases where they attempt to produce a target with a CCC coda. However, this difference was not statistically significant (χ 2(1) = 2.92, p = .09).
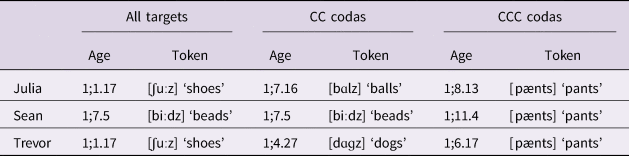
Figure 1 shows each child's target and output tokens over time, classified on the type of coda that they contained. Table 3 contains information regarding the acquisition patterns of the different tokens for each child.
Children's CC/CCC coda tokens over time. Target (TR) tokens denote cases where the child attempted to produce a token with a CC/CCC coda, regardless of whether that attempt was successful or not, while output (OT) tokens denote cases where the child successfully produced a token with such a coda. Information above the 28th month point was trimmed, as the focus is on initial emergence of the relevant structures.

Children's CC and CCC coda tokens. The information is specific to each child, with regard to the number of tokens of each type (N), the proportion of these tokens out of the total number of tokens with a CC/CCC coda (%), and the age at which that type of token first started appearing (Age of Emergence, or AoE).

Note. Excluded from Julia's count is an isolated output token with a CC coda at age 1;4.27 ([wʌts] → [wəs̠t] ‘what's’), which appeared three and a half months before the other CC outputs. However, this exclusion does not lead to a change in the production order of the different types of clusters, as shown in the previous figure.
The data shown in Figure 1 and Table 3 suggest that the children did not start attempting to produce targets tokens with CCC codas until after they have successfully produced target tokens with CC codas.
In the case of Julia, successful CC outputs first appeared at the age of 1;8.12, with [biːts] ‘beats’. Almost immediately afterwards (age 1;8.13), the first CCC target appeared, although the cluster that it contained was radically reduced to a singleton ([pænts] → [pæn] ‘pants’). The number of successful CC outputs increased over time, with 2 more productions during that month (1;8), 5 more productions in the next month (1;9), and 22 CC outputs in the month after that (1;10). This coincided with the increase in CCC targets, which took place at a certain delay compared to CC outputs, as there was only one more CCC target token at age 1;8 (beyond the first one), and none at age 1;9, but 6 at age 1;10, and 14 at age 1;11. Successful CCC outputs appeared later still and, barring a single success at 1;8.27 ([pænts] ‘pants’), these outputs started appearing at age 1;11, and had a relatively low rate of success compared to that of the other children (16 successful productions out of 62 attempts, 25.8%).
In the case of Sean, successful CC outputs first appeared at the age of 1;8.13, with [wɑnt] ‘want’. This was the only production during that month, and the rate of these productions increased to 4 at age 1;9, 6 at age 1;10, and 9 at age 1;11. The first CCC target appeared around three months later, at age 1;11.4, and also included the radical reduction of the cluster to a simpleton, as in the case of Julia, though the cluster was reduced to a different simpleton in this case ([pænts] → [pæt] ‘pants’). Other CCC targets began appearing only at the age of 2;0.23 and onward, and were relatively rare, with only around 2 targets of this type recorded per month. This was also the point at which successful CCC outputs began appearing, and overall the success rate of these productions was relatively high, though there was only a small number of them (20 successful productions out of 28 attempts, 71.4%).
In the case of Trevor, successful CC outputs first appeared at the age of 1;4.27, with [bʌmp] ‘bump’. These outputs then started appearing more frequently, with 9 productions at age 1;5, 15 productions at age 1;6, and 27 productions at age 1;7. The first CCC target appeared around two months after the production of the first CC codas, at age 1;6.17, with a moderate reduction to a complex coda ([pænts] → [pænt] ‘pants’). There was another attempted target that month, and approximately 3 recorded tokens each month for the next three months. This grew to 17 tokens at age 1;10, at which point he was also producing approximately 90 recorded CC outputs per month. Successful CCC outputs began appearing at age 1;7.11 ([pænts] ‘pants’), with only a single successful production per month out of three attempts, until reaching age 1;10, where this rate increased, so that overall the success rate of these productions was relatively moderate (64 successful productions of out 116 attempts, 55.2%).
The chi-squared test with Yates’ correction showed that the overall difference between the expected and observed counts of target tokens with a CCC coda, up until the age where these targets were first attempted, was statistically significant (χ 2(1) = 18.06, p < .001). The difference was also statistically significant based on the Monte Carlo simulation (χ 2 = 20.01, p < .001). Table 4 contains the data used in the statistical-significance calculation.
Data and counts used in the statistical-significance calculations. Age of Emergence (AoE) denotes the age at which this type of target was first attempted by the child. CCC targets denote target tokens with a CCC coda. Other targets denote target tokens without a CCC coda. Proportion of CCC targets denotes the proportion of target tokens with a CCC coda out of all the target tokens in the sample for that child. Observed and expected counts are calculated up until the AoE of CCC targets for that child. The count of total targets until AoE corresponds to the observed number of other targets used in the calculation.

Note. The expected counts listed here are rounded to the nearest whole number.
Since there were 9,652 CCC coda tokens in the child-directed corpus out of a total of 1,622,162 tokens, the frequency of tokens with CCC codas in child-directed speech (0.6%) was only slightly lower than the average frequency of targets with CCC codas in the children's target tokens (0.7%). When using this proportion to calculate the expected counts we end up with a slightly lower expected count of 16 CCC targets instead of 20, but the results remain statistically significant, both in the case of the test with Yates’ continuity correct (χ 2(1) = 14.34, p < .001) and in the case of the Monte Carlo simulation (χ 2 = 16.28, p < .001).
Analysis of confounds
Morphological complexity
Though most of the initial forms of CCC targets involved a plural -s (e.g., [pænts] ‘pants’, which was the most common initial target), the acquisition of morphological markers does not appear to account for the fact that children started attempting to produce target tokens with CCC codas only after they have successfully produced target tokens with CC codas. This is because such suffixes appear in children's target tokens before they appear as part of CCC codas, as shown in Table 5.
Ages at which morphological markers first appear in children's target tokens, in general, as part of a CC coda, and as part of a CCC coda. The ages here pertain to the -s plurality suffix, as it was part of the first CCC target coda for all three children.

Note. For both Julia and Trevor, the first target token with a plurality marker is shoes, which is sometimes considered to be a plurale tantum noun, meaning that it's not clear whether children perceive it as a plural or not (Mel’čuk, Reference Mel’čuk and Sica2006, Reference Mel’čuk2013). However, as shown in the table, both Julia and Trevor also attempt to produce other target tokens with a plurality marker before attempting to produce targets with a CCC coda.
It is important to note that ‘pants’, the first target with a CCC token for all three children, is a plurale tantum noun in English, meaning that it is nearly always grammatically plural, making it difficult to assess how children perceive its plurality in the early stages of acquisition (Gordon, Reference Gordon1985). That is, it is likely that ‘pants’ is not a productive plural, and therefore the plural -s in this case should not be considered as a suffix, and the word should not be considered as morphologically complex. However, this distinction isn't crucial here: if they do not perceive ‘pants’ as plural, then this provides further support for the idea that the time it takes to acquire this morphological marker does not explain why they only attempt targets with a CCC coda after they have successfully produced targets with a CC coda.
Overall, the fact that all three children attempt to produce targets with a plurality marker before the age at which they first attempt to produce targets with a CCC coda suggests that the acquisition of suffixes cannot explain the pattern of target avoidance which was found in the present analysis. Furthermore, the idea that such patterns appear regardless of the morphological complexity of the target tokens is further supported by the findings of the analysis for onsets, where a similar avoidance pattern is found, despite the fact that morphological markers do not play a role in the formation of complex onsets in English.
/s/ clusters in word-final position
As noted in the background section, the phonological status of /s/ in syllable-edge positions can be controversial in some cases. Accordingly, it could be argued that the increase in complexity from a CC coda without a word-final /s/ to a CCC coda with a word-final /s/ is not the same as the increase to a CCC coda without a word-final /s/. Potentially, this could represent a confounding variable, if targets with a CCC coda which contains a word-final /s/ were attempted before the children were successfully outputting targets with a CC coda. However, as we saw earlier, that was not the case in the children's productions. Furthermore, as we see in Table 6, it does not appear that codas with a final /s/ are always produced before codas of the same length without a final /s/.
Children's first target tokens in each category (CC/CCC coda, with and without a word-final /s/ or /z/)

Note. For all three children, the first token with a CCC coda and without a word-final /s/ contained the past tense -d, meaning that it was morphologically complex.
In the case of CCC codas, target tokens with word-final /s/ are attempted by all three children before target tokens without a word-final /s/. However, since there is a difference in morphological complexity between the initial words without a word-final /s/, which all contained the past tense -d, and the initial words with a word-final /s/, which all likely represent a plurale tantum noun, it is difficult to make a conclusive statement about the difference in acquisition between the two types of words. Furthermore, there is variability in the case of CC codas, since Julia's first attempted target token with a CC coda contains a word-final /s/, while both Sean and Trevor attempt to produce target tokens with a CC coda that does not contain an /s/ months before they attempt to produce their first target token with a CC coda and an /s/. However, this variability could potentially be attributed to the children's need to acquire the necessary morphological markers (in this case the plural -s), since in Sean and Trevor's cases their first target token with a CC coda and a word-final /s/ also represents their first target token with a plural -s.
Overall, the evidence suggests that the avoidance patterns in the present analysis are not affected by the possible variation between the acquisition of complex codas that contain a word-final /s/ and those that do not, regardless of the possible phonological status of such clusters. This is because target words containing /s/ clusters are not consistently attempted by the children at an earlier stage than words that do not contain these clusters. However, due to the confounding influence of morphological complexity in the case of complex codas, it is difficult to make a conclusive statement on the topic based on the data from this analysis alone. Nevertheless, as we will see later, an analysis of /s/ clusters in complex onsets, where morphological complexity does not play a role, yields similar results, which provide further evidence against the possibility that variations in the phonological status of /s/ clusters could explain the selectivity patterns in the present study.
Sonority
The sonority of the segments in the complex codas inside the target tokens that the children attempted to produce was analyzed, in order to determine whether this factor affected the production patterns that were found in the study. First, as we saw in the previous section, in the case of CCC targets codas, all three children attempted to produce codas with a relatively marked sonority profile before attempting to produce codas with a less marked sonority profile. Specifically, all three children attempted to produce targets with the /nts/ cluster, which has a sonority decrease toward the nucleus, before attempting to produce clusters such as /mpt/ and /ɹnt/, which have a plateau or an increase toward the nucleus. This suggests that, in the case of CCC codas, sonority cannot explain the acquisition patterns that were found in the study.
In the case of CC codas, there was more variation in terms of which targets the children attempted to produce. Specifically, out of a total of 3,644 targets with CC codas in the corpus, 941 (25.8%) had an obstruent–obstruent pair (e.g., /ft/), 1,424 (39.1%) had a nasal–obstruent pair (e.g., /nt/), 1,024 (28.1%) had a liquid–obstruent pair (e.g., /lp/), 178 (4.9%) had a liquid–nasal pair (e.g., /ɹm/), and 77 (2.1%) had a liquid–liquid pair (e.g., /ɹl/). Table 7 shows the acquisition patterns of different types of codas, based on the sonority of the segments that they contained.
Children's first target token with a CC coda, based on the sonority of the consonants in the coda

Note. Some early isolated targets were excluded from these results. In Sean's case, this included the obstruent–obstruent pair [biːdz] ‘beads’ (1;7.5), and the nasal–obstruent pair [θæŋk] ‘thank’ (1;6.1). In Trevor's case, this included the obstruent–obstruent pair [wuːps] ‘woops’ (1;1.28), and the obstruent–obstruent pair [dɑɡz] ‘dogs’ (1;4.27). However, the removal of these targets does not affect the conclusion of the analysis, since including them would support the idea that the sonority of the clusters was not a confounding factor in this case, as they would lead to an earlier age of initial attempts for targets with a cluster that is more marked (with regard to sonority).
These acquisition patterns suggest that sonority was not a confounding variable in this case, and could therefore not explain the acquisition patterns that were found in the study. Specifically, the children did not consistently attempt to produce targets with codas that were less marked based on their sonority at an earlier age than they did targets with codas that were more marked based on their sonority. In the case of Julia, for example, obstruent–obstruent clusters were attempted at an earlier age than both nasal–obstruent and liquid–obstruent clusters. Another example appears in both Sean's and Trevor's cases, where liquid–liquid clusters are attempted at an earlier age than liquid–nasal clusters. Furthermore, the order at which children first attempted to produce different types of clusters varied. For example, while Julia attempted to produce an obstruent–obstruent cluster before she attempted to produce a nasal–obstruent cluster, for Sean and Trevor this order of acquisition was reversed.
Frequency
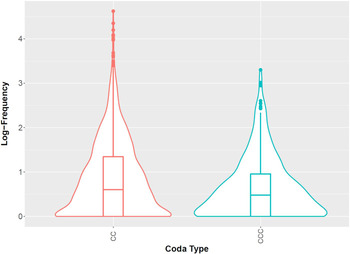
The sample of child-directed speech from the CHILDES Parental Corpus consisted of 17,756 word types and 2,547,770 word tokens. Of these, 3,887 (21.9%) types and 1,622,162 (63.7%) tokens were monosyllabic. Out of these, there were 1,649 (42.4%) word types and 231,096 (14.3%) word tokens with a CC coda, and 318 (8.2%) word types and 9,652 (0.6%) word tokens with a CCC coda. The total log-frequency, in terms of the number of tokens with a certain type of coda, was 5.36 for CC codas, and 3.99 for CCC codas. Figure 2 shows the log-frequency of individual tokens with CC and CCC codas.
Log-frequency of individual tokens with CC (N = 1,649) and CCC (N = 318) codas. The area of the violin plot represents the proportion of tokens of that type with that log-frequency, out of all the tokens of that type (i.e., CC/CCC). The middle notch in the boxplot represents the median log-frequency, while the hinges correspond to the first and third quartiles. The upper whisker extends from the hinge to the highest value that is within 1.5 times the interquartile range from the hinge. Data beyond this are plotted as points to denote outliers (Wickham, Reference Wickham2009). Note that a log-frequency of ‘0’ represents a token-frequency of ‘1’.

In terms of the log-frequency of individual tokens, for CC codas, the first quartile is at 0 (thus representing a frequency of 1), while the median is at 0.60, the third quartile is at 1.34, and the fourth quartile is at 4.62. For CCC codas, the first quartile is also at 0, while the median is at 0.48, the third quartile is at 0.95, and the fourth quartile is at 3.30. The most frequent words with a CCC coda in child-directed speech were words that were also relatively common in the children's productions (out of the attempted tokens with a CCC codas). The top five most common words with a CCC coda in child-directed speech were [fɜrst] ‘first’ (1,995 tokens, log-frequency = 3.30), [wɑnts] ‘wants’ (1,034 tokens, log-frequency = 3.02), [hændz] ‘hands’ (878 tokens, log-frequency = 2.94), [pænts] ‘pants’ (401 tokens, log-frequency = 2.60), and [θæŋks] ‘thanks’ (352 tokens, log-frequency = 2.55). In terms of log-frequency, each of these words was more frequent than the majority of target tokens with CC codas, as only 73 out of the 1,649 words (4.4%) with a CC codas had a higher frequency than these words. However, despite the relatively high frequency of these words, they were consistently attempted at a later age than less-frequent words with a CC coda. We see this in a number of cases: for example, the word [ɑɹm] ‘arm’, despite having a log-frequency of only 2.43 (268 tokens), is attempted by Trevor at the age of 1;4.27, which is before he attempts to produce any target with a CCC coda. Similarly, the word [bɑlz] ‘balls’, with a log-frequency of 2.38 (237 tokens), is attempted by Julia at the age of 1;7.16, before she attempts to produce any targets with a CCC coda, including those which have a higher frequency in child-directed speech.
Since it is expected that there will be a log-linear relationship between the frequency of individual words and the age at which they are acquired (Kuperman et al., Reference Kuperman, Stadthagen-Gonzalez and Brysbaert2012), the fact that none of the high-frequency words with a CCC coda are attempted by the children before target words with a CC coda are attempted suggests that frequency is not the direct cause of the avoidance patterns evident in the study. As we will see later, this is further supported by the similar findings in the case of complex onsets.
Homorganic nasal clusters
Homorganic nasal clusters are often considered to have a high freedom of occurrence in the language compared to other types of clusters, as they are treated as partial geminate structures linked for place features, meaning that they have only one place of articulation (Borowsky, Reference Borowsky1989; Ito, Reference Ito1986). Because of this, it is not surprising that a large portion of the target tokens with a CC coda had a homorganic cluster with a nasal + stop/fricative (NC) in the coda (N = 1424, 39.1%). This was even more pronounced in the case of target tokens containing a CCC coda, where 136 (66.0%) of the tokens contained a homorganic NC cluster. In addition, in 116 (85.3%) of the cases, this homorganic NC cluster was followed by an /s/. However, similar proportions can also be seen in child-directed speech, based on the data in the CHILDES Parental Corpus, where, out of the monosyllabic tokens with a CC coda, 95,868 (41.5%) had a homorganic NC cluster in the coda. Once again, this was even more pronounced in the case of target tokens containing a CCC coda, where 5,006 (51.9%) of the tokens had a homorganic NC cluster, and in the 4,648 (92.9%) of the cases where this homorganic NC cluster was followed by an /s/.
The differences in the proportion of these clusters were not significant between child-directed speech and children's target tokens in any of the cases: NC clusters in CC codas (χ 2(1) = 2.62, p = .106), NC clusters in CCC codas (χ 2(1) = 3.50, p = .061), or NC clusters followed by an /s/ in CCC codas (χ 2(1) = 0.44, p = .509). Furthermore, the direction of the non-significant difference in proportion varied, as homorganic NC clusters accounted for a higher proportion of clusters in child-directed speech in the case of CC codas and in the case of CCC codas with a word-final /s/, while the opposite was true in the case of NC clusters without an /s/ in CCC codas.
Overall, while homorganic NC clusters account for a large portion of the children's target tokens, especially in the case of CCC codas, their proportion appears to be in line with the prevalence of such clusters in child-directed speech. Moreover, as we saw earlier, there do not appear to be any cases where a target token containing an NC cluster in a CCC coda was attempted by a child before that child successfully produced a target token with a CC coda (with an NC cluster or otherwise), meaning that the presence of these clusters does not appear to be a confound which could explain the selectivity patterns in the present study.
Results: onsets
Acquisition patterns
Out of the 27,632 monosyllabic target tokens in the corpus, 1,653 (6.0%) had a complex onset. The majority (1,599, 96.7%) contained a CC onset, while a minority (54, 3.3%) contained a CCC onset. After separating the targets and outputs into separate tokens, there were 2,353 tokens in the final analysis, of which 1,653 (70.3%) were target tokens, and 700 (29.8%) were output tokens. 2,264 (96.7%) of the tokens contained a CC onset, and 89 (3.8%) contained a CCC onset. The information regarding the distribution of these onsets is shown in Table 8.
Distribution of tokens with a CC or CCC onset. Percentages refer to the portion of these tokens out of the total number of tokens of the same type, in terms of CC/CCC and target/output (e.g., the number of CCV target tokens out of all CC target tokens).

Note. There were no clusters containing more than three consonants in the sample. The fact that there are slightly more CCCVCC outputs than targets can be attributed to variations in the length of the coda between the target and the output (e.g., [skwʌɹts] ‘squirts’ being reduced to [skwʌts]). However, this does not affect the overall patterns of tokens with a CC/CCC onset.
The data in Table 8 show that children successfully produce a CC onset in 41.6% of the cases where they attempt to produce a target with a CC onset, while they successfully produce a CCC onset in 64.8% of the cases where they attempt to produce a target with a CCC onset. This different was statistically significant (χ 2(1) = 4.06, p = .04).
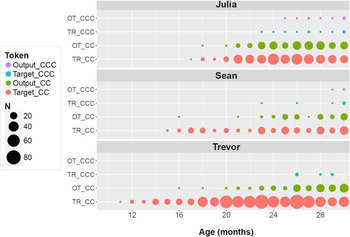
Figure 3 shows each child's target and output tokens over time, classified based on the type of onset that they contained. Table 9 contains information regarding the distribution of the different tokens for each child.
Children's CC/CCC onset tokens over time. Target (TR) tokens denote cases where the child attempted to produce a token with a CC/CCC onset, regardless of whether that attempt was successful or not, while output (OT) tokens denote cases where the child successfully produced a token with such an onset. Information above the 30th month point was trimmed, as the focus is on initial emergence of the relevant structures. Because of this, and because the first targets with a CC onset appear at an earlier age than the first targets with a CC coda in some cases, the age range represented here (0;10–2;6) is slightly different from the age range for the codas (1;2–2;4).

Children's CC and CCC onset tokens. The information is specific to each child regarding the number of tokens of each type (N), the proportion of these tokens out of the total number of tokens with a CC/CCC onset (%), and the age at which that type of token first started appearing (Age of Emergence, or AoE).

Note. A few isolated tokens were excluded, when these tokens appeared several months before other tokens of that type for that child. For Julia, this included a CC output at age 1;5.10 ([stiːv] → [s̠ti] ‘Steve’). For Sean, this included a CC output at age 1;3.21 ([bɹεd] → [bwʌ] ‘bread’), and two CCC targets at ages 1;10.10 ([stɹɑ] → [dɹɔ] ‘straw’) and 2;1.12 ([skwiːz] → [ɡwiz] ‘squeeze’). However, these exclusions do not lead to a change in the production order of the different types of cluster, as shown in the previous figure.
The data shown in Figure 3 and Table 8 suggest that, as in the case of codas, the children did not start attempting target tokens with CCC onsets until they had successfully produced target tokens with CC onsets.
In the case of Julia, successful CC outputs first appeared at the age of 1;8.4, with [spuːn] ‘spoon’. There were a total of 4 CC outputs during that month, and the rate of these productions increased to 8 at age 1;9, 13 at age 1;10, and 31 at age 1;11. The first CCC target appeared nearly three months later, at age 1;11.2, and included a moderate reduction of the cluster to a biconsonantal onset ([splæʃ] → [spæʃ] ‘splash’). Other CCC targets began appearing at the age of 2;0.3 and onward, and were relatively rare, with only one or two attempted CCC targets recorded each month. Successful CCC outputs began appearing not long after the initial CCC targets, at age 2;0.14, though the final consonant in the cluster underwent substitution to become a glide ([stɹεʧ] → [stwεts] ‘strech’). Overall, the success rate of these productions was relatively high, although there was only a small number of them (15 successful productions out of 17 attempts, 88.2%).
In the case of Sean, successful CC outputs first appeared at the age of 1;9.4, with [fɹɑɡ] ‘frog’. This was the only production during that month, and the rate of these productions increased to 3 at age 1;10, before decreasing back to 1 at age 1;11, and then increasing again to 10 at age 2;0 and 11 at age 2;1. The first CCC target appeared only at age 2;5.0, and there were four other CCC targets during that month, a rate which remained relatively consistent over time. The first CCC target also led to the first successful CCC output ([stɹiːt] → [stwit] ‘street’), and overall the success rate of these productions was relatively high (20 successful productions of out 27 attempts, 74.1%).
In the case of Trevor, successful CC outputs first appeared at the age of 1;3.25, with [snæp] ‘snap’. This was the only recorded production during the next three months, aside from one more production at age 1;5.30. Consequently, successful CC outputs started appearing more frequently at age 1;7, with 2 productions during that month, 3 productions at age 1;8, 2 at age 1;9, 7 at age 1;10, and 9 at age 1;11. The first CCC target appeared only at age 2;1.14, and included a moderate reduction of the cluster to a biconsonantal onset ([skwiːz] → [skiːz] ‘squeeze’). Other CCC targets continued to appear, though they were rare for Trevor, with only 10 CCC targets recorded overall. Furthermore, Trevor was the only one of the three children who did not successfully produce any tokens with CCC onsets. This is despite the fact that tokens were recorded for Trevor until about the same age as the other two children, and the fact that nearly twice as many tokens were recorded for him than for the other children.
The chi-squared test with Yates’ correction showed that the overall difference between the expected and observed counts of CCC onsets up until the age where the structure emerges was statistically significant (χ 2(1) = 8.80, p = .003). The difference was also statistically significant based on the Monte Carlo simulation (χ 2 = 10.71, p < .001). Table 10 contains the information used in the statistical-significance testing.
Data and counts used in the statistical-significance calculations. Age of Emergence (AoE) denotes the age at which this type of target was first attempted by the child. CCC targets denote target tokens with a CCC onset. Other targets denote target tokens without a CCC onset. Proportion of CCC targets denotes the proportion of target tokens with a CCC onset out of all the target tokens in the sample for that child. Observed and expected counts are calculated up until the AoE of CCC targets for that child. The count of total targets until AoE corresponds to the observed number of other targets used in the calculation.

Note. The expected counts listed here are rounded to the nearest whole number. This explains why the total expected CCC targets equals 11.
Since there were 2,426 CCC onset tokens in the child-directed corpus out of a total of 1,622,162 tokens, the frequency of tokens with CCC onsets in child-directed speech (0.2%) was only slightly lower than the average frequency of targets with CCC onsets in the children's target tokens, though they both rounded to the same number (0.2%). When using this proportion to calculate the expected counts we end up with a slightly higher expected count of 13 CCC targets instead of 11, due to the fact that, in this case, the child with the most target tokens until the age of acquisition (Trevor) had the lowest proportion of CCC targets. Accordingly, the results remain statistically significant, both in the case of the test with Yates’ continuity correct (χ 2(1) = 10.99, p = .001) and in the case of the Monte Carlo simulation (χ 2 = 12.91, p < .001).
Analysis of confounds
/s/ clusters in word-initial position
As noted in the background section, the structural-phonological status of /s/ clusters is controversial. Potentially, this could represent a confounding variable, if targets with a CCC onsets with an initial /s/ were attempted before the children were successfully producing targets with a CC onset. However, as we saw earlier, that was not the case in the children's productions, as they never attempted to produce target tokens with a CCC onset before they have successfully produced target tokens with a CC onset. Furthermore, as we see in Table 11, it appears that CC onsets with an initial /s/ are generally produced after target tokens with a CC onset and no initial /s/.
Children's first target tokens in each category (CC/CCC onset, with and without a word-initial /s/)

Note. There were no targets with a CCC onset which did not contain a word-initial /s/, as in regular speech, since English does not permit triconsonantal onsets where the first consonant is not an /s/ (Barlow, Reference Barlow2001).
All three children attempted to produce target tokens with a CC onset without an /s/ before they attempted to produce CC onsets with an /s/. Overall, it appears that the avoidance patterns found in the study are not explained by the possible variation in the acquisition of complex onsets which contain a word-initial /s/, and those which do not, regardless of the phonological status of such segments. The findings therefore provide evidence that the potential extrasyllabicity of the /s/ in /s/ clusters cannot explain the selectivity patterns in the study.
Sonority
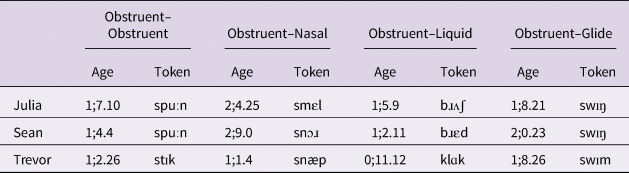
The sonority of the segments in the target tokens that the children attempted to produce was analyzed, in order to determine whether this factor affected the production patterns which were found in the study. Since all CCC target onsets contain the same general sonority profile, with a sonority decrease toward the nucleus as a result of a word-initial /s/, the analysis focused on the acquisition of CC onsets. Out of a total of 1,599 targets with CC onsets in the corpus, 287 (18.0%) had an obstruent–obstruent pair (e.g., /st/), 73 (4.6%) had an obstruent–nasal pair (e.g., /sn/), 1,182 (73.9%) had an obstruent–liquid pair (e.g., /pl/), and 56 (3.6%) had an obstruent–glide pair (e.g., /kj/). Table 12 shows the acquisition patterns of different types of onsets, based on the sonority of the segments that they contained.
Children's first target token with a CC onset, based on the sonority of the consonants in the onset

Note. Some early isolated targets were excluded from these results. In Julia's case, this included the obstruent–obstruent pair [stiːv] ‘Steve’ (1;5.10), the obstruent–nasal pair [sniːz] ‘sneeze’ (1;11.26), and the obstruent–nasal pair [smɑl] ‘small’ (2;3.4). In Sean's case, this included the obstruent–nasal pair [smεl] ‘smell’ (2;6.3). However, the removal of these targets does not affect the conclusion of the analysis, since including them would for the most part support the idea that the sonority of the clusters was not a confounding factor in this case, as they would lead to an earlier age of initial attempts for targets with a cluster that is more marked, based on its sonority.
These acquisition patterns suggest that sonority was not a confounding variable in this case. Specifically, the children did not consistently attempt to produce targets with onsets that were less marked based on their sonority at an earlier age than they did targets with onsets that were more marked based on their sonority. In the case of Julia and Sean, both obstruent–liquid clusters as well as obstruent–obstruent clusters were attempted at an earlier age than obstruent–glide clusters, and obstruent–obstruent clusters were also attempted at an earlier age than obstruent–nasal clusters. In the case of Trevor, the acquisition pattern was different, as all types of clusters were attempted at an earlier age than obstruent–glide clusters, but obstruent–nasal clusters were attempted at an earlier age than obstruent–obstruent clusters. This also demonstrates the fact that the children had different acquisition patterns with regard to which onsets they attempted to produce first (based on the sonority of those onsets), which further rules out the possibility that sonority was a confounding variable in this case.
Frequency
As noted earlier, the CHILDES Parental Corpus has 3,887 (21.9%) monosyllabic word types and 1,622,162 (63.7%) monosyllabic word tokens. Out of these, there were 924 (23.8%) word types and 49,308 (3.0%) word tokens with a CC onset, and 80 (2.1%) word types and 2,426 (0.2%) word tokens with a CCC onset. The total log-frequency, in terms of the number of tokens with a certain type of onset, was 4.69 for CC onsets, and 3.38 for CCC onsets. Figure 4 shows the log-frequency of individual tokens with CC and CCC onsets.
Log-frequency of individual tokens with CC (N = 924) and CCC (N = 80) onsets. The area of the violin plot represents the proportion of tokens of that type with that log-frequency, out of all the tokens of that type (i.e., CC/CCC). The middle notch in the boxplot represents the median, while the hinges correspond to the first and third quartiles. The upper whisker extends from the hinge to the highest value that is within 1.5 times the interquartile range from the hinge. Data beyond this are plotted as points to denote outliers (Wickham, Reference Wickham2009). Note that a log-frequency of ‘0’ represents a token-frequency of ‘1’.

In terms of the log-frequency of individual tokens, for CC onsets, the first quartile is at 0 (thus representing a frequency of 1), while the median is at 0.60, the third quartile is at 1.30, and the fourth quartile is at 3.43. For CCC onsets, the first quartile is at 0.30, while the median is at 0.78, the third quartile is at 1.38, and the fourth quartile is at 2.65.
As in target words with a complex coda, a significant portion of the words with a CCC onset which appear in child-directed speech appear there more frequently than the majority of words with a CC onset. Because of this, and because of the expected log-linear relationship between the frequency of individual tokens and the age at which they first appear in children's productions (Kuperman et al., Reference Kuperman, Stadthagen-Gonzalez and Brysbaert2012), it would be expected that, if there was no phonological avoidance of targets with CCC onsets, then the children would attempt some of the more-frequent target tokens with a CCC onsets before they would attempt those with a CC onset. Accordingly, the fact that the children do not attempt to produce any high-frequency target word with a CCC onset before attempting to produce lower-frequency target words with a CC onset suggests that the acquisition pattern which was found in the study is the result of phonological selectivity, which is supported by the similar findings in the case of complex codas.
General discussion
The study's main finding is that children attempt to produce target tokens with a CCC cluster only after they have successfully produced target tokens with a CC cluster of the same type (i.e., coda or onset). That is, the children only attempted to produce target tokens with a CCC coda after they have successfully produced target tokens with a CC coda, and, similarly, they only attempted to produce target tokens with a CCC onset after they have successfully produced target tokens with a CC onset. This is illustrated in Figure 5. Furthermore, none of the potential confounds which were examined in the study appears to explain this selectivity pattern.
Diagram illustrating the acquisition pattern which was found in the present study. The selectivity is apparent in the fact that CCC targets are attempted only after there are successful CC outputs of the same type (i.e., coda/onset).

First, there was morphological complexity in complex codas, which took the form of word-final morphological markers such as the plural -s. The initial evidence which suggests that this complexity cannot explain the selectivity patterns is the fact that children acquire such suffixes at an earlier age than the age at which they first attempt to produce target tokens with complex codas. However, it is difficult to reject the possible role that morphological complexity may play here, based on the data from the codas alone. As such, the primary evidence for the claim that the selectivity patterns are not the result of morphological complexity is the fact that there is a similar pattern of selectivity in the case of onsets, where morphological markers do not appear as part of the cluster. This does not, however, invalidate the possibility that morphological complexity could affect the markedness of the target words that the children attempt to produce. Rather, this simply suggests that, in this particular case, morphological complexity does not account for the selectivity patterns which were found in the study.
/s/ clusters, which include an /s/ or a /z/ at syllable-edge positions, and which are often analyzed as having an extrasyllabic /s/ or /z/ attached to them, also do not appear to be a confound which could explain the avoidance patterns in the study. First, the same selectivity patterns appeared for /s/ clusters as they did for other clusters. Furthermore, /s/ clusters were not consistently attempted by the children at an earlier or later age than other clusters. Overall, this does not rule out the possibility that the phonological status of /s/ clusters and the fact that they violate the SSP could affect the markedness of these clusters, and therefore the way that they are acquired by children. However, it does suggest that the phonological status of such clusters did not directly affect the selectivity patterns which were found in the present study.
Sonority, in terms of how marked clusters are based on the sonority of the segments that they contain, was also ruled out as a confound in the study. Specifically, the children did not consistently attempt to produce targets with clusters that are less marked based on their sonority at an earlier age than targets with clusters that are more marked. This means, for example, that there were several cases where targets with clusters that have a sonority decrease or a plateau toward the nucleus were attempted at an earlier age than targets with clusters that have a sonority increase. Furthermore, there were also cases where targets with clusters that have a mild sonority increase were attempted at an earlier age than targets with clusters that have a greater sonority increase (e.g., an obstruent–nasal pair was attempted at an earlier age than an obstruent–liquid pair). Moreover, there was a lack of consistency in terms of which types of clusters, based on the sonority of whose clusters, were attempted first by each child.
Frequency, which plays a role in various aspects of L1 acquisition, also did not appear to explain the selectivity patterns in the study. As noted earlier, prior studies found a log-linear relationship between the frequency of individual words in child-directed speech and the age at which children first attempt to produce these words. In the present study, we found that, while tokens with CCC clusters were generally less frequent than tokens with CC clusters in child-directed speech, a large portion of the words with a CCC cluster had a higher log-frequency than the majority of the words with a CC cluster of the same type. Despite this, none of these high-frequency words with a CCC cluster were attempted at an earlier age than their lower-frequency CC counterparts. Essentially, this means that high-frequency words containing a marked structure (namely, a CCC cluster) were generally attempted at a later age than lower-frequency words containing a less-marked structure (namely, a CC cluster). Though it's difficult to completely rule out the possible effects of frequency, due to the variability in the influence of frequency on age of acquisition, this does provide strong evidence suggesting that the selectivity patterns apparent in the study do not occur as a result of frequency.
Furthermore, the analysis also examined homorganic nasal clusters, which consist of a nasal consonant followed by a homorganic stop/fricative. These clusters were noteworthy because they accounted for a large portion of the children's productions. However, an analysis of such clusters in child-directed speech showed that there is no statistically significant difference in the proportion of such clusters between child-directed speech and the children's productions.
These clusters are also interesting from a theoretical perspective because, due to their phonological nature, it's possible that they are not represented in the children's lexicon in the same way that other clusters are, in terms of the number of phonemes which appear in the cluster. For example, in the case of [pænts], it's possible that the cluster is perceived as a CC, rather than a CCC cluster, because the children might not notice the [t] that it contains. However, the fact that none of the words containing such clusters was attempted at an earlier stage than words containing different types of clusters (i.e., before the successful production of a regular CC cluster), suggests that, even if these words have a different type of mental representation in the children's lexicon, this difference is not enough for these clusters to be perceived in the same way as CC clusters, and future research on the topic could shed light on how such clusters are perceived by the children.
A similar question exists with regard to the perception of word-final clusters which are produced differently when they are immediately followed by a word starting with a vowel, compared to when they do not. For example, this is relevant in the case of ‘spend it’ (as opposed to ‘spend money’), and in the case of ‘next hour’ (as opposed to ‘next room’). However, as before, though more work on the topic is necessary in order to determine how such words are represented in the children's lexicons, the fact that in all cases none of the words containing a CCC cluster was attempted before a word containing a CC cluster of the same type was produced, suggests that these instances are represented differently than words containing CC clusters, at least to some degree, meaning that this sort of variation did not affect the selectivity patterns which were found in the study.
Finally, the analysis also shows that the number of targets with marked structures, and the proportion of successful productions of these targets, do not always increase consistently over time. Such fluctuations have appeared in other studies, where they were attributed to various factors. One such factor is cumulative complexity, which signifies that, once new structures start appearing in children's speech, children deal with the complexity of producing these structures by dividing the acquisition process into steps, which can lead to regression in the production of older structures (Bat-El, Reference Bat-El and Parker2012). Another possible factor is the acquisition of new structures or words, which might make CC/CCC targets account for a smaller portion of targets (Becker, Reference Becker2012). Finally, another factor which could explain the decrease in the proportion of accurate productions is the possibility of an increase in systematicity, which signifies that children sometimes generalize production patterns and adapt certain target words to new templates, which results in an initial decrease in accuracy as the children systematize their phonological productions (Vihman et al., Reference Vihman, Depaolis and Keren-Portnoy2014).
Overall, these findings suggest that, during L1 acquisition, children selectively avoid attempting to produce target tokens with CCC clusters until they have successfully produced CC clusters of the same type (i.e., coda/onset). Future studies will be able to comment more conclusively on the universality of this phenomenon, and specifically on whether it occurs for other structures (e.g., CC clusters and singleton), and in languages other than English.
Limitations and future work
Despite controlling for a number of potential confounds, other possible confounds remain which could be responsible for the selectivity patterns found in the study. For example, one such confound is neighborhood density, where a similarity neighborhood is a group of words that are phonetically similar to one another. Specifically, this could be a potential confound, since children tend to acquire words from dense neighborhoods at an earlier stage than they do words from sparse neighborhoods, which means that, if words with CC clusters come from denser neighborhoods than words with CCC clusters, then this might cause children to attempt them at an earlier stage (Luce & Pisoni, Reference Luce and Pisoni1998; Storkel, Reference Storkel2004). Future research could examine such confounds, in order to determine whether or not they are responsible for the acquisition patterns which were found in the present study.
In addition, a notable limitation of the present study is the fact that, due to the relative rarity of tokens containing CCC structures in the language, the expected counts which were used in the statistical-significance testing were relatively small, despite the relatively large number of tokens which were recorded for each child. Nevertheless, the sample was big enough to achieve statistical significance in all cases, and the fact that the main acquisition pattern repeated itself with no exceptions, for all three children and in the case of both codas and onsets, means that the findings provide notable support for its validity. However, future studies on the topic, which could look at more participants, more languages, and more linguistic structures, would be able to shed more light on this phenomenon, and confirm its existence.
Conclusions
In conclusion, the findings demonstrate an important aspect of phonological selectivity in children's acquisition of complex codas and onsets in English. Specifically, the findings that children only attempt to produce target tokens with a CCC cluster after they have successfully produced target tokens with a CC cluster of the same type (i.e., coda/onset). Furthermore, an analysis of potential confounds, including morphological complexity, sonority, /s/ clusters, and frequency, suggests that none of them are likely to be the cause of this avoidance pattern. This supports the idea that the children are being selective in the target tokens that they attempt to produce, based on the type of cluster that they contain, and based on the child's current phonological abilities.
Supplementary materials
For Supplementary materials for this paper, please visit <https://doi.org/10.1017/S0305000919000345>
Acknowledgments
This paper is based on the MA thesis that I wrote as a student in the Linguistics Department at Tel Aviv University. I would like to offer my sincere gratitude to both my advisors, Outi Bat-El and Evan Gary Cohen, for their feedback and guidance. I would also like to thank the anonymous reviewers, who took the time to provide thorough comments, both when it came to this paper and when it came to the original thesis. Finally, I would like to thank Chen Gafni for his work on the Child Phonology Analyzer, which was used extensively in this research.