Introduction
Social support improves wellbeing and health through psychological, behavioural and physiological mechanisms (Thoits, Reference Thoits2011). However, at older ages, the relation between health and social support is more complex. While it is well established in the literature that social support leads to better health (Kelly et al., Reference Kelly, Duff, Kelly, Power, Brennan, Lawlor and Loughrey2017; Wang et al., Reference Wang, Mann, Lloyd-Evans, Ma and Johnson2018; Tengku Mohd et al., Reference Tengku Mohd, Yunus, Hairi, Hairi and Wan2019), poor health can also impose restrictions on social support by conditioning the availability, frequency, quality, source and structure of social support (Chao, Reference Chao2014; Tough et al., Reference Tough, Siegrist and Fekete2017; Evans et al., Reference Evans, Allotey, Imelda, Reidpath and Pool2018; Gu et al., Reference Gu, Feng and Yeung2018; Liao et al., Reference Liao, Muniz-Terrera, Head and Brunner2018; Dyer et al., Reference Dyer, Murphy, Lawlor and Kennelly2020). According to the health selection theory, poor health limits resources to maintain social relationships (Johnson, Reference Johnson1991). Changes in health among older adults are therefore likely to trigger changes in social support. Hence, it could be valuable to study how health factors shape the organisation and provision of social support in the community.
There are several validated instruments that measure social support using index-based scores (Broadhead et al., Reference Broadhead, Gehlbach, Gruy and Kaplan1988; Parkerson and Broadhead, Reference Parkerson, Broadhead and Tse1991). Previous studies have shown that these index-based scores of social support tend to be lower among older adults in poor health (Ashida and Heaney, Reference Ashida and Heaney2008; White et al., Reference White, Philogene, Fine and Sinha2009; Chen et al., Reference Chen, Simon, Chang and Zhen2014; Ge et al., Reference Ge, Wu and Dong2017). Although this may reflect that poor health could constrain access to social support, such a negative association may seem contradictory in societies where older adults in poor health are expected to receive enough support from family. For example, in Singapore, the government places family as the first line of support for older adults, followed by support from the wider community (non-family, voluntary welfare organisations and other social groups). Unlike Western societies, the state plays a minor role by directly providing resources to older people who have exhausted individual, family and community resources (Rozario and Rosetti, Reference Rozario and Rosetti2012). In such a context, older adults in poor health rely mainly on family members for social support. Since index-based scores are cumulative scores of social support from all sources, lower social support scores in societies such as Singapore might not indicate lack of support, but rather that social support is restricted in scope and intensified around a specific source, such as family.
This limitation of the index-based scores could be addressed by grouping respondents based on their sources of social support, which could effectively reveal how social support is organised and provided in the community. Membership in these groups can then be studied to explore how health and other factors could affect the source and amount of social support. Although only longitudinal data can reveal the complex causal relationships between health and social support, cross-sectional data can shed some light on the influence of health in social support structures. Since cross-sectional data tend to capture health states and the corresponding arrangements of social support at the point of interview, we can understand the patterns of social support that follow different health states. Hence, by studying the factors associated with different typologies of social support, we can describe the social support arrangements around older adults in different states of health. Similar analytical strategies have been applied to derive groups of older people based on the size and type of social networks (Burholt and Dobbs, Reference Burholt and Dobbs2014; Thiyagarajan et al., Reference Thiyagarajan, Prince and Webber2014; Li and Zhang, Reference Li and Zhang2015). Along this line, deriving groups based on social support could offer a realistic assessment of support resources and help identify vulnerable older adults in need of help. This is key to promoting targeted interventions that fill the gaps in social support for different groups of older adults.
In this study, we investigated the health factors associated with social support among participants of the Singapore Chinese Health Study (SCHS), a population-based cohort of older Singapore Chinese. We applied and compared two analytical strategies to study social support. We first computed index-based scores of social support and studied the health factors associated with social support scores. We then derived groups of respondents based on the source and amount of social support and studied the health factors associated with group membership. By applying and comparing the results of these strategies, we aimed to clarify better how health and social support could be associated in later life.
Methods
Study population
The SCHS is a population-based cohort of 63,275 Singapore Chinese aged 45–74 years at the time of recruitment (1993–1998). Participants were residents from government-built housing estates, where 86 per cent of the Singapore population resided at that time. The cohort was established initially to study diet and nutrition in cancer aetiology (Hankin et al., Reference Hankin, Stram, Arakawa, Park, Low, Lee and Yu2001). After the baseline interview, consenting participants were re-contacted for the first follow-up (1999–2004, N = 52,322), second follow-up (2006–2010, N = 39,528) and third follow-up (2014–2016, N = 17,107) interviews for updates on factors such as diet, lifestyle and medical history. The study was approved by the Institutional Review Board of the National University of Singapore. All participants gave written informed consent.
In this study, we used data obtained from the third follow-up interviews conducted from 2014 to 2016, which were administered by trained interviewers in person and focused on ageing outcomes such as cognitive function, instrumental limitations, depression and social support. After excluding participants with missing values on cognitive tests (n = 55) and self-rated health (n = 2), and participants who lived in nursing homes (n = 3), were mute (n = 1), blind (n = 55) or deaf (n = 48), this study included data from 16,943 participants (6,913 men and 10,030 women).
Assessment of social support
Social support was measured using the Duke Social Support Scale (DUSOCS) (Parkerson and Broadhead, Reference Parkerson, Broadhead and Tse1991). The computation of the scores has been described previously (Parkerson, Reference Parkerson and Alex C.2014). Briefly, the DUSOCS defines perceived social support as ‘having someone who is helpful, who will listen to you, or who will back you up when you are in trouble’ and measures the amount of support in four different levels: ‘none’, ‘some’, ‘a lot’ and ‘there is no such person’. The scale also identifies the source of support as six sources of family support (from partners, children/grandchildren, parents, siblings, other relatives and relatives by marriage) and four sources of non-family support (from neighbours, co-workers, religious group members and friends). The scores across the ten sources are summated to calculate the family and non-family support scores. The questionnaire also includes two questions on whether there is a main person the respondent can rely on and, if so, the category in which this person belongs. The scores from these two questions are then aggregated to family and non-family support scores to compute the total social support score. Family, non-family and total social support scores range from 0 (no support) to 100 (most support).
Health correlates
We measured self-rated health using the question ‘In general, would you say your health is: good/very good/excellent/ poor/fair’. We assessed the ability to perform tasks using the Lawton instrumental activities of daily living scale (Lawton and Brody, Reference Lawton and Brody1969). We rated each item dichotomously and computed summary scores from 0 (low function) to 8 (high function). We then classified respondents in two categories: those with a summary score of 8 (no instrumental limitations) and those with a summary score lower than 8 (at least one instrumental limitation in any domain). We also measured depression using the Geriatric Depression Scale (GDS) scores. Being depressed was defined as having GDS scores equal to or higher than 5 (Shwe et al., Reference Shwe, Nyunt, Fones, Niti and Ng2009). Cognitive impairment was determined using a modified Singapore version of the Mini-Mental State Examination (MMSE) (Feng et al., Reference Feng, Chong, Lim and Ng2012). Since our study population had a relatively low educational level, we defined cognitive impairment using education-adjusted cut-off points of less than 18 for those without formal schooling, less than 21 for those with one to six years of education, and less than 25 for those with more than six years of education (Katzman et al., Reference Katzman, Zhang, Ouang, Zhengyu, Liu, Yu, Wong, Salmon and Grant1988).
Statistical analysis
We first tested the conventional positive association between index-based scores and health. We ran ordinary least squares (OLS) regression models to study the factors associated with total social support scores. We then ran additional regressions to study the factors associated with family and non-family social support scores. We used self-rated health, instrumental limitations, cognitive impairment and depression as the main independent variables of health. The regression models also adjusted for age, gender and education (no formal education, primary education, secondary education, above secondary education) as covariates.
To capture additional dimensions of social support, we applied latent class analysis (LCA) to the DUSOCS answer patterns using the poLCA package in R (version 1.4). This allowed us to put respondents with similar sources and amount of social support in the same group (Linzer and Lewis, Reference Linzer and Lewis2011). We chose the best grouping scheme based on statistical performance (elbow of the Akaike information criterion, Bayesian information criterion and maximum log likelihood curves) and contextual information of social support in Singapore (Thang and Johan, Reference Thang, Johan, Klassen, Higo, Dhirathiti and Devasahayam2018). We then assigned each participant to a specific group based on the highest probability of group membership.
Finally, we used multivariable logistic regression to study how the health factors (instrumental limitations, self-rated health, cognitive impairment and depression) were associated with group membership. This analysis allowed us to examine how social support was organised in the community in response to the health needs of older adults. Except for LCA, all statistical analyses were conducted using Stata statistical software, release 14.0 (StataCorp, College Station, TX) with two-sided p-value less than 0.05 as the threshold for statistical significance.
Results
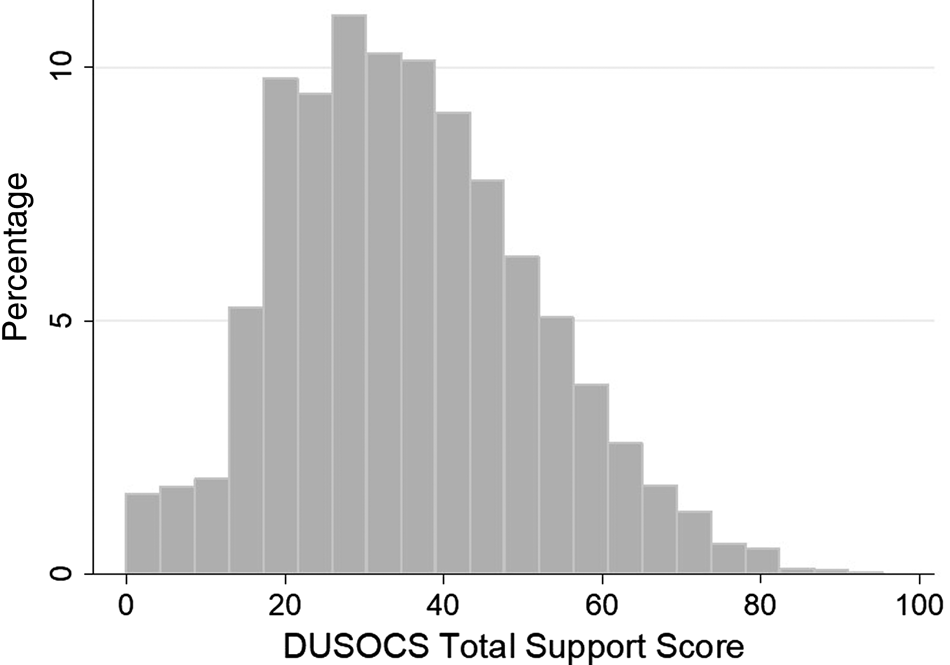
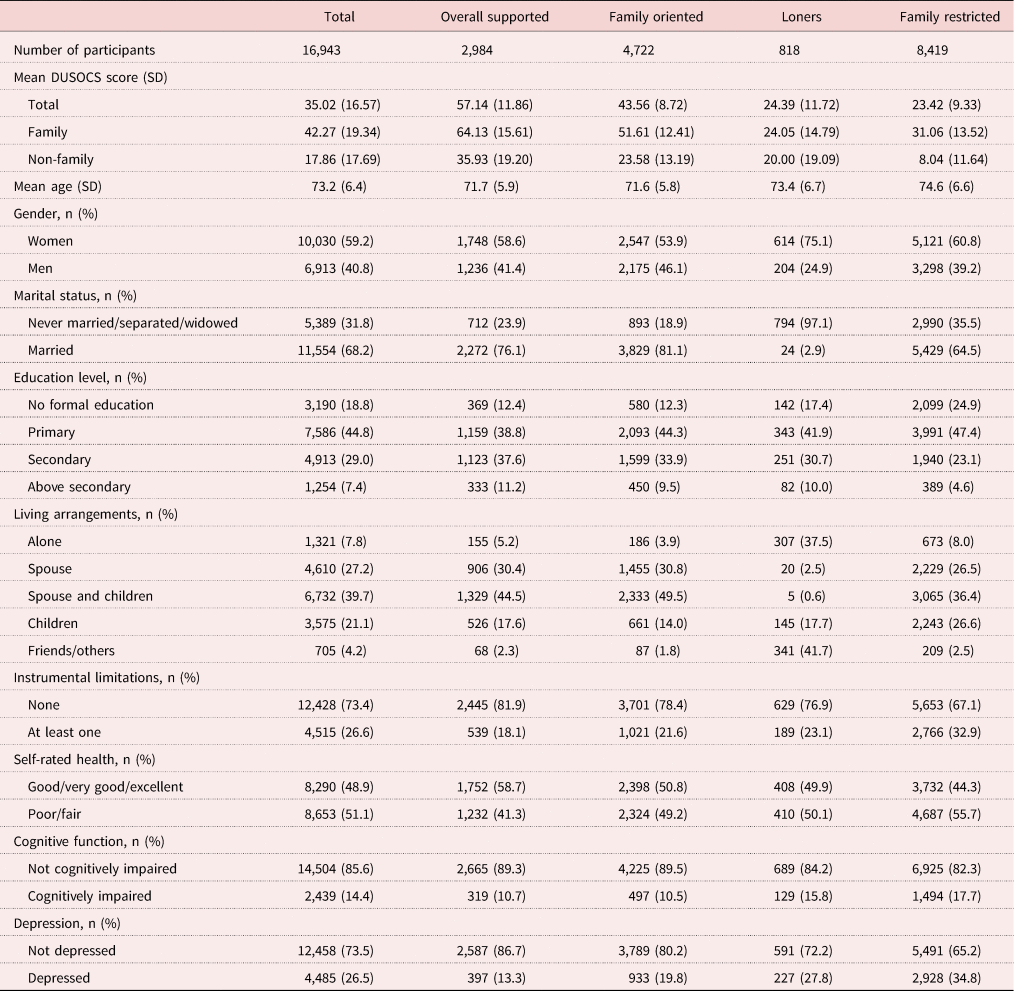
In this cohort, the mean total social support score was 35.02 (standard deviation (SD) = 16.57); the mean family support score was 42.27 (SD = 19.34) and the mean non-family support score was 17.86 (SD = 17.69). The total social support scores followed a normal distribution (Figure 1) and their range was in line with previous studies (Parkerson et al., Reference Parkerson, Broadhead and Tse1992; Hersch et al., Reference Hersch, Hutchinson, Davidson, Wilson, Maharaj and Watson2012; Guzman et al., Reference Guzman, Lacson and Labbao2015; Ghimire et al., Reference Ghimire, Singh, Nath, Jeffers and Kaphle2018). The overall mean age was 73.2 years, with women accounting for 59.2 per cent of the sample. Around a third of our cohort did not have partners (either separated/divorced or never married). The majority had primary education and lived with immediate family members, comprising spouse and/or children. About half of the participants had poor/fair self-rated health and around a quarter of them reported at least one instrumental limitation. Using education-specific cut-off points for MMSE scores, 14.4 per cent of the participants were categorised as being cognitively impaired. Similarly, GDS cut-offs indicated that 26.5 per cent of the participants were depressed (Table 1).
Distribution of the Duke Social Support Scale (DUSOCS) total support scores from the Singapore Chinese Health Study.
Note: N = 16,943.

Characteristics of study participants according to social support groups derived from latent class analysis, the Singapore Chinese Health Study.

Note: SD: standard deviation.
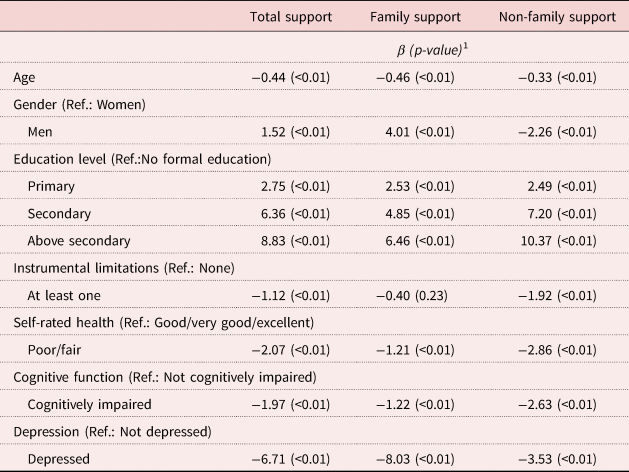
We first used OLS regression models to study socio-demographic and health factors associated with the social support scores (Table 2). The regression results for total support scores showed significant negative associations with age, instrumental limitations, poor self-rated health, cognitive impairment and depression. Poorer health was hence associated with lower total support scores, particularly among depressed participants. Men and those with a higher level of education had higher total social support scores. Education level had a positive dose–response relationship with total social support scores. We ran additional regressions using family and non-family social support scores as dependent variables. Depression was associated with less family support, whereas instrumental limitations, poor self-rated health and cognitive impairment were mainly associated with decreased non-family support. We also found that men got more family support than women, while women got more non-family support than men.
Associations between socio-demographic and health factors and total, family and non-family social support scores, the Singapore Chinese Health Study.

Notes: β: regression coefficient. Ref.: reference category. 1. Adjusted for age, gender, education, living arrangements, instrumental limitations, self-rated health, cognitive function and depression.
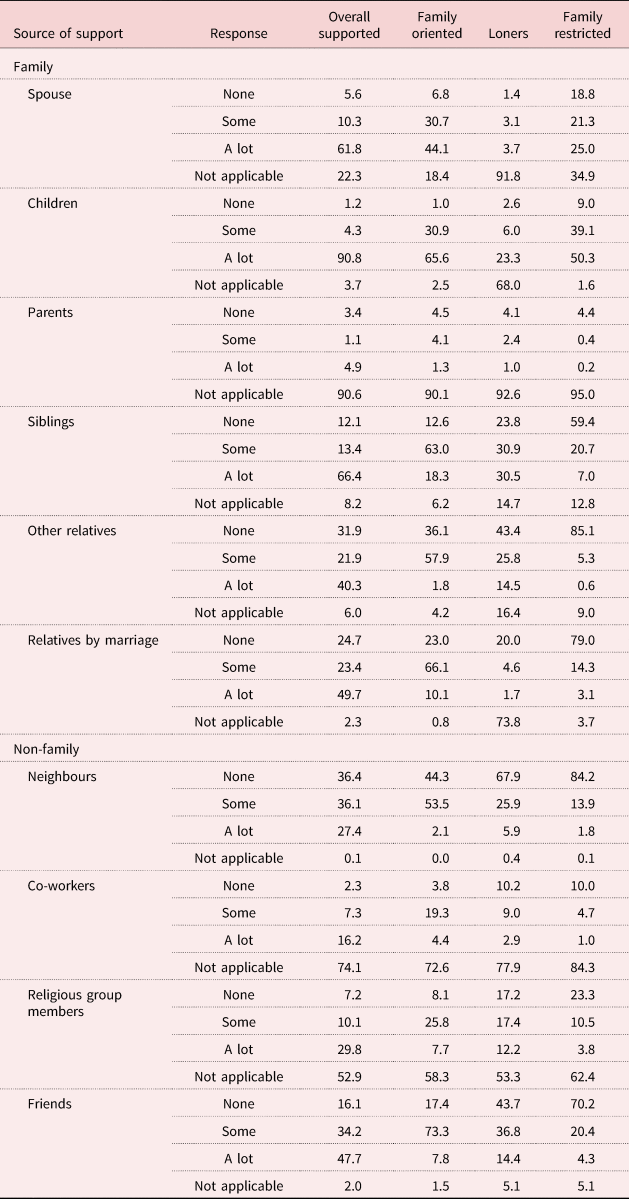
We then ran LCA and revealed four groups of older adults based on the source and amount of social support (Figure 2): the ‘overall supported’ (17%) who received ‘a lot’ of support from spouse, children, siblings, other relatives, relatives by marriage and friends, in addition to ‘some’ support from religious group members and neighbours; the ‘family oriented’ (28%) who had ‘a lot’ of support from spouse and children, in addition to ‘some’ support from siblings, other relatives, relatives by marriage, neighbours, religious group members and friends; the ‘loners’ (5%) who received ‘some’ support from children, siblings, other relatives, neighbours, religious group members and friends; and the ‘family restricted’ (50%) who had ‘a lot’ of support from children and ‘some’ support from spouse and siblings. The ‘overall supported’, ‘family oriented’ and ‘loner’ groups were therefore similar in sources of support but differed in the amount of support received by each source, while those in the ‘family restricted’ group had considerably fewer sources of support (Table 3).
Social support groups derived from latent class analysis: probabilities of social support amount (‘no support’, ‘some support’ and ‘a lot of support’) from family and non-family members of the community.

Latent class analysis results of the Duke Social Support Scale responses: probability of item response by social support group.

The ‘overall supported’ and ‘family oriented’ older adults were younger, more educated and had the lowest prevalence of poor self-rated health, instrumental limitations, cognitive impairment and depression. In contrast, ‘family restricted’ individuals were older, less-educated and had the highest prevalence of poor self-rated health, instrumental limitations, cognitive impairment and depression. ‘Loner’ individuals were mostly women who never married or were separated/widowed. Most of them lived alone or with friends. They had comparable levels of education as those ‘overall supported’ and ‘family oriented’ older people, but a lower prevalence of poor self-rated health, instrumental limitations, cognitive impairment and depression than those ‘family restricted’. These four groups also differed in their total social support scores, with ‘overall supported’ individuals having the highest score (57.14), followed by ‘family oriented’ (43.56), ‘loner’ (24.39) and ‘family restricted’ (23.42) older adults. It was noteworthy that non-family support scores were correlated with health as those with the lowest non-family support scores (‘family restricted’) also had a higher prevalence of instrumental limitations, poor self-rated health, cognitive impairment and depression (Table 1).
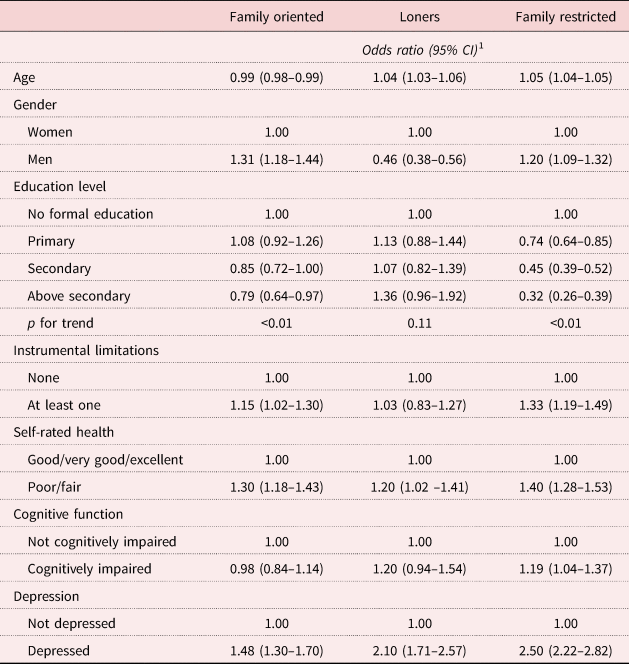
We then studied the socio-demographic and health factors associated with social support groups derived from LCA (Table 4). Using the ‘overall supported’ older adults as the comparator group, we ran logistic regression models to study socio-demographic and health factors associated with membership in the ‘family oriented’, ‘loner’ and ‘family restricted’ groups. Factors associated with being ‘family oriented’ were being younger, being male, having secondary education or less, having instrumental limitations, having poor self-rated health and being depressed. Likewise, factors associated with being a ‘loner’ were being older, being female, having poor self-rated health and being depressed. Finally, factors associated with being ‘family restricted’ were being older, being male, having no formal education, having instrumental limitations, having poor self-rated health, being cognitively impaired and being depressed. In conclusion, older adults in poor health were more likely to be in the ‘family restricted’ group.
Associations between socio-demographic and health factors and social support structures, the Singapore Chinese Health Study.

Notes: CI: confidence interval. 1. Adjusted for age, gender, education, living arrangements, instrumental limitations, self-rated health, cognitive function and depression.
Discussion
Although social support can contribute to better health among older adults, those in poor health may be limited in their capacity to receive social support. In this study, we investigated the factors associated with the source and amount of social support by applying two analytical strategies to the DUSOCS: OLS regression based on index-based scores and LCA. We found that while Singaporean older adults in poor health have lower social support scores, they were also more likely to receive a lot of support from children. This indicated that behind the numerical reduction of the social support scores, there could be a reorganisation of sources of social support for the older adults in poor health, a typical solution in Asian societies with cultural norms of filial piety. These results may apply to other Asian societies where family plays a central role in elder-care. Our analysis thus contributes to the literature by providing the structural reasons for the often-observed negative associations between health and scores of social support.
Our analysis identified four groups of older adults in descending total social support scores: ‘overall supported’, ‘family oriented’, ‘loners’ and ‘family restricted’. Those with poor self-rated health, instrumental limitations, cognitive impairment and depression had lower social support scores and a higher likelihood of being ‘family restricted’. Hence, the lower scores among older adults in poor health in our study did not necessarily indicate a lack of social support, but rather that social support was restricted in scope and intensified around children. Indeed, the proportion of the four groups concurred with the strong promotion of family support in Singapore (Thang and Johan, Reference Thang, Johan, Klassen, Higo, Dhirathiti and Devasahayam2018): 50 per cent of our cohort relied primarily on their children (those ‘family restricted’) and only a very small proportion of individuals (the 5% belonging to the ‘loners’ group) had little support from spouse or children. This provision of support centred around immediate family members was also reflected in the distribution of DUSOCS scores in our cohort: on average, family social support scores were much higher than non-family social support scores. These results are in line with other Asian studies that have used the DUSOCS (Guzman et al., Reference Guzman, Lacson and Labbao2015; Ghimire et al., Reference Ghimire, Singh, Nath, Jeffers and Kaphle2018), but differ from Western studies that showed similar family and non-family support scores (Parkerson et al., Reference Parkerson, Broadhead and Tse1992; Hersch et al., Reference Hersch, Hutchinson, Davidson, Wilson, Maharaj and Watson2012). This highlights the difference in sources of social support across countries and the need to study the factors associated with social support arrangements.
Most current studies in the field tend to assume implicitly unidirectional effects of social support on health. Here, we particularly underline that the association of social support and health could be bidirectional and contingent on the health status of the individual. During early elderhood, pre-existing social support resources could trigger behavioural and physiological responses that lead to better health (Uchino, Reference Uchino2009; Thoits, Reference Thoits2011). When entering late elderhood, however, inevitable declines in health could limit social engagement, thereby affecting the diversity of social support sources (Uchino and Rook, Reference Uchino and Rook2020). Hence, the directionality of the association between social support and health might not be static, but rather influenced by health states. In stable health states, social support could be a determinant of health but in states of functional deterioration, this directionality might reverse, so that health affects social support. Understanding the effect of health on the organisation and provision of social support could help adapt interventions to the wider social context of the older adults in poor health.
The association of poor health with restricted social support networks suggests that social support is not granted by default, but rather adapted to the capacity and demands of the individual. This is in line with the health selection theory, which argues that those with poor health have fewer resources to maintain social relationships (Johnson, Reference Johnson1991). Our study further points out that culture also matters for sourcing social support, as the norm of filial piety in societies like Singapore often assigns to adult children the responsibility of providing social support to their unhealthy parents. Therefore, social support for older adults tends to be limited in scope but intensified around children. Our study clearly revealed this pattern through LCA.
Our study also showed interesting association patterns between social support and socio-demographic factors. Being older was associated with lower social support scores and higher odds of belonging to classes with less-diverse sources of support. This is consistent with the Convoy Model of social relations, which argues that the pool of potential supporters diminishes with age (Antonucci et al., Reference Antonucci, Ajrouch and Birditt2013). As for differences by sex, we found that men relied more on family sources of support than women, while women had more non-family support. This is in line with previous studies showing that women have larger social networks and report more interactions with non-family than men (McLaughlin et al., Reference McLaughlin, Vagenas, Pachana, Begum and Dobson2010). In terms of education, we found a dose–response relationship with social support scores, with those with higher education levels receiving more non-family support. Individuals with higher education levels have indeed more exposure to diverse social networks and are more likely to maintain non-family resources in later life (Fischer and Beresford, Reference Fischer and Beresford2015). This could explain why the least educated group in our sample (‘family restricted’) have considerably less non-family support.
Our findings in this study hold policy relevant implications for planning community interventions that fill the gaps in social support among older adults. Worldwide, the proportion of older adults is increasing while family sizes decrease. This means that community interventions will have to fill this gap in social support to enable ageing in place. In order to design better community interventions, we consider that it is important to study social support arrangements in response to health states because it expedites the identification of older adults in need of support, and also helps adapt interventions to the social realities of older adults. While the social support arrangements outlined in this study could be applicable to countries where intergenerational support is strong, understanding social support arrangements when designing community interventions is a principle relevant to all societies.
Currently, interventions addressing social support gaps in Singapore and internationally tend to target older adults living alone (Rourke et al., Reference Rourke, Collins and Sidani2018; Agency for Integrated Care, 2019), which is a straightforward method to identify vulnerable individuals of old age. However, our results show that most ‘loner’ individuals in Singapore are functionally independent and have a broad network of social support, whereas those ‘family restricted’ are functionally dependent and rely mostly on their children. The fact that 50 per cent of our cohort is ‘family restricted’ warrants policy attention to shift the focus from older adults living alone to those in poor health that live with their immediate family.
In addition, our results suggest that understanding the sources of social support could help deliver more effective community interventions that are tailored to the wider social context of older adults. For example, functional limitations among those ‘family restricted’ could become barriers for them to have access to non-family support providers. In this regard, befriending activities with extended members of the community could fill the gaps in non-family support for those ‘family restricted’ and keep them connected to society. As for those ‘loner’ older adults who live alone, interventions should consider their wide network of support before promoting their social integration with befriending activities. These ‘loner’ individuals may have adapted well to a life with little social interaction and still be functionally independent. Hence, interventions could provide ad hoc instrumental help to preserve their independence (Lloyd et al., Reference Lloyd, Tanner, Milne, Ray, Richards, Pat, Beech and Phillips2014).
Nevertheless, the present study has some limitations. First and foremost, the data are cross-sectional, so the relations between social support and its various factors are associational at best. The relationship between social support and health is conceptually complex and empirically difficult to solve with cross-sectional studies. However, since our interviews captured stable health states, the social support measured here could reflect care arrangement responses to these health states. Therefore, our results are more likely to indicate how health affects social support than the other way around. In any case, the transformation of social support with health decline remains to be tested with longitudinal data. Second, the DUSOCS was not adapted to the Singaporean context. Items that could be irrelevant to a retired population of older adults such as ‘parents’ and ‘co-workers’ were kept, whereas foreign domestic workers or maids, who are important contributors to the care of older people in Singapore (Yeoh and Huang, Reference Yeoh and Huang2010), were not included in the questionnaire. Hence, the social support groups derived from the DUSOCS here might not fully represent the social support resources of all Singaporeans. In addition, only Singaporeans of Chinese ethnicity were part of the sampling frame, comprising 74.4 per cent of the Singaporean population (Department of Statistics, 2019). Since Malays, Indians and other ethnicities are not considered here, it is not possible to extrapolate these results to the entire Singapore population.
In conclusion, we found that social support scores of Singaporean older adults in poor health were lower, but this did not mean lack of social support but that social support was limited in scope and intensified around children. We thereby provide a more realistic assessment of the association between health and social support in older ages, which could also apply to other Asian societies that promote family as the first line of support for elder-care. In addition, our use of analytical strategies such as LCA effectively addressed the limitation of index-based measurements by assessing social support resources from a multi-dimensional perspective.
Acknowledgements
We thank Ms Siew-Hong Low of the National University of Singapore for supervising the fieldwork of the Singapore Chinese Health Study.
Financial support
This work was supported by the National Medical Research Council, Singapore (NMRC/CSA/0055/2013); and the Saw Swee Hock School of Public Health, National University of Singapore.
Ethical standards
The study was approved by the Institutional Review Board of the National University of Singapore. All participants gave written informed consent.