The aftermath of the 2000 election has been a time of constant learning in regards to election administration in the United States. Both scholars and policy makers initially focused primarily on voting technology and on which voting technologies were best at capturing votes. In early 2001, the Caltech/MIT Voting Technology Project developed the “residual vote” metric; numerous studies have since examined residual vote rates across different voting platforms.1
Congressional reform of elections—exemplified in the “Help America Vote Act (HAVA) of 2002” (P.L. 107-252)—also focused largely on voting technology, with HAVA imposing new standards for voting equipment and providing states with one-shot funding to aid in its purchase.Since the passage of HAVA, our understanding about election administration has grown dramatically. For example, Alvarez and Hall (2006) have described how election administration, especially polling place voting, has numerous principal-agent problems that make election management quite difficult. Herron and Lewis (2006) have shown how ballot design can affect which races voters skip on a ballot and whether voters will vote more races than they would otherwise. Alvarez, Hall, and Llewellyn (2006) have found that voter confidence in the accuracy of the vote-counting process is predicated on partisan affiliation, race, and the voting method (e.g., absentee or in-person) and technology used (e.g., electronic or optical scan).
Elsewhere we have found evidence that voter-poll worker interactions clearly affect voters' perceptions of fairness in the democratic process, as well as voters' confidence in whether ballots are counted accurately (Hall, Monson, and Patterson 2006). These findings are similar to those in a recent study by Atkeson and Saunders (2007). These studies—along with contemporary media coverage of election administration that tends to focus on problematic elections—highlight the importance of poll workers in the election process. For example, tales of polling locations that open late due to poll workers absenteeism or inability to operate voting machines properly, or of long lines at polling places demonstrate how poll workers affect the conduct of elections.
As evidence builds that poll workers are critical elements of the election system, the training they receive to prepare them for their responsibilities becomes more important. Hall, Monson, and Patterson (2006) argue that poll workers are “street-level bureaucrats” who powerfully affect the experience that voters have on Election Day. Indeed, they decide whether the voter can even cast a ballot. Poll workers have a multitude of duties on Election Day ranging from setting up and closing down voting machines to determining when to check a voter's identification to deciding when to allow a voter to cast a provisional ballot. All of these duties and the decisions associated with them can affect the election outcomes or experience in a given precinct. For example, poll workers' inability to set up the voting machines in an Indiana precinct in the 2006 general election delayed the opening of the polls. It also generated news coverage that could undermine the public's confidence in the electoral process.2
Examples of such occurrences on Election Day can be found at http://electionupdates.caltech.edu/2006_11_05_archive.html.
In this article, we report the results of two surveys conducted during the 2006 primary elections in Cuyahoga County, Ohio and in the Third Congressional District in Utah. Not only did both of these locations have competitive primary elections, they were also both moving to the same voting technology—the Diebold TSX electronic voting equipment with a voter-verified paper audit trail. However, as the survey results show, the poll workers in these jurisdictions had dramatically different experiences with the voting technology. These differences, we argue, can likely be traced back to the differences in the poll-worker training implemented by the election officials in the two electoral jurisdictions.
Training and Quality Outcomes
Elections are a relatively unique administrative activity because the front-line workers do not undertake the job on a regular basis. Furthermore, they typically work without supervision from management, meaning that first-day workers have to be able to conduct their job without assistance (Alvarez and Hall 2006). This practical design of polling place voting means that effective pre-election training is critical. Workers need to understand how to address various tasks and problems that may occur on Election Day so that these events do not hamper the overall functioning of the polling place.
The problem with training poll workers can be better understood by examining the following discussion of training front-line employees:
Training for employee development is typically focused on improving the performance of continuing employees in their particular job knowledge and skills. On-the-job training is frequently used to demonstrate job functions and classroom sessions are used to convey general information. Supervisory development involves new and continuing front-line managers and develops skills such as delegation, the building of employee motivation, interpersonal communications, and how to work with small groups. Supervisors are often taught by a “tell-show-do” method where supervisory practices are discussed, demonstrated, and the trainees practice each of the skills. A debriefing session is often conducted after practicing the skill in question to answer any questions and clarify supervisory practices. (Patton et al. 2002, 327; italics in original)
Notice how poll workers fall outside each of the categories of workers discussed above. Poll workers cannot easily be taught through on-the-job training, especially because their job is so episodic in nature. They can be taught through classroom sessions, but these sessions must cover both job function and general information because of the specific kind of work. The training of supervisors, using the “tell-show-do method,” can be implemented to train precinct poll managers—the lead election official. Finally, the cost of elections and the ongoing nature of post-election work, which can last up to one-month after the election, mean that debriefing sessions for poll workers are likely to be relatively rare. The one-day nature of the job also may limit the poll worker's ability to leverage fully the benefits that arise from the peer-to-peer learning in the workplace that is not a part of an official training program (e.g., Argyris et al. 1994; Patton et al. 2002).
One problem that arises from the lack of debriefing in the training of the polling place worker is the loss of “a culture of learning” that allows the organization to “make use of institutional knowledge, and benefit from past experience” (Patton et al. 2002; Senge 1990). An electoral jurisdiction, like any organization, needs a built-in mechanism that allows it to learn from previous experience to plan for the future. However, public-sector training is often under funded, largely because it is not seen as central to the organization's mission and it is difficult to evaluate its impact on the various organizational outputs.
Measuring outcomes is an important aspect of training programs. Training programs have four phases—assessment, design, delivery, and evaluation (e.g., Fisher et al. 1996; Van Wart 1998). In the assessment phase, the organization must determine the training's goals and audience. In the design and delivery phases, the organization chooses the training's method and the time required to complete the goal. In the evaluation phase, the organization appraises the quality of the training, the amount of learning that resulted from the training, and how the training can be improved. When selecting training methods, it is obvious that one size does not fit all; different people have different learning styles. However, for individuals who are doing a job for the first time and need to hit the ground running, multi-method training using role-playing and simulations, coupled with case studies and small group discussions, can be effective. By contrast, the lack of interactivity associated with both lecture-only and self-study training methods such as viewing videos and reading training manuals can make such training methods less effective (Green 1999; Patton et al. 2002, 332–4).
This diversity of training methods was evident in the poll-worker training employed by Utah and Cuyahoga County. The training in Cuyahoga County followed a traditional model of poll-worker training. Three-hour training sessions for poll workers were conducted in a lecture style with groups numbering at least 30 poll workers per session, with the number sometimes exceeding 40. The Cuyahoga County training was hampered by problems with its training materials and training sessions. The county elected to write its own training manual for poll workers and the manual was revised several times during the training period to eliminate errors. The training was largely facilitated using trainers hired by the county elections staff.3
Information on training in Cuyahoga County comes from an author interview with Dane Thomas, Jacqueline Maiden, and Rosie Grier, Cuyahoga County Board of Elections staff, May 11, 2006, Cleveland, Ohio. See also: Election Science Institute (2006) and Cuyahoga Election Review Panel (2006).
The training in most of the Utah counties was implemented jointly between the counties and Diebold; a vendor specializing in information technology training was contracted to conduct the training sessions. The training materials were written by county election officials consistent with actual Election-Day laws and procedures. The training sessions, which usually held about 14–16 people per class, provided substantial hands-on practice with the new equipment. Salt Lake County, which is the largest county in the state and which comprises a substantial portion of the Third Congressional District, implemented a program called “Practice Makes Perfect,” which allowed poll workers to come back for training as often as they desired in the days leading up to the election. More than half of the poll workers in Salt Lake County took advantage of this program.4
Information on training in Utah is from multiple author interviews with Lieutenant Governor Gary Herbert, his chief of staff, Joseph Demma, and Deputy Director of the Utah Elections Office Michael Cragun as well as an author interview with Salt Lake County Clerk Sherrie Swenson and Salt Lake County Elections Director Julio Garcia, July 20, 2006.
Surveying Poll Workers
The sampling of poll workers for inclusion in the surveys varied slightly across the two jurisdictions. In both locations, the poll-worker surveys were conducted in conjunction with exit polling, with the random sampling of polling locations for the exit poll also used for sampling poll workers assigned to those voting locations. In Utah, the survey was piggy-backed on exit-poll surveys conducted in 30 randomly selected polling places in the Third Congressional District. In Cuyahoga County, the survey was conducted with poll workers at 50 randomly selected polling locations and then supplemented by a random sample of poll workers throughout the rest of the county. In each case, all poll workers in the precincts where exit polling was conducted were surveyed about their experiences on Election Day. In Cuyahoga County, the survey was conducted by telephone; in Utah, the survey was conducted by mail. The Cuyahoga County survey had a response rate of 54%; the Utah survey had a response rate of 91%. The surveys used generally accepted survey methods for telephone (Lavrakas 1993) and mail surveys (Dillman 2000). The surveys yielded an N of 527 for Cuyahoga County and 131 for Utah.5
The response rate for the Cuyahoga County survey of 54% is defined as the proportion of eligible respondents that participated. The cooperation rate, defined as the proportion of eligible respondents successfully contacted that agreed to participate, was 85%. The telephone interviews lasted an average of 19 minutes and were conducted by Promark Research Corporation of Houston, Texas. The Utah Survey was a joint effort of the Center for the Study of Elections and Democracy (CSED) at Brigham Young University and the Institute of Public and International Affairs (IPIA) at the University of Utah, with the fieldwork conducted by IPIA. The response rate of 91% for the mail survey is defined as the proportion of eligible respondents who participated. The full survey questionnaires and other methodological details are available from the authors upon request.
Given that there is no extant literature on surveying poll workers, we created the survey questions based on discussions with election administrators, academics and other experts, and on a review of general survey literature in political science. We do, however, hypothesize that benefits should accrue from training. Specifically, poll workers in Utah, where the training was described by the media and election officials as being hands-on, are more likely to have positive attitudes about the training. In addition, we expect that positive attitudes about the training will increase poll-worker confidence in the electoral process and reduce problems at the polls. Finally, we do expect certain demographic factors, such as age, education, and technological savvy, to affect certain outcomes. Better-educated poll workers and those with more technological savvy are more likely to handle the transition to electronic voting better, while older poll workers are more likely to have concerns about the training and the new technology.
Survey Results
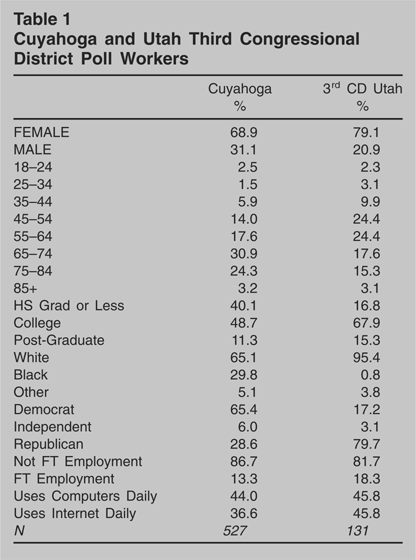
From the surveys we were able to identify differences in the poll-worker populations in the two jurisdictions, as reported in Table 1. Folk wisdom holds that poll workers are women, are older than the general population, and have little experience with computer technology. Our survey data show that there is evidence for the first part of this wisdom: the poll workers in both jurisdictions were mostly female. Approximately 69% of poll workers in Cuyahoga County and 79% of poll workers in Utah were female. However, on the age question, we see marked differences across the two jurisdictions. In Cuyahoga County, the mean age is 67, and 27% of the poll workers were older than 75. By contrast, the average age of a poll worker in the Third Congressional District was 59 and only 18% of poll workers were 75 or older. In fact, almost 40% of poll workers in this electoral jurisdiction in Utah are under age 55, compared to 24% of those in Cuyahoga County. This finding undermines the general notion that all poll workers are vastly different than the general population on the age variable; although they do trend older, younger poll workers are filling the ranks in some jurisdictions.
Cuyahoga and Utah Third Congressional District Poll Workers

On the question of technological skill, we find that in both jurisdictions approximately 45% of poll workers claim to use computers daily. In Utah, approximately the same percentage claim to use the Internet daily; slightly fewer—roughly 37%—of Cuyahoga County poll workers claim to use the Internet daily. Not surprisingly, these usage rates are age dependent; two-thirds of poll workers in Cuyahoga County and more than 75% of those in Utah 54 years old and younger claim to use computers daily. However, more than 25% of poll workers in Cuyahoga County and 21% of the poll workers who are 75 years old or older claim to use a computer daily. These data suggest that over time the general technical skills of poll workers will increase because of generational replacement.
When examining education, we see that poll workers in Utah are more likely to have some college education than do those in Cuyahoga County. However, this is another factor where age is an important control variable. Older poll workers in both jurisdictions are less likely to have attended some college. Again, the replacement over time of older with younger poll workers will probably change the educational mix of this population. The poll workers reflect their broader communities on the variables of race and party affiliation. Poll workers in Utah are generally White and Republican; those in Cuyahoga County are more racially diverse and tend to be more Democratic.
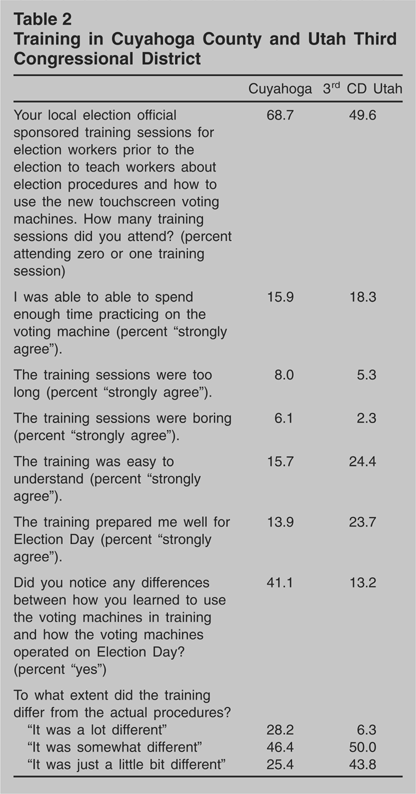
The survey also uncovered several important differences between the two jurisdictions in perceptions of the training (see Table 2). First, poll-worker training, especially with equipment being used for the first time, is complex and difficult to understand. A minority of poll workers in both jurisdictions strongly agreed with the statement that the training was easy to understand, with poll workers in Utah somewhat more likely to agree. Here, there is an age effect; older poll workers in both jurisdictions were significantly more likely to view the training as being difficult to understand compared to younger poll workers. Second, the poll workers in Utah were more likely to think that the training would prepare them well for Election Day. In Utah, there was no difference among age cohorts regarding the percentage who felt they were well prepared by the training. However, in Cuyahoga County there was an age cohort effect; older poll workers did not think that the training prepared them well. Third, the poll workers in Cuyahoga County were much more likely to say that they saw differences between how they learned to use the voting machines in training and how the voting machines operated on Election Day. This is true across all age cohorts. For those who did see differences between training and Election Day, the poll workers in Cuyahoga County were more likely to say that the differences were “a lot different.”
Training in Cuyahoga County and Utah Third Congressional District

The differences in the poll-workers perceptions on the training match the differences in the training procedures described earlier. Poll workers in Utah believed they benefited from the hands-on training.6
In both surveys poll workers were asked to agree or disagree with the following statement, “I was able to spend enough time practicing on the voting machine.” In Table 2, only the percentage in the “strongly agree” category is shown. When all responses that agree are summed, 68% of the Utah poll workers agreed compared to 43% of the Cuyahoga County poll workers.
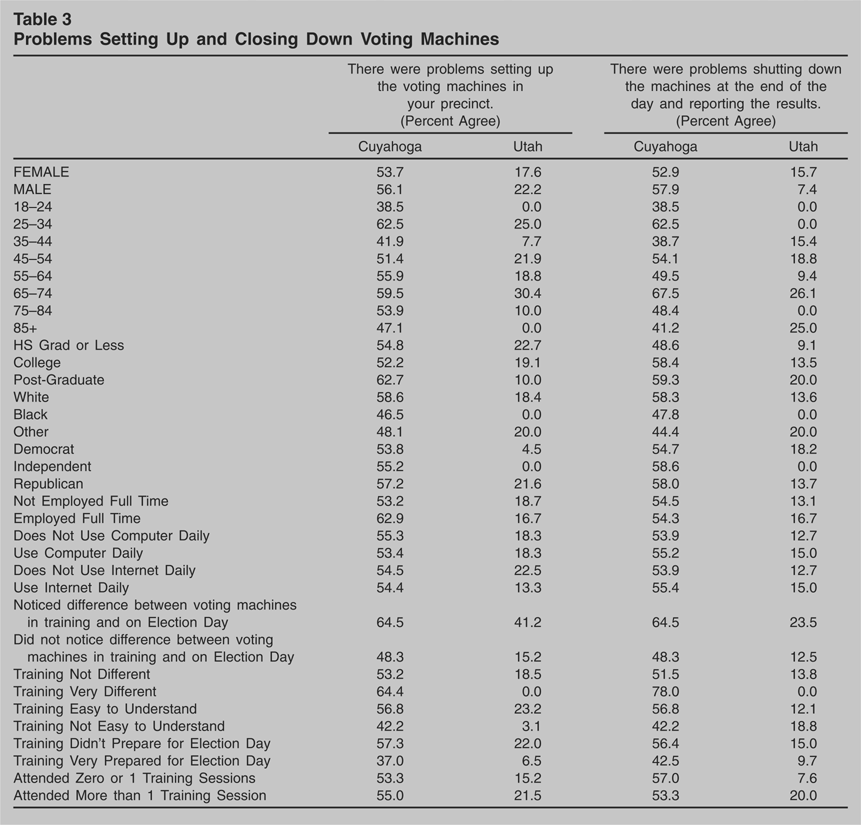
Not surprisingly, the survey results show that training affects polling place operations as well. If we examine poll workers' views regarding how well the training prepared them for the election, we see that poll workers who did not perceive the training prepared them well were also more likely to have problems setting up or closing down the voting machines on Election Day (see Table 3). Likewise, poll workers who noticed differences between the training and the Election-Day operation of the voting machines also were more likely to agree that there were problems at the polls setting up or closing down the machines. We should not be surprised by this obvious link between training and polling-place operations. There are, however, some interesting counter-intuitive findings in the training data. Poll workers who viewed the training as being very easy to understand and who attended multiple training sessions were generally more likely to be in precincts that had problems setting up or closing down the voting machines. This finding may indicate that poll workers who did not fully pay attention to the training and thought it was easy to understand may have underestimated the ease with which the machines could be set up or closed down. These poll workers could also have been better trained but co-located with less effective poll workers and thus were more likely to see problems at the polls. Finally, perhaps poll workers who diligently paid attention during training were also more diligent about reporting problems since they are taught to report problems during training.
Problems Setting Up and Closing Down Voting Machines

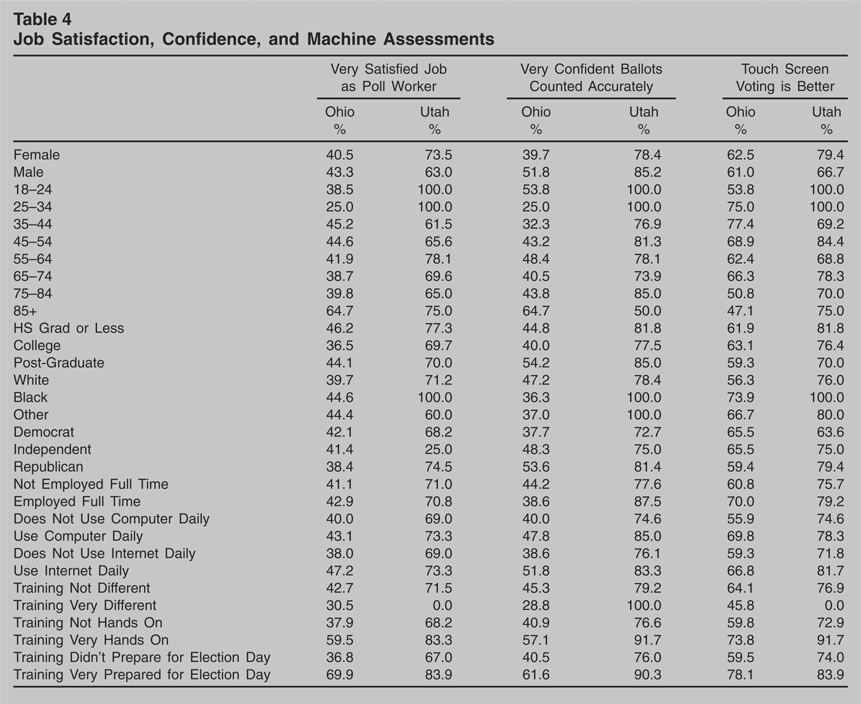
Now we turn in Table 4 to three key outcome variables in studying election administration: confidence, satisfaction, and comparisons of voting technologies. The responses shown are the proportions of poll workers who were very satisfied with their job as a poll worker, were very confident that the ballots in the election were counted accurately, and strongly agree that the touchscreen machines are better than the punch-card equipment used in previous elections. First, comparing the two jurisdictions, Utah poll workers had much more positive assessments across the three questions. Such differences probably reflect the differences between Ohio and Utah in the competitiveness of the elections and the overall partisan environment. But even with the large differences between the two jurisdictions, the descriptive data suggest that the three training variables included in this analysis are all very important to the overall evaluation of these three outcome variables. In every case, a more positive training experience leads to more confidence that the ballots were counted accurately, more satisfaction in the job as a poll worker, and a higher opinion of the touchscreen equipment. We also see that party affiliation matters: Democrats are less confident than Republicans that the ballots will be counted accurately. This finding is similar to those found by Alvarez, Hall, and Llewellyn (2006). In addition, there are some more nuanced findings of importance here. First, note that using a computer daily does not have the same effect as does using the Internet daily. Daily Internet users are more confident, more satisfied, and like touchscreen voting equipment better than do those poll workers who are daily computer users but not daily Internet users.
Job Satisfaction, Confidence, and Machine Assessments

Multivariate Analysis: Problems and Confidence
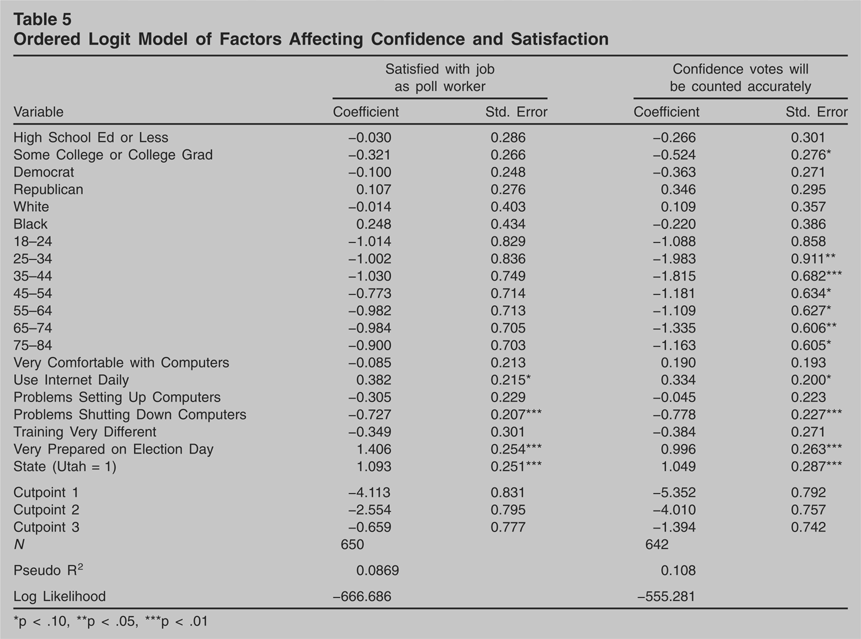
Finally, we perform a multivariate analysis examining the factors that lead a poll worker to report being very satisfied with their job as a poll worker and very confident that the ballots in the election are tabulated accurately. The ordered logit models, displayed in Table 5, show that the poll worker's training, experience on Election Day closing down the voting machines, and frequency of Internet use play key roles in predicting satisfaction and confidence. In addition, the poll workers in Utah's Third Congressional District have more confidence and satisfaction than do their counterparts in Cuyahoga County.7
To simplify the presentation we pooled the two surveys to produce the estimates for Tables 5 and 6. To control for the differences between the two jurisdictions evident in earlier tables, a dummy variable was included in the model for the survey location. The models were estimated in Stata with robust standard errors. When the models for each location were estimated separately (not shown), the Cuyahoga models in Table 5 and both the Cuyahoga and Utah models in Table 6 produced substantively similar results. The separate models in Table 5 would not converge for the Utah data, likely due to the small sample size.
Ordered Logit Model of Factors Affecting Confidence and Satisfaction

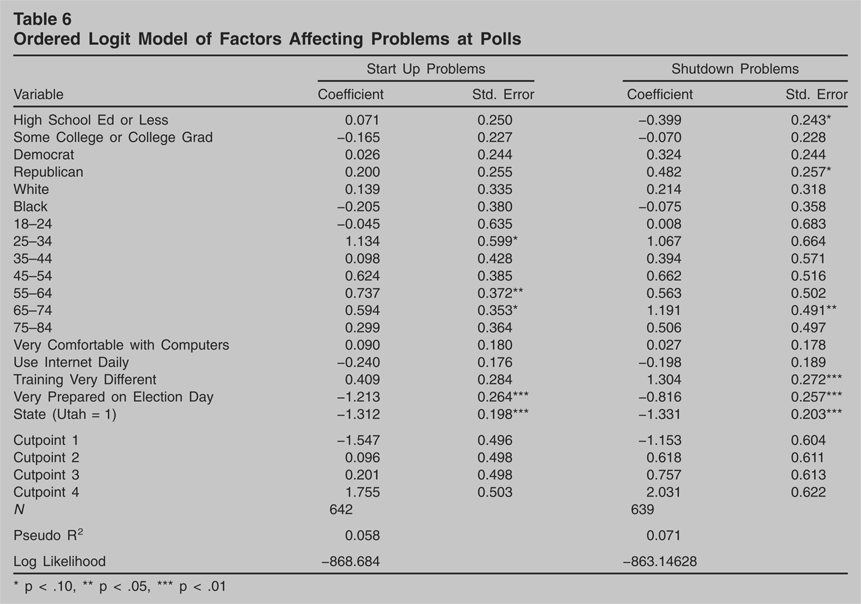
Ordered Logit Model of Factors Affecting Problems at Polls

Examining the job satisfaction model first, we see that all of the variables have the expected sign. Perceptions of training as well as the Election-Day experience affect poll-worker job satisfaction. Poll workers who felt that the training prepared them well for Election Day were more likely to be satisfied. The sign for poll workers who saw differences between the training and the actual experience on Election Day is in the expected, negative direction, but does not achieve statistical significance. Poll workers who had problems closing down the voting machines were less likely to be satisfied. The variable indicating poll-worker problems with set up is in the expected direction but not statistically significant. Daily Internet use positively influences job satisfaction as well (p < .10). While not statistically significant, the coefficients for age and education have the expected sign compared to the reference group (85 years old or older and post-graduate educated).
When we examine poll workers' confidence that the ballots would be counted accurately, we see, again, that Utah poll workers were more confident that the ballots would be tabulated correctly. When we take into account demographics, we find that, compared to the oldest poll workers, all other groups of poll workers except the very youngest were less confident that the ballots would be tabulated accurately. Education also plays a role; the best educated are more confident that the ballots would be counted accurately than the less well educated. We also see a difference between daily Internet usage and self-reported comfort level with computers; both variables are in the same direction but only Internet use achieves statistical significance (p < .10).
Again, training and negative Election-Day experiences were factors that negatively influenced poll-worker confidence that the ballots would be counted accurately. Poll workers who thought that the training prepared them well for Election Day were very likely to think that the ballots would be counted accurately. In addition, problems closing down the machine—when the voting machines have ballots in them—negatively affect confidence that the ballots would be counted accurately. Problems setting up the voting machines have no discernable effect on confidence in ballot tabulation.
In Table 6, we examine problems that occurred in the polling places by estimating models that predicted problems setting up and closing down the voting machines. We find that training is the critical factor in both the model for starting up and the model for closing down the voting machines. Poll workers who felt that they were very well prepared by the training for Election Day were less likely to agree that there were problems starting up or closing down the voting machines. Poll workers who saw major differences between Election-Day voting and the training were more likely to say that there were problems shutting down the machines. Again, although not statistically significant, poll workers who use the Internet daily were less likely to agree that there were problems starting up the voting machines. Poll workers in Utah were also less likely to agree that there were problems starting up and closing down the voting machines.
Conclusions and Implications
One of the problems with the study of election administration today is that too little effort has been put into studying the primary service providers in elections: poll workers. Poll workers are critical players in the election process because they generally serve as mediators between the voter and the ballot, which gives poll workers the potential to affect voters' confidence in the election process. The poll worker is the face of the election for voters who vote in a precinct on Election Day, still the most common way to vote in the United States.
In our work, we seek to describe the demographics of poll workers and the factors that shape their confidence in the process and their satisfaction with the job. On the first point, we see that poll workers are not homogenous—poll workers vary both within and across jurisdictions. Utah's Third Congressional District's poll workers are younger and better educated than the poll workers in Cuyahoga County, Ohio. We also see that many poll workers are not technological neophytes: a sizable percentage use both computers and the Internet daily. This potentially bodes well for the future of poll workers in the United States, since younger poll workers are likely to be more technologically adept.
Our work shows that training varies across jurisdictions as well. The poll workers we surveyed in Cuyahoga County had different training experiences than did those we surveyed in Utah. Most importantly, the poll workers in Utah were more likely to strongly agree that the training was easy to understand and prepared them well for Election Day than were those in Cuyahoga County. Moreover, they were much less likely to agree that there were differences between the Election-Day operation of the machines and how they learned to use the machines in training than were those in Cuyahoga County. For those poll workers in Utah who did think the training was different, most did not think it was a lot different, compared to over one-quarter of those workers in Cuyahoga County who thought the training was a lot different.
We also see that the two jurisdictions had very different experiences with the voting machines on Election Day. Cuyahoga County had more problems setting up and closing down the machines. Interestingly, these problems occurred across demographic groupings. We also see again that training matters; poll workers who found the training prepared them well for Election Day were less likely to have problems setting up or closing down the polls. Not surprisingly, the Utah poll workers were more confident than their Cuyahoga County counterparts that the ballots would be counted accurately, more satisfied with their jobs as poll workers, and thought the touchscreen voting was better than the traditional punch-card machines.
Finally, when we consider multivariate analyses of confidence and satisfaction, we do see that Utah poll workers are more confident and satisfied. Also, having problems shutting down the polls—the time when the ballots are in the machine—lowered confidence that the ballots would be counted accurately. Having good hands-on training increased confidence that the ballots would be counted accurately. Poll-worker satisfaction was higher in Utah than in Cuyahoga County, but we also see that technological competence, as measured by daily Internet use, affected satisfaction.
Given their potential importance to voter confidence in the system, there is clearly a need for more study of poll workers. Several researchers collected data on the 2006 elections; data from these studies should shed more light on the factors that affect voter and poll-worker confidence and satisfaction in the electoral process. Given that the 2008 elections are likely to be highly competitive, understanding these links is important for both academics and election officials.