INTRODUCTION
Loess deposits are widely distributed in Eurasia, and they are among the most valuable terrestrial archives of Quaternary climatic changes (Heller and Evans, Reference Heller and Evans1995; Liu and Ding, Reference Liu and Ding1998; Maher, Reference Maher1998; An, Reference An, Kutzbach, Prell and Porter2001; Guo et al., Reference Guo, Berger, Yin and Qin2009; Fitzsimmons et al., Reference Fitzsimmons, Marković and Hambach2012; Hao et al., Reference Hao, Wang, Oldfield, Peng, Qin, Song, Xu, Qiao, Bloemendal and Guo2012b; Marković et al., Reference Marković, Hambach, Stevens, Jovanović, O'Hara-Dhand, Basarin and Lu2012). European loess comprises the western end of the Eurasian loess belt, and it has long played an important role in our understanding of the origin and formation of loess and their linkage to climate changes in different climatic regimes. The loess–paleosol sequences in Serbia are regarded as some of the longest and most continuous loess deposits in Europe, with the basal age dating back to ~1.0 Ma (Marković et al., Reference Marković, Hambach, Stevens, Kukla, Heller, McCoy, Oches, Buggle and Zöller2011, Reference Marković, Stevens, Kukla, Hambach, Fitzsimmons, Gibbard and Buggle2015; Song et al., Reference Song, Guo, Marković, Hambach, Deng, Chang, Wu and Hao2018), and they provide an unusual opportunity to reconstruct climate changes within the European continent on both orbital and superorbital time scales.
The mineral magnetic properties of sediments are sensitive indicators of changes in the environment and climate (e.g., Thompson and Oldfield, Reference Thompson and Oldfield1986; Maher, Reference Maher1998; Evans and Heller, Reference Evans and Heller2003; Hao and Guo, Reference Hao and Guo2005). Since the pioneering work of Heller and Liu (Reference Heller and Liu1982, Reference Heller and Liu1984, Reference Heller and Liu1986), which demonstrated a link between the magnetic properties of Chinese loess–paleosol sequences and climatic changes, mineral magnetic parameters have been widely used in paleoclimatic studies of loess deposits (e.g., Heller and Evans, Reference Heller and Evans1995; Evans and Heller, Reference Evans and Heller2001; Liu et al., Reference Liu, Deng, Torrent and Zhu2007; Nie et al., Reference Nie, King and Fang2008; Maher, Reference Maher2016; Schaetzl et al., Reference Schaetzl, Bettis, Crouvi, Fitzsimmons, Grimley, Hambach and Lehmkuhl2018). Rock magnetic investigations of the loess deposits of northern China have made an important contribution to our understanding of the evolution of the East Asian monsoon and the aridification of the Asian interior (Heller and Liu, Reference Heller and Liu1986; Maher and Thompson, Reference Maher and Thompson1995; Deng et al., Reference Deng, Zhu, Verosub, Singer and Vidic2004, Reference Deng, Vidic, Verosub, Singer, Liu, Shaw and Zhu2005; Bloemendal and Liu, Reference Bloemendal and Liu2005; Hao et al., Reference Hao, Oldfield, Bloemendal and Guo2008, Reference Hao, Wang, Oldfield, Peng, Qin, Song, Xu, Qiao, Bloemendal and Guo2012b).
Numerous rock magnetic studies of representative European loess sites in Serbia (Liu et al., Reference Liu, Liu, Lu, Marković, Chen, Guo, Ma, Zhao and Feng2013; Buggle et al., Reference Buggle, Hambach, Müller, Zöller, Marković and Glaser2014), Bulgaria (Jordanova and Petersen, Reference Jordanova and Petersen1999; Jordanova et al., Reference Jordanova, Hus and Geeraerts2007; Jordanova and Jordanova, Reference Jordanova and Jordanova2021), the Ukraine (Gendler et al., Reference Gendler, Heller, Tsatskin, Spassov, DuPasquier and Faustov2006), Romania (Necula et al. Reference Necula, Dimofte and Panaiotu2015), the Czech Republic (Oches and Banerjee, Reference Oches and Banerjee1996), and Germany (Taylor et al., Reference Taylor, Lagroix, Rousseau and Antoine2014) have revealed generally similar patterns of magnetic susceptibility variations, in accord with the model developed for Chinese loess, in which a relatively high degree of magnetic enhancement occurs in paleosols as a result of pedogenesis (Zhou et al., Reference Zhou, Oldfield, Wintle, Robinson and Wang1990). Magnetic susceptibility variations of European loess can be readily correlated to those of Chinese loess and with the marine oxygen isotope record (Marković et al., Reference Marković, Stevens, Kukla, Hambach, Fitzsimmons, Gibbard and Buggle2015; Sümegi et al., Reference Sümegi, Gulyás, Molnár, Sümegi, Almond, Vandenberghe and Zhou2018; Zeeden et al., Reference Zeeden, Hambach, Obreht, Hao, Abels, Veres, Lehmkuhl, Gavrilov and Marković2018), indicating the potential of magnetic proxies for reconstructing regional climatic changes and for comparing climatic changes on an intercontinental scale.
Nevertheless, the link between the magnetic properties of Serbian loess–paleosol sequences and past climate remains unclear. A study of a loess–paleosol sequence spanning the last four glacial–interglacial cycles in the Titel Plateau suggested that soil moisture during the development of paleosols S3 and S4 exceeded a critical level for maghemite stability (Liu et al., Reference Liu, Liu, Lu, Marković, Chen, Guo, Ma, Zhao and Feng2013). However, a study of the Batajnica/Stari Slankamen composite section spanning the last 700 ka indicated that for the older paleosols (S4–S6), dissolution of the fine-grained ferrimagnetic fraction has occurred as a result of excess moisture (Buggle et al., Reference Buggle, Hambach, Müller, Zöller, Marković and Glaser2014). A longer loess–paleosol sequence containing a greater number of paleosols with varying degrees of pedogenesis (Bronger, Reference Bronger2003) may provide a better understanding of the linkage between the magnetic properties of paleosols and paleoclimate. The composite Titel-Stari Slankamen loess section is currently the longest and most complete loess–paleosol sequence, spanning the last ~1.0 Ma in Serbia and even in Europe, and detailed stratigraphic and chronological studies have been conducted on the sequence (Marković et al., Reference Marković, Stevens, Kukla, Hambach, Fitzsimmons, Gibbard and Buggle2015; Song et al., Reference Song, Guo, Marković, Hambach, Deng, Chang, Wu and Hao2018). A systematic investigation of the magnetic minerology of the section can potentially provide an improved basis for the application of the magnetic properties of Serbian loess for paleoclimatic reconstruction and may help to resolve the debate about the possible dissolution of ferrimagnetic minerals in loess deposits.
We conducted a detailed and systematic rock magnetic study of the composite Titel-Stari Slankamen loess section. Routine measurements included magnetic susceptibility and its frequency dependence (χfd), anhysteretic remanent magnetization (ARM); in addition, measurements of high- and low-temperature-dependent magnetic susceptibility, hysteresis loops, and first-order reversal curves (FORCs) were conducted on representative samples from each loess and paleosol unit. Our intention was to systematically characterize and compare the magnetic mineral assemblages and grain-size distributions and concentrations between different soil units, and to provide detailed magnetic susceptibility and ARM records for the sections to help interpret their paleoenvironmental and paleoclimatic significance. The results represent the first comprehensive rock magnetic investigation of European loess deposits spanning the last ~1.0 Ma.
GEOLOGIC AND CLIMATIC SETTING
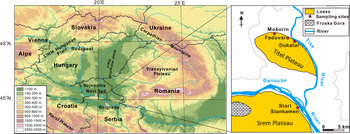
The Carpathian Basin contains some of the best-preserved loess sequences in Europe. High sediment accumulation rates, ideal preservation conditions with a pre-existing basin topography and limited physical disturbance by glaciations, and periglacial tundra conditions combined to result in relatively continuous loess deposition (Fitzsimmons et al., Reference Fitzsimmons, Marković and Hambach2012). The thickest deposits occur in the Vojvodina region of northern Serbia, near the confluence of the Danube and Tisa Rivers. In this study, a composite Titel-Stari Slankamen section from the Titel Loess Plateau and the Srem Loess Plateau in Vojvodina Province was selected for mineral magnetic analysis (Fig. 1).
(color online) Location of the Titel-Stari Slankamen section, Serbia.

The region is located at the interface of continental, Atlantic, and Mediterranean climate regimes (Obreht et al., Reference Obreht, Zeeden, Hambach, Veres, Marković, Bösken, Svirčev, Bačević, Gavrilov and Lehmkuhl2016), and it has a moderate continental climate with cold winters and hot and humid summers (Gavrilov et al., Reference Gavrilov, An, Xu, Radaković, Hao, Yang, Guo, Perić, Gavrilov and Marković2019). In Vojvodina, the mean annual surface air temperature is 11.3°C and the mean annual precipitation is approximately 600 mm (Gavrilov et al., Reference Gavrilov, Radaković, Sipos, Mezősi, Gavrilov, Lukić and Basarin2020). Surface winds blow from two prevailing opposite directions, independent of seasons. The NW wind is cold and humid, and the SE wind is warm and dry (Gavrilov et al., Reference Gavrilov, Marković, Schaetzl, Tošić, Zeeden, Obreht and Sipos2018).
SAMPLING AND ANALYTIC METHODS
The studied samples are from a recently established composite Titel-Stari Slankamen section, based on intersection correlations and overlapping magnetic susceptibility records of subsections from the Titel Loess Plateau and the Srem Loess Plateau in Vojvodina Province (Fig. 1). In the composite section, portion S0 to L3 is from the Mošorin Veliki Surduk site, S3 to S4 is from the Feduvar site, L5 to S5 is from the Dukatar site, and L6 to the basal complex is from the Stari Slankamen site (see details in fig. 2 of Song et al., Reference Song, Guo, Marković, Hambach, Deng, Chang, Wu and Hao2018). The total thickness of the combined section is 56.6 m, and it comprises more than nine major loess–paleosol couplets (S0/L1–S8/L9), together with a basal complex, strongly developed, reddish-brown clay-rich soils. Paleopedological descriptions of these sites are given in Bronger (Reference Bronger2003) and Marković et al. (Reference Marković, Hambach, Stevens, Jovanović, O'Hara-Dhand, Basarin and Lu2012), and detailed stratigraphic and chronostratigraphic studies were conducted by Marković et al. (Reference Marković, Hambach, Stevens, Kukla, Heller, McCoy, Oches, Buggle and Zöller2011) and Song et al. (Reference Song, Guo, Marković, Hambach, Deng, Chang, Wu and Hao2018).
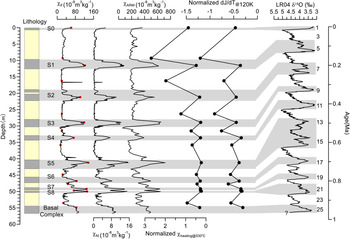
Samples were measured for magnetic susceptibility and ARM, respectively, at 10 cm and 30 cm intervals from the composite loess section. Then 19 representative samples were selected from each lithologic unit, consisting of nine loess–paleosol couplets (S0/L1 to S8/L9) and the basal complex, which were used for detailed rock magnetic investigations (Fig. 2). In the 19 samples, those from paleosol intervals have highest magnetic susceptibility values to characterize strengthened pedogenesis, and those from loess horizons have both coarse bulk grain size and low magnetic susceptibility values to represent the weak pedogenesis.
(color online) Stratigraphic variations of selected magnetic parameters of the composite Titel-Stari Slankamen loess–paleosol sequence and their correlation with the marine oxygen isotope record (Lisiecki and Raymo, Reference Lisiecki and Raymo2005). The stratigraphic positions of the 19 samples for magnetic investigation are shown by solid circles on the magnetic susceptibility curve. See text for explanation of the proxies of normalized –dJ/dT@120K and normalized χheating@530°C.

Magnetic susceptibility (χ) was measured using a Bartington MS3 meter at a low frequency (470.0 Hz, χlf) and a high frequency (4.7 kHz, χhf); these measurements enabled the calculation of frequency-dependent magnetic susceptibility (χfd = χlf – χhf). ARM was imparted in a peak alternating field of 100.00 mT with a biasing field of 0.05 mT using a 2G Enterprises Model 760R Cryogenic magnetometer; anhysteretic susceptibility (χARM) was then calculated by normalizing the ARM by the biasing field. Measurements of the high temperature dependence of magnetic susceptibility (χ-T curves) were performed using a MFK1-FA multifunction Kappabridge with a CS4 high-temperature furnace. Around 0.3 g of each powdered sample was heated from room temperature (~20°C) up to 700°C and then cooled back to room temperature in an argon atmosphere to prevent oxidation. Low-temperature thermal demagnetization of saturation isothermal remanent magnetization (LT-SIRM) measurements were conducted using a Quantum Design's Magnetic Properties Measurement System. After cooling to 15 K in a zero field, SIRM was imparted in a field of 2.5 T. Samples were then warmed from 15 K to 300 K with a temperature increment of 5 K in a zero field. Hysteresis loops were measured using a MicroMag 3900 vibrating sampling magnetometer (VSM 3900) with an applied maximum field of 1.0 T. The hysteresis parameters of saturation magnetization (Ms), saturation remanence (Mrs), and coercivity (Bc) were calculated after correction for the paramagnetic contribution (Thompson and Oldfield, Reference Thompson and Oldfield1986). FORC measurements were also performed using a VSM 3900. For each sample, 120 FORCs were measured with a maximum field of 1.0 T. FORC diagrams were produced using FORCinel v. 3.06 (Harrison and Feinberg Reference Harrison and Feinberg2008; Lascu et al., Reference Lascu, Harrison, Li, Muraszko, Channell, Piotrowski and Hodell2015).
The rock magnetic measurements were made at the Paleomagnetism and Geochronology Laboratory (except for the magnetic susceptibility measurements which were made at the Laboratory of Soil Geology and Environment), at the Institute of Geology and Geophysics, Chinese Academy of Sciences.
RESULTS
High-temperature dependence of magnetic susceptibility
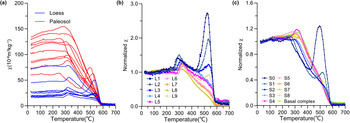
The temperature dependence of magnetic susceptibility (χ-T curve) is a routine rock magnetic tool for characterizing the magnetic mineralogy of samples based on the Curie temperature and other magnetic transformations during thermal treatment (Van Velzen and Dekkers, Reference Van Velzen and Dekkers1999a). Heating curves for loess and paleosol samples are shown in Figure 3, and full heating and cooling curves for each loess and paleosol couplet are shown in Supplementary Figure 1. A common feature of the heating curves for most of the loess and paleosol samples is a gradual rise in susceptibility from room temperature to 280°C, a small hump between ~280°C and ~330°C, a subsequent decrease in susceptibility to ~420°C or a higher temperature, and a very pronounced reduction in susceptibility at 585°C. In all cases (with the exception of unit S4), the cooling curve of each sample is above its heating curve (Supplementary Fig. 1). A major secondary susceptibility peak at ~530°C mainly occurs in younger samples, such as loess units L1–L3 and paleosols S0 and S1, but it is also evident in loess unit L9. These patterns are similar to those reported for loess and paleosol samples from elsewhere, such as in northwestern China and Central Asia (Deng et al., Reference Deng, Zhu, Verosub, Singer and Vidic2004; Zan et al., Reference Zan, Fang, Nie, Teng and Yang2012).
(color online) High-temperature magnetic susceptibility (χ-T) curves for representative loess and paleosol samples. (a) Comparison of χ-T heating curves for loess and paleosol samples. (b) Normalized χ-T heating curves for loess samples. (c) Normalized χ-T heating curves for paleosol samples.

The initial gradual rise in susceptibility from room temperature to 280°C is usually related to the gradual unblocking of fine-grained SD particles (Deng et al., Reference Deng, Zhu, Verosub, Singer and Yuan2000; Liu et al., Reference Liu, Deng, Yu, Torrent, Jackson, Banerjee and Zhu2005), this appears not to be the case for the Serbian loess deposits. It is well shown the paleosols contain a higher proportion of SD particles than loess units (Fig. 2). In the samples studied here, a comparison of the early rise in susceptibility between loess and paleosols (Fig. 3b and c) shows that the amplitude of increase is similar in both cases (generally less than 10%). Therefore, attributing the early rise in susceptibility to the gradual unblocking of fine-grained SD particles appears less reasonable in the case of the Serbian loess.
Abrupt susceptibility peaks between ~280°C and 330°C are present in all of the loess units except for unit L8, which is intensively weathered loess, and become less pronounced in paleosols (Fig. 3b and c). One widely accepted interpretation of the ~300°C peak in sediments is the neoformation of minor ferrimagnetic phases during heating through the dehydration of weakly magnetic ferric hydroxides, ferrihydrite or lepidocrocite, to maghemite (Mullins, Reference Mullins1977; Gehring and Hofmeister, Reference Gehring and Hofmeister1994; Oches and Banerjee, Reference Oches and Banerjee1996).
The decrease in susceptibility between ~330°C and 420°C, or a higher temperature, which is more significant in paleosol than in loess samples, is generally attributed to the thermally induced conversion of metastable maghemite to weakly magnetic hematite (Oches and Banerjee, Reference Oches and Banerjee1996; Deng et al., Reference Deng, Zhu, Verosub, Singer and Yuan2000; Gao et al., Reference Gao, Hao, Oldfield, Bloemendal, Deng, Wang and Song2019). Therefore, the significant susceptibility decrease during this interval for the paleosol samples suggests a higher maghemite concentration in paleosols, while the relatively small amplitude of the decrease for loess samples is indicative of a minor maghemite concentration.
The second peak at ~530°C only occurs in younger samples (loess units L1–L3 and paleosols S0 and S1), and in the older loess unit L9. Although much less pronounced, the heating curves of most of the other samples are generally convex upward at ~530°C (Fig. 3, Supplementary Fig. 1). A susceptibility peak at this temperature is commonly attributed to the neoformation of magnetite as a result of the transformation of iron-bearing silicates during heating (Hunt et al., Reference Hunt, Banerjee, Han, Solheid, Oches, Sun and Liu1995; Hoffmann et al., Reference Hoffmann, Knab and Appel1999; Deng et al., Reference Deng, Zhu, Jackson, Verosub and Singer2001), and so is the susceptibility convexity. Because the susceptibility peak at 530°C occurs mainly in the younger samples, and both the peak and the upward convexity are more pronounced in the loess samples, we tentatively attribute the neoformation of the magnetite to two factors: the organic matter content and the content of iron-bearing silicates of detrital origin. Although the heating experiments were conducted in an argon atmosphere, the decomposition of organic materials would induce a reducing environment, promoting the formation of the magnetite. In our profile, a relatively high organic matter content is indicated by the relatively dark color of paleosols S0 and S1. Therefore, the significantly larger susceptibility increases at 530°C in the younger units, especially in paleosols S0 and S1, could be at least partly related to a higher organic content. Evidence from Chinese loess deposits shows that despite the decomposition of organic materials in loess deposits older than 130 ka, the paleosols usually have enhanced organic material content (Xie et al., Reference Xie, Chen, Xu and Sun2012; Zan et al., Reference Zan, Fang, Yan and Li2017). However, the susceptibility peak and upward convexity are more pronounced in the loess samples compared with the overlying paleosol, and a prominent susceptibility peak at 530°C was observed in weakly weathered loess unit L9 (Fig. 3, Supplementary Fig. 1). These observations indicate that changes in the organic content are only partly responsible for the increased production of neoformed magnetite during heating. A higher proportion of iron-bearing silicates of detrital origin in the loess samples is likely the main cause of the susceptibility peak at ~530°C. Iron-bearing silicate minerals would have been depleted due to weathering (Spassov et al., Reference Spassov, Heller, Kretzschmar, Evans, Yue and Nourgaliev2003; Torrent et al., Reference Torrent, Liu, Bloemendal and Barrón2007; Peng et al., Reference Peng, Hao, Oldfield and Guo2014), resulting in a much weaker susceptibility peak at ~530°C in the paleosols.
The cooling curve above the heating curve for each sample (Supplementary Fig. 1) and a susceptibility peak/upward convexity in heating curve at ~530°C (Fig. 3) clearly demonstrate the neoformation of magnetite. Therefore, the Curie point of 585°C cannot be used to determine whether or not magnetite is present in the original samples, which has been widely reported previously (e.g., Gao et al., Reference Gao, Hao, Oldfield, Bloemendal, Deng, Wang and Song2019).
Low-temperature remanent magnetization
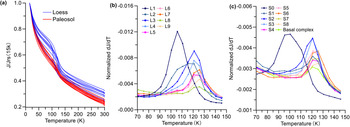
Low-temperature remanence measurements are usually used as a diagnostic tool for identifying very low concentrations of magnetite (Özdemir and Dunlop, Reference Özdemir and Dunlop1993). Low-temperature thermal demagnetization of SIRM (LT-SIRM) curves of 19 loess and paleosol samples are shown in Figure 4. The gradual decay of remanence during heating observed in both loess and paleosol units is related to the unblocking of SP particles (Özdemir and Dunlop, Reference Özdemir and Dunlop1993). The normalized LT-SIRM curves of paleosol samples are generally below those of the loess samples (Fig. 4a), which suggests that an increased proportion of SP particles in paleosols leads to a greater loss of magnetization during thermal demagnetization. The Verwey transition, an abrupt decrease at ~120 K, is present in all samples, indicating the existence of coarse-grained (PSD and MD) near-stoichiometric magnetite in both loess and paleosol units (Fig. 4). However, the Verwey transition is significantly suppressed in the paleosols (Fig. 4a).
(color online) Results of low-temperature thermal demagnetization of SIRM (LT-SIRM) for representative loess and paleosol samples. (a) Comparison of LT-SIRM curves for loess and paleosol samples. (b) First-derivative LT-SIRM normalized curves for loess samples. (c) First-derivative LT-SIRM normalized curves for paleosol samples.

The characteristics of the Verwey transition are a good indicator of the low-temperature oxidation of magnetite in sediments (Özdemir and Dunlop, Reference Özdemir and Dunlop1993; Liu et al., Reference Liu, Banerjee, Jackson, Maher, Pan, Zhu, Deng and Chen2004; Guo et al., Reference Guo, Banerjee, Wang, Zhao, Song, Bin, Li and Liu2018). During low-temperature oxidation, initially stoichiometric magnetite is altered to partially oxidized magnetite consisting of a reduced inner magnetite core surrounded by a maghemite shell, mainly of SP size (Liu et al., Reference Liu, Banerjee, Jackson, Chen, Pan and Zhu2003a).
The Verwey transition is sharp in pure magnetite and becomes less well defined and suppressed in partially oxidized magnetite, and with an increasing degree of oxidation, it is eventually blurred in normalized LT-SIRM curves (Özdemir and Dunlop, Reference Özdemir and Dunlop1993; Guo et al., Reference Guo, Banerjee, Wang, Zhao, Song, Bin, Li and Liu2018). The somewhat poorly defined Verwey transitions indicate that the magnetite in all of the samples has undergone some degree of oxidation (Fig. 4a).
We use the maximum amplitude of the first derivative peak of the Verwey transition at ~120 K in normalized curves (normalized dJ/dT@120K) to quantify the degree of low-temperature oxidation (Fig. 4b and c). A greater degree of low-temperature oxidation results in a gentler slope of the Verwey transition and a higher value (smaller amplitude) of the derivative peak (normalized dJ/dT@120K). Therefore, higher values of normalized dJ/dT@120K for the paleosols indicate a higher degree of oxidation of magnetite than in the loess units (Fig. 4b and c). The gradual decrease in the values of normalized dJ/dT@120K upward in the loess units in the section indicates a decreasing degree of low-temperature oxidation (Fig. 4b).
The Verwey transition temperature is distinctly lower in loess layer L1 and in paleosol S0 at ~105 K and ~100 K, respectively. This is most likely caused by the presence of small amounts of impurity cations, such as Ti4+ (Kakol et al., Reference Kakol, Sabol, Stickler and Honig1992, Reference Kakol, Sabol, Stickler, Kozowski and Honig1994), Al3+ (Kozovski et al., Reference Kozovski, Metcalf, Kakol and Honig1996), and Zn2+ (Kozovski et al., Reference Kozovski, Kakol, Zalecki and Honig1995).
Hysteresis loops
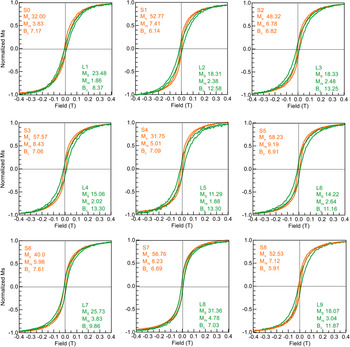
The shape of hysteresis loops can provide information about magnetic mineralogy and grain size and concentration (Dunlop and Özdemir, Reference Dunlop and Özdemir1997; Tauxe, Reference Tauxe2010). Hysteresis loops corrected for the paramagnetic contributions together with the hysteresis parameters of loess–paleosol couplets are shown in Figure 5. The hysteresis loops of all of the samples are nearly closed above 200–300 mT, indicating the dominance of low coercivity (ferrimagnetic) components, such as magnetite and maghemite. The loops for L9 and the younger loess samples (L6–L1) have potbellied shapes, with spreading in the central part. The loops for the more weathered samples from L7 and L8 and for all of the paleosol samples show a constriction in the central rectangular part of the loop. Wasp-waisted loops were not observed. The loess samples have wider loops closed at higher fields, lower Ms and Mrs values, and higher Bc values than the paleosols. This suggests higher contributions of high-coercivity phases such as hematite, goethite, or partially oxidized eolian magnetite in the loess and a higher proportion of low-coercivity ferrimagnets in the paleosols (Van Velzen and Dekkers, Reference Van Velzen and Dekkers1999b; Deng et al., Reference Deng, Zhu, Verosub, Singer and Vidic2004). The potbellied shapes of the hysteresis loops of the less weathered samples imply the presence of PSD/MD detrital magnetite, and the narrower and constricted loops in the paleosol samples suggest a higher contribution of ferrimagnetic material.
Hysteresis loops (corrected for paramagnetism) for representative loess and paleosol samples. Green and orange loops represent loess and paleosol units, respectively. (For interpretation of the references to color in this figure legend, the reader is referred to the web version of this article.)

The paramagnetic susceptibility values of paleosols are generally higher than those of the underlying loess within the same couplet; S0/L1 (Table 1) is an exception because of the relatively low paramagnetic susceptibility value of S0. The enhancement of the paramagnetic susceptibility indicates the neoformation of paramagnetic minerals during pedogenesis, which was confirmed by measurements of the clay fraction in Chinese loess (Hao et al., Reference Hao, Oldfield, Bloemendal and Guo2012a). The contribution of paramagnetic susceptibility to the low-field susceptibly (χpara/χ) within loess units varies from 28.75% to 52.45%, suggesting that caution is needed when making paleoclimatic inferences for weakly magnetic samples dominated by detrital ferrimagnetic minerals.
Magnetic hysteresis and concentration-related parameters (χ, χfd, χARM) for representative loess and paleosol samples.

FORC diagrams
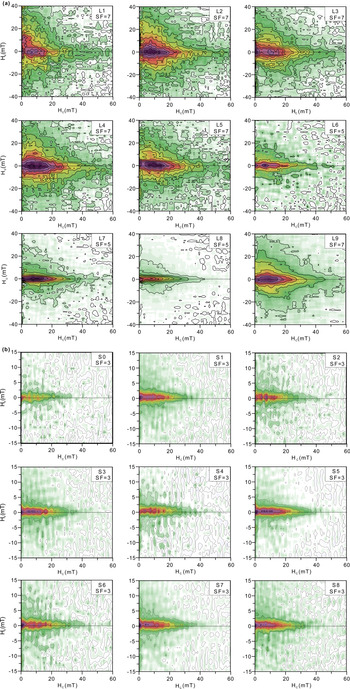
FORC diagrams are often used to identify magnetic mineral components, their domain status, and magnetic interactions (e.g., Roberts et al., Reference Roberts, Pike and Verosub2000; Pike et al., Reference Pike, Roberts, Dekkers and Verosub2001; Muxworthy and Dunlop, Reference Muxworthy and Dunlop2002). They offer substantial advantages over traditional Day-plot-derived parameters of the hysteresis loops (e.g., Tauxe, Reference Tauxe2010; Hao et al., Reference Hao, Oldfield, Bloemendal and Guo2012a; Roberts et al., Reference Roberts, Tauxe, Heslop, Zhao and Jiang2018). FORC diagrams for loess and paleosol samples are shown in Figure 6. The FORC diagrams for the loess samples generally exhibit closed inner contours with a peak at ~10 mT on the Hc axis and divergent outer contours along the Hu axis, mostly within the range ±40 mT, suggesting a significant contribution from coarse PSD and MD particles (Fig. 6a). In addition, the secondary peaks at the origin of the FORC diagrams indicate the presence of SP particles (Roberts et al., Reference Roberts, Pike and Verosub2000; Carvallo et al., Reference Carvallo, Muxworthy, Dunlop and Williams2003). In loess units L6–L8, the decreased vertical spread of the contours along the Hu axis and the increased contour density along the Hc axis imply a decreasing contribution of coarse MD and PSD particles (Roberts et al., Reference Roberts, Pike and Verosub2000; Pike et al. Reference Pike, Roberts, Dekkers and Verosub2001).
(color online) First-order reversal curve (FORC) diagrams for representative loess (a) and paleosol (b) samples.

For the paleosol samples, the main parts of the FORC distributions (Fig. 6b) consist of a central ridge concentrated along the Hc axis (at Hu = 0 mT), with negligible vertical spread and open contours near the origin; these characteristics indicate the contribution of non-interacting SD particles and SP particles, respectively (e.g., Geiss et al., Reference Geiss, Egli and Zanner2008; Egli et al., Reference Egli, Chen, Winklhofer, Kodama and Horng2010). In addition, the weaker triangular shape of the outer contours in the paleosol samples indicates the presence of a minor amount of PSD grains (Muxworthy and Dunlop, Reference Muxworthy and Dunlop2002; Roberts et al., Reference Roberts, Heslop, Zhao and Pike2014).
Parameters indicative of the concentration of magnetic minerals
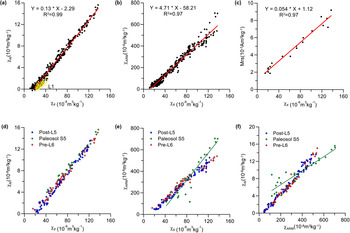
χlf, χfd, and χARM are commonly used to indicate variations in the concentration of ferrimagnetic minerals; χlf provides information about the total content of ferrimagnetic minerals, and χfd and χARM reflect the concentration of viscous SP particles (in the SP/SD transition zone) and SD particles, respectively (Thompson and Oldfield, Reference Thompson and Oldfield1986). Stratigraphic variations in χlf, χfd, and χARM are shown in Figure 2, and they show nearly covarying trends with higher values in paleosols compared with the underlying loess units. The strong positive linear correlations between χfd and χlf, χARM and χlf (Fig. 7) further suggest that the concentration of fine-grained SP and SD ferrimagnets is significantly increased in paleosols and results in the enhancement of their magnetic properties.
Scatter plots of χlf vs. χfd (a), χlf vs. χARM (b), χlf vs. Mrs (c) for loess and paleosol samples; scatter plots of (d) χlf vs. χfd, (e) χlf vs. χARM, (f) χARM vs. χfd for paleosols in three groups: post-L5 (S0–S4, blue), S5 (green), and pre-L6 (S6–basal soil complex, red). (For interpretation of the references to color in this figure legend, the reader is referred to the web version of this article.)

The χlf axis intercept (χ0) in a χfd–χlf plot can be used to roughly estimate the detrital contribution to the total susceptibility without pedogenic effects (Forster et al., Reference Forster, Evans and Heller1994; Liu et al., Reference Liu, Banerjee, Jackson, Maher, Pan, Zhu, Deng and Chen2004; Zan et al., Reference Zan, Fang, Li, Yan and Kang2019). As shown in Figure 7a, the value of χ0 for the loess/paleosol units is nearly constant, with an average of 18.8 × 10⁻⁸ m3/kg, with the exception of slightly higher values in L1 (χ0 is 21.9 × 10⁻⁸ m3/kg).
DISCUSSION
Magnetic mineralogy
Our measurements of a comprehensive suite of magnetic parameters enable us to determine magnetic mineralogy and concentration and grain size for the Serbian loess–paleosol sequence extending back to ~1.0 Ma. The ferrimagnetic minerals are magnetite and maghemite, and the variations in their magnetic properties are mainly linked with the amount of fine grains produced during varying levels of pedogenesis.
The ferrimagnetic assemblages of the loess units consist mainly of coarse-grained magnetite with lesser amounts of maghemite. The pronounced Verwey transition near 120 K (Fig. 4b) in the loess samples indicates the presence of PSD/MD stoichiometric magnetite. The FORC diagrams also demonstrate that the ferrimagnetic grain-size distribution of loess samples is mainly within the PSD–MD range (Fig. 6a). Coarse-grained magnetite particles in sediments are usually regarded as being of detrital origin (e.g., Oldfield et al., Reference Oldfield, Hao, Bloemendal, Gibbs-Eggar, Patil and Guo2009). A minor amount of SP maghemite is also present, as suggested by the open contours near the origin of the FORC diagrams (Fig. 6a), by the gradual remanence decay during heating evident in the LT-SIRM curves (Fig. 4), as well as by a minor susceptibility decrease between ~330°C and ~420°C in the χ-T heating curves of the loess units (Fig. 3b). Although part of the susceptibility loss may be the result of neoformed maghemite, which corresponds to the hump at ~300°C, the more pronounced susceptibility loss in the older loess samples (such as L5–L8), with a low amplitude of the hump, strongly suggests that the susceptibility decrease is at least partly caused by the transformation of original maghemite to hematite (Fig. 3b). These small fractions of SP maghemite possibly originate from the low-temperature oxidation of magnetite and/or weak pedogenesis (Özdemir and Dunlop, Reference Özdemir and Dunlop1993).
The ferrimagnetic minerals maghemite/magnetite are significantly enriched in paleosols, as widely reported for loess deposits in midlatitudes (Maher and Thompson, Reference Maher and Thompson1991; Geiss et al., Reference Geiss, Egli and Zanner2008; Necula et al., Reference Necula, Dimofte and Panaiotu2015). In the χ-T heating curves, the amplitude of susceptibility decrease between ~300°C and ~420°C (or extending to at least ~500°C) is much higher in the paleosol than in the loess samples (Fig. 3). In the Chinese Loess Plateau, this susceptibility decrease has been used to quantitatively estimate the abundance of pedogenic maghemite (Gao et al., Reference Gao, Hao, Oldfield, Bloemendal, Deng, Wang and Song2019). The ferrimagnetic minerals of pedogenic origin are mainly SP and SD, as indicated by the FORC diagrams (Fig. 6b). The positive correlations of χlf vs. χfd, χlf vs. χARM, and χARM vs. Mrs clearly show that fine-grained ferrimagnets are mainly responsible for the magnetic enhancement of the paleosols and weathered loess (Fig. 7). Coarse-grained magnetite is also present in the paleosols, as indicated by the Verwey transition near 120 K (Fig. 4c).
Changes in the ferrimagnetic minerals in our section follow a pedogenic magnetic enhancement model widely reported in many of the areas of loess distribution in Europe. These regions include the middle and lower reaches of the Danube River basin, parts of the great east European platform and the adjacent lowlands, and the loess belt north of mountainous regions (Haase et al., Reference Haase, Fink, Haase, Ruske, Pécsi, Richter, Altermann and Jäger2007). Generally, in all these regions, the maximum susceptibility values of paleosols are up to two to seven times higher than those of typical loess layers, as in the loess deposits in Romania and Bulgaria (Jordanova et al., Reference Jordanova, Hus and Geeraerts2007; Necula et al., Reference Necula, Dimofte and Panaiotu2015), Hungary (Sartoria and Bakhmutov, Reference Sartori, Heller, Forster, Borkovec and Vincent1999), the Ukraine (Bakhmutova et al., Reference Bakhmutov, Kazanskii, Matasova and Glavatskii2017), and the Czech Republic (Forster et al., Reference Forster, Heller, Evans and Havliček1996). The values are approximately four to seven times higher in our studied sequences. Magnetic enhancement of paleosols is caused by the production of fine-grained (SP and SD) magnetite/maghemite by pedogenic processes (Oches and Banerjee, Reference Oches and Banerjee1996; Jordanova et al., Reference Jordanova, Hus and Geeraerts2007; Buggle et al., Reference Buggle, Hambach, Müller, Zöller, Marković and Glaser2014; Necula et al., Reference Necula, Dimofte and Panaiotu2015). However, in parts of the loess belt north of the mountainous regions and in the east European platform, waterlogging under pervasive periglacial conditions tends to cause the dissolution of magnetic particles, which imparts a degree of complexity to the magnetic records of the loess sections. For example, in Germany, the Czech Republic, and Poland, the susceptibilities of waterlogged paleosols are greatly reduced or even lower than those of loess units (Baumgart et al., Reference Baumgart, Hambach, Meszner and Faust2013; Jary and Ciszek, Reference Jary and Ciszek2013; Hošek et al., Reference Hošek, Hambach, Lisá, Grygar, Horáček, Meszner and Knésl2015). Variations in magnetic susceptibility caused by the input of detrital ferrimagnetic particles are generally lower than 20 × 10–8 m3/kg in specific loess sections, such as those in Germany and Poland (Jary and Ciszek, Reference Jary and Ciszek2013; Taylor et al., Reference Taylor, Lagroix, Rousseau and Antoine2014). In the Danube basin detrital magnetic susceptibilities are generally constant within a section; for example, in the studied section, it is 18.8 × 10⁻⁸ m3/kg, while the values vary between different sections, ranging from ~10 × 10–8 m3/kg to ~30 × 10–8 m3/kg (Avramov et al., Reference Avramov, Jordanova, Hoffmann and Roesler2006; Buggle et al., Reference Buggle, Hambach, Müller, Zöller, Marković and Glaser2014; Zeeden et al., Reference Zeeden, Hambach, Obreht, Hao, Abels, Veres, Lehmkuhl, Gavrilov and Marković2018). The foregoing comparison indicates that the rock magnetic stratigraphy of the loess sections in the Danube basin is consistent with the pedogenic magnetic enhancement model.
Consistency of the ferrimagnetic grain size of the paleosols
During the middle Pleistocene, there was a general weakening of the influence of Mediterranean climate during interglaciations in southeastern Europe (e.g., Marković et al., Reference Marković, Hambach, Catto, Jovanović, Buggle, Machalett, Zöller, Glaser and Frechen2009; Buggle et al., Reference Buggle, Hambach, Kehl, Marković, Zöller and Glaser2013, Reference Buggle, Hambach, Müller, Zöller, Marković and Glaser2014; Obreht et al., Reference Obreht, Zeeden, Hambach, Veres, Marković, Bösken, Svirčev, Bačević, Gavrilov and Lehmkuhl2016). In the Carpathian basin, a climatic transition from a Mediterranean to a continental climatic regime culminated during Marine Oxygen Isotope Stage 9 (MIS 9), as identified, for example, in the Batajnica and Stari Slankamen loess profiles, where a shift from Cambisols to steppic soils (mostly Chernozem) occurred in the S3 unit (MIS 9) (Bronger, Reference Bronger2003; Buggle et al., Reference Buggle, Hambach, Kehl, Marković, Zöller and Glaser2013).
An interesting question is whether the changes in climate and soil type resulted in a change in the relationship between loess magnetic properties and climate, which is the basis for the use of sedimentary magnetic properties in paleoclimatic reconstruction. A previous study of the SE European loess–paleosol sequences highlighted the possibility of the preferential destruction of fine-grained magnetic particles in older paleosols (e.g., Liu et al., Reference Liu, Liu, Lu, Marković, Chen, Guo, Ma, Zhao and Feng2013; Buggle et al., Reference Buggle, Hambach, Müller, Zöller, Marković and Glaser2014). Extending a similar investigation to the last 1.0 Ma of the studied loess–paleosol sequence may help to better identify the linkage between the loess magnetic properties and climate.
To address this issue, we divided the paleosol samples into three groups: post-L5 (S0–S4), S5, and pre-L6 (S6–basal soil complex), and then investigated the correlation between χlf, χfd, and χARM for the samples from the three groups (Fig. 7d–f). The samples from the younger and older subgroups have the same slope of χlf vs. χARM and χARM vs. χfd (Fig. 7e and f), except for the S5 subgroup. If significant dissolution of fine-grained ferrimagnetic minerals occurred during the formation of the older paleosols, SP particles would have been preferentially destroyed compared with SD particles, which would have led to a decrease in the χfd to χARM ratio. However, the fact that the χfd/χARM ratio remains constant refutes this dissolution model. Although a slight decrease in the χfd to χARM ratio (Fig. 7f) and an increase in the χARM to χlf ratio (Fig. 7e) may indicate some dissolution of the SP particles in S5, the occurrence of the highest values of the magnetic concentration parameters in S5 (Fig. 2) suggests that the dissolution was not significant. This is consistent with field-based pedological observations showing that the strongest soil development occurred in S5. Thus, the overall consistency of the ferrimagnetic grain size of the paleosols provides strong support for the future application of magnetic parameters to paleoclimatic reconstruction.
Furthermore, the nearly constant χ0 in the profile (Fig. 7a) indicates that contributions of detrital magnetic components were relatively constant during the last ~1.0 Ma. Therefore, we conclude that the stratigraphic variations in the magnetic properties of the Serbian loess are driven mainly by climatically related pedogenetic processes.
Paleoclimatic implications of the long-term variations in magnetic properties
Changes in magnetic minerology and magnetic properties provide important information on past climatic changes in northern Serbia. This is also supported by the positive correlation between mean annual precipitation and χlf and χfd of the modern soils on the Bačka Loess Plateau in Vojvodina (Radaković et al., Reference Radaković, Gavrilov, Hambach, Schaetzl, Tošić, Ninkov, Vasin and Marković2019). Here, we mainly address the long-term variations in regional climate indicated by the stratigraphic variations in the magnetic properties of the studied loess–paleosol sequence.
Evidence for long-term glacial and interglacial (mainly glacial) climatic fluctuations in northern Serbia can be seen in two parameters derived from the thermomagnetic experiments. The first is the value of the first-derivative peak around the Verwey transition at ~120 K in the normalized LT-SIRM curve (normalized dJ/dT@120K). As mentioned earlier, this proxy can be used to quantify the degree of low-temperature oxidation of magnetite in sediments (Özdemir and Dunlop, Reference Özdemir and Dunlop1993). An increasing intensity of pedogenesis would enhance the degree of low-temperature oxidation of magnetite. The higher values of normalized dJ/dT@120K in the paleosols compared with the loess units indicate that the paleosols have undergone a greater degree of low-temperature oxidation/pedogenesis (Fig. 2).
The second proxy is the susceptibility value at ~530°C in the normalized χ-T heating curves (normalized χheating@530°C); it is mainly determined by two components: the maghemite concentration and the amount of thermally unstable iron-bearing clay/silicates, and both components are affected by pedogenesis. With an increasing degree of pedogenesis greater amounts of pedogenic maghemite would be produced, and iron-bearing clay/silicates would be depleted. During heating, pedogenic maghemite will lead to a decrease in the normalized susceptibility, and the depletion of iron-bearing clay/silicates will lead to less neoformation of magnetite produced above 420°C. These two processes will suppress the susceptibility peak at ~530°C in weathered loess units and paleosols. Thus, the values of normalized χheating@530°C decrease from the loess to the weathered loess/weak paleosol, and then to the well-developed paleosol (Supplementary Fig. 2). Although a higher content of organic matter in the younger samples may also influence the values, the variations are generally consistent with those of normalized dJ/dT@120K. The foregoing interpretation is strongly supported by studies of Holocene eolian deposits along a NW-SE transect in the Chinese Loess Plateau (Deng et al., Reference Deng, Zhu, Verosub, Singer and Yuan2000, Reference Deng, Zhu, Jackson, Verosub and Singer2001), which found that the peak susceptibility at ~530°C in normalized curves decreased toward the southeast, in accordance with the gradient of increasing pedogenesis (Deng et al., Reference Deng, Zhu, Jackson, Verosub and Singer2001).
It should be noted that the variations of the two proxies are more prominent in the loess units, which suggests that they are more sensitive to pedogenesis or low-temperature oxidation in more arid conditions compared with other commonly used magnetic proxies related to the concentration of pedogenic magnetic minerals. Routine magnetic parameters are usually insensitive in arid conditions or muted to climate changes when precipitation decreases to a threshold value, such as when the mean annual precipitation is below 300–400 mm (e.g., Maher et al., Reference Maher, Alekseev and Alekseeva2003; Song et al., Reference Song, Hao, Ge, Zhao, Zhang, Li, Zuo, Lü and Wang2014; Gao et al., Reference Gao, Hao, Wang, Oldfield, Bloemendal, Deng and Song2018).
Both normalized dJ/dT@120 K and normalized χheating@530°C show clear glacial–interglacial variations as well as long-term decreasing/increasing trends through the section, with larger amplitudes above L5. Such a long-term trend is more pronounced during glacials. Therefore, SE Europe experienced two intervals of long-term, stepwise aridification, one at ~1.0 Ma and the other at ~0.6–0.5 Ma. The intensified aridification at ~1.0 Ma is evidenced by the start of continuous and widespread loess deposition in the Carpathian Basin at ~1.0 Ma (Marković et al., Reference Marković, Hambach, Stevens, Kukla, Heller, McCoy, Oches, Buggle and Zöller2011; Sümegi et al., Reference Sümegi, Gulyás, Molnár, Sümegi, Almond, Vandenberghe and Zhou2018).
A trend of progressive aridification over the past 0.7 Ma is recorded in the clay mineralogy and geochemical weathering proxies such as Chemical proxy of alteration (CPA), Chemical index of alteration (CIA), Rb/Sr from loess deposits in the Carpathian basin, and it is usually linked to the uplift of the surrounding mountain ranges (Varga et al., Reference Varga, Újvári and Raucsik2011; Buggle et al., Reference Buggle, Hambach, Kehl, Marković, Zöller and Glaser2013; Újvári et al., Reference Újvári, Varga, Raucsik and Kovács2014). Our longer record indicates that the aridity was supra-regional in the interior of Eurasia, as the pattern is generally in phase with that in Central Asia and northern China, where a similar long-term, stepwise aridification occurred at ~1.0 Ma and at ~0.6–0.5 Ma. For example, the pollen record of the central Chinese Loess Plateau (Chaona section) indicates major shifts in vegetation from forest–steppe to open forest–steppe at 0.95 Ma, and then to steppe at 0.5 Ma (Wu et al., Reference Wu, Fang, Ma, An and Li2004). Grain-size and dust-flux records from a loess core from midlatitude Asia on the southern margin of the Tarim basin reveal long-term stepwise increases at 1.1 Ma and 0.5 Ma (Fang et al., Reference Fang, An, Clemens, Zan, Shi, Yang and Han2020), and that a stepwise expansion of the Mu Us Desert occurred at 1.1 Ma and 0.6 Ma (Ding et al., Reference Ding, Sun and Liu1999).
This trend is consistent with expansions of Northern Hemisphere ice volume (Clark et al., Reference Clark, Alley and Pollard1999). The decreasing sea level and sea-surface temperature in response to the increasing ice volume would have reduced moisture supplied by Atlantic air masses, either by increasing the distance from the sea or by decreasing the air moisture content, which would have intensified the aridity of the European interior and even further inland. Higher atmospheric pressure established over the expanding northern European ice sheets would also have deflected the westerlies southward and reduced the transfer of Atlantic moisture. Therefore, the expansion of Northern Hemisphere ice sheets was possibly the primary forcing factor of the aridification trend over the past ~1.0 Ma.
CONCLUSIONS
We have produced the first systematic, multiparameter rock magnetic data set from one of the most continuous European loess–paleosol sequences spanning the last 1.0 Ma. Ferrimagnetic assemblages in the loess units mainly consist of detrital coarse-grained PSD/MD magnetite with a small amount of SP maghemite, which may be produced by the low-temperature oxidation of magnetite and weak pedogenesis; the magnetic properties of the paleosols are dominated by the presence of pedogenic SP and SD maghemite/magnetite. The ferrimagnetic grain size (χfd/χARM ratio) of the paleosols is roughly constant over the past 1.0 Ma, which suggests that, with the possible exception of S5, a magnetic dissolution model is not applicable. Therefore, environmental magnetic parameters of these loess deposits can reliably be used for paleoclimatic reconstruction.
The long-term upward-increasing trend in normalized dJ/dT@120K and normalized χheating@530°C indicates a stepwise aridity trend during the past 1.0 Ma, with a major step at ~0.6–0.5 Ma, which is consistent with records from Central and East Asia. This trend was forced by ice volume expansion at high northern latitudes.
Supplementary Material
The supplementary material for this article can be found at https://doi.org/10.1017/qua.2021.41
Acknowledgments
We thank M. Jovanović, N. Tomić, I. Obreht, T. Dulić, T. Vazić, L. Chang, J. Wu, and N. Milojković for field assistance; U. Hambach and L. Wang for constructive discussions; S. Liu, K. He, and M. Zhang for help with the magnetic measurements; and J. Bloemendal for improving the English language of the article. Critical comments from senior editor N. Lancaster and reviewers C. Geiss and J. Zan have significantly improved the article.
Financial Support
This study was supported by the National Key Research and Development Program (2017YFE0112800), the National Natural Science Foundation of China (NSFC 41625010, 41888101, and 41690114), and the Strategic Priority Research Program of the Chinese Academy of Sciences (XDB26000000). This study is also supported by the First Program of the Chinese–Serbian Developing Projects (project title: “A Comparative Study of Past Climate Change in the East Asian Monsoon Region and the Westerly Zone Using Multiple Timescales”).