I. INTRODUCTION
Application of millimeter-wave (mm-wave) methods to material characterization in general and biological and chemical sensing in particular are rapidly growing. Sensing methods are divided into electrochemical, resonance, reflectometry, and quasi-optical techniques [Reference Gagnon, Shaker, Berini, Roy and Petosa1, Reference Yoshikawa and Nakayama2], among which the resonance technique has proven to provide the highest sensitivity. Different types of resonators, including whispering gallery mode (WGM) resonance, have been proposed for sensing applications. WGMs are high-order modes inside a dielectric disk resonator (DDR) [Reference Annino, Cassettari, Longo and Martinelli3]. One of the main advantages of a WGM-based resonator is its larger dimension in terms of wavelength, which makes its fabrication less difficult and more tolerant to dimensional errors as compared with the lower-order resonator modes. Although the dielectric resonators, surrounded in a closed box, are being considered as high-Q-factor resonators, WGM resonators show high-Q-factor resonances among the open structures [Reference Krupka, Tobar, Hartnett, Cros and Floch4–Reference Creedon, Reshitnyk, Farr, Martinis, Duty and Tobar6].
In a disc resonator, WGMs, with small axial propagation constant, travels azimuthally close to the resonator boundary [Reference Vedrenne and Arnaud7]. The excitation type and physical parameters of the resonator determine the mode number of the WGM inside the resonator. The WGE n00 and WGH n00 modes are the most desirable WGMs for sensing, because most of their electromagnetic energy is essentially confined to a small region close to the boundary of DDR. Consequently, any small perturbation close to the boundary of DDR affects the resonance characteristics and results in a higher sensitivity. Therefore, WGMs offer a unique possibility for distinguishing between the materials with extremely small differences in properties. Also, WGM-based resonators are used as highly effective sensing elements in many bio-sensing applications such as detection of proteins, toxin molecules, and DNAs [Reference Vollmer and Arnold8]. Blair and Chen [Reference Blair and Chen9] pioneering work has demonstrated how a WGM-based resonator can be used as a cavity sensor to enhance the sensitivity, and to reduce the sample size. Since then, many other groups reported sensitive methods, based on WGM resonators, for detecting nano-scale samples and single bio-molecules by using micro-resonators [Reference Zhu10, Reference Quan and Guo11].
In this paper, we propose a low cost, and integrable sensor device operating in WGM resonance at the frequency ranges beyond 85 GHz. The sensor structure consists of DDR, excited by a dielectric image guide (DIG). The proposed DDR is optimally coupled with the DIG, to maximize the sensitivity. An efficient variational method is also developed and applied to the WGM resonator to improve the accuracy of resonance calculation. It is shown that by employing the variational method the error is decreased from around 1 to 0.23%. The bio-sensor under investigation in this research has the potential to be used for sensing different bio-chemical samples including DNA.
II. ELECTROMAGNETIC RESONANCE MODES OF A GROUNDED DDR
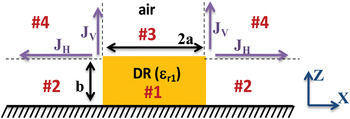
Analysis of higher-order resonant modes of a DDR involves simplifying assumptions. Different approaches including the numerical methods have been proposed for this problem [Reference Kajfez and Guillon12]. An accurate technique was reported in [Reference Tsuji, Shigesawa and Takiyama13], in which Maxwell's equations for a DDR are solved in a spherical coordinate system. Then, by minimizing the error at the boundaries, the complex resonance frequency is obtained. In this paper, for reducing the computational time and complexity, the approach explained in [Reference Tobar and Mann14] is adopted and implemented. This approach is a combination of the effective dielectric constant (EDC) method and dielectric waveguide model (DWM). The structure under consideration is a disc resonator, placed on a ground plane as shown in Fig. 1. The simplifying assumption, for calculating the resonance frequency, is that the fields in sub-region 4 are assumed to be identically zero as it can be argued that for confined (non-radiating) resonant modes the fields in this region decay much faster than those in the other regions. In Section III, a variational technique will be applied to alleviate the effect of the boundary field error due to the aforementioned assumption. For this purpose, the equivalent surface currents are assumed at the interfaces of sub-region 4 with its neighbors as shown in Fig. 1.
Cross-sectional view of a grounded DDR with equivalent surface currents.

In order to find an initial estimate of the resonance frequency of a DDR, an EDC–DWM approach is used. To this end, two sets of dispersion equations are obtained: (1) axial dispersion equations, which are derived by field matching over the horizontal interface between sub-regions 1 and 3; and (2) radial dispersion equation, which is derived by field matching over the curved wall around the resonator (the interface between sub-regions 1 and 2). The propagation and attenuation constants are calculated by solving the axial and radial dispersion equations simultaneously. Then the resonance frequency is obtained from the calculated propagation and attenuation constants. The dispersion equations of a single-layer DIG for both possible polarizations are calculated by satisfying the boundary condition in the z direction:
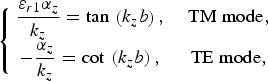
where k z and α z are the axial wave numbers in dielectric and air, respectively, and they are related by

To obtain the radial dispersion equation, Maxwell equations are solved for an infinite dielectric cylinder. The dispersion equation of an infinite dielectric cylinder is derived by matching the tangential components of the E and H fields at the boundaries [22]:
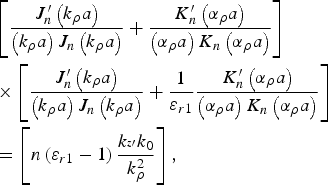
where


k z′ is the axial propagation constant of an infinite dielectric cylinder, and J(.) and K(.) are the first- and second-order Bessel functions, respectively, and k 0 is the free space wave number. By solving (3)–(5), at different frequencies and for a specific mode number, n, the corresponding dispersion plot of a dielectric cylinder is determined. To solve (3)–(5), various numerical methods or analytical approximations can be used. In this paper, an efficient algorithm is used to solve these coupled nonlinear equations. The algorithm starts with the initial value of δ = (ɛr1 − 1)/(ɛr1) = 0 (mostly applicable in the optical range of frequencies), which corresponds to a weakly guided mode. Satisfying the weakly guiding condition, the right-hand side of (3) is zero [Reference Okamoto15]. Accordingly, two decoupled equations are obtained:


In the next step, the corresponding propagation constants are derived through (6) or (7). Then, the value of δ is updated repeatedly as αρ is decreased by a small amount Δ. This procedure is repeated, until the error of δ falls in acceptable range. To improve the accuracy and speed of the algorithm, the asymptotic values of (3) are used to avoid spurious modes. In cylindrical dielectric waveguide problems, the modes are separated from each other by small differences in the radial propagation constants k ρ. Therefore, the asymptotic technique can be used to determine the proper search interval for k ρ. To improve the accuracy of resonance frequency calculation, the permittivity of a disc resonator can be replaced by an effective one, ɛeff = k ρ2/k 02, which is obtained for an infinite dielectric cylinder [Reference Mongia16]. In the last step, the resonance frequency should be calculated. Satisfying both (1) and (3) determines a specific axial propagation constant, k zr. Accordingly, the corresponding resonance frequency is directly obtained from k zr. Graphically, the intent is to find the intersection point of the calculated axial and radial dispersion plots. In the next section, the variational method is used to improve the accuracy of the calculated initial resonance frequency [Reference Jaworski and Pospieszalski17].
III. AN EFFICIENT VARIATIONAL-BASED METHOD FOR IMPROVING THE ACCURACY
The variational method is used to improve the accuracy of the resonance frequency calculation, when a reasonably accurate estimate of the field distribution in the resonator is known. Most of the stationary formulas are expressed as a ratio between different types of stored energies in the sub-regions. Among different variational expressions, the one which is based on the self-reaction principle [Reference Rumsey18] is used to find the resonance frequency of cavity (shown in Fig. 1). A stationary formula, which only depends on the trial electric field terms, can be written as

For a grounded dielectric resonator, the surface integral in the numerator of (8) originates from the surface electric currents, J V and J H, as shown in Fig. 1. The volume integral in (8) should apply to the sub-regions, denoted as 1–3 in Fig. 1.
IV. THE PROPOSED INTEGRATED STRUCTURE
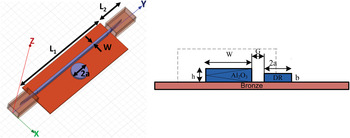
The proposed WGM sensor is shown in Fig. 2. It consists of a DDR coupled to a DIG. To characterize the WGM resonator by measuring instruments with metallic waveguide ports, the DIG is tapered at both ends and inserted inside metallic rectangular waveguides. The height of the resonator has a significant effect on the sensitivity and coupling. The design methodology consists of three steps: first, the DIG, which is made from alumina and the tapering sections, are designed to provide dominant mode operation, and low transmission loss. Second, the DDR is designed such that, it supports desired WGM, e.g. WGH 700, in the frequency range of interest. Choosing the mode number as a designed parameter, is crucial. The low-order modes (n ≤ 5) are radiating with low Q-factor, and very-high-order modes (n ≥ 10) are not at all suitable for sensing applications [Reference Krupka, Derzakowski, Abramowicz, Tobar and Geyer19]. The reason is that the relatively higher-order modes need a larger size of DDR for operating in the same desired range of frequency. In addition, the higher-order modes (n ≥ 10) are very confined, and are not suitable for sensing, because higher-order modes have very small evanescent field tail, which is necessary to sense the external perturbation, outside of DDR. Another important design parameter is the radius of the DDR. Relatively large radius, related to high-order modes within the desired range of frequency, increases the loss and dictates a small gap between DDR and DIG. The type of WGM is determined by the polarization of the excitation and physical parameters of the DDR. In the last design step, the gap distance between the DDR and DIG is calculated to maximize the sensitivity.
The proposed sensor structure.

Although critical coupling increases the sensitivity of the system on one hand, the sensor would become sensitive to environmental variations including temperature and moisture on the other hand. Therefore, practically the DDR should not be placed in the critical coupling.
V. THE SENSOR PROTOTYPES AND COMPARISON WITH THE NUMERICAL SOLUTIONS
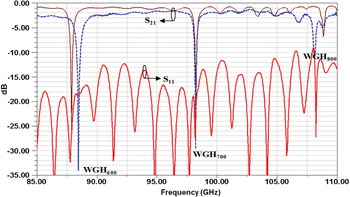
After comprehensive study and simulations, three sets of sensors in three different ranges of frequency, covering from 85 to 220 GHz, were fabricated. The first prototype was designed, fabricated, and tested within the frequency range of 85–110 GHz. The thickness of DIG is 1 mm and the disc resonator radius is 1.55 mm. Figure 3 shows the comparison of the scattering parameters between the simulation and measurement results for the prototype designed at W-band. The structure shows three distinct WGM resonances within the desired range of frequency.
Comparison of scattering parameter between numerical simulation (solid) and measurement (dashed) at W-band.

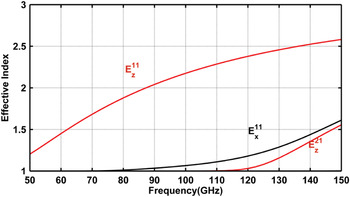
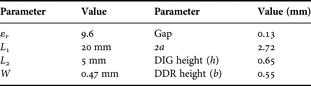
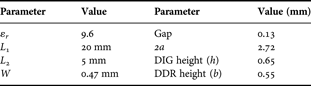
As the design procedure is the same for all the prototypes, it is discussed in detail only for the second prototype, operating at D-band range. First, the DIG is designed in such a way that the structure supports dominant mode operation in our desired frequency band. The modal analysis of the DIG is performed by using the EDC method. The dispersion plots for different modes are depicted in Fig. 4 for the design parameters given in Table 1. The dominant mode is the E z11 mode, although the E x11 mode has the potential to be excited inside the waveguide. One of the advantages of using the metallic waveguide for excitation is to support only the z-polarized modes. The tapered sections are designed in the manner that the minimum insertion loss is achieved.
Modal analysis of the DIG using the EDC technique.

Design parameters of the sensor at D-band.
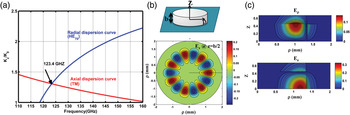
The most critical and important part is the design of the DDR. Following the same procedure, explained in Section II, proper physical parameters of the resonator are calculated. The DDR is designed to support a WGM resonance with a minimum order of 7 at D-band. To calculate the approximate resonance frequency, first the radial dispersion equation is solved. Also, the axial dispersion equation is calculated for a grounded single-layer slab waveguide. Then, the corresponding resonance frequency is calculated as 123.40 GHz, as shown in Fig. 5. Different components of the electrical field are plotted in different cross sections, as observed in Fig. 5. The excited resonance mode inside the resonator is WGH 700. The analytical calculation is verified by the eigenmode solution, obtained from the commercial full-wave simulator, Ansoft HFSS.
(a) Axial and radial dispersion curves of the DDR. (b) Normalized E z field component in the DDR for WGH 700 mode in the XY-plane. (c) Normalized electric field components in the DDR for WGH 700 mode in the XZ-plane.

The variational method, described in Section III, is applied to the problem to reduce the error in resonance frequency calculation, as a result of ignoring the fields in the corner sub-regions. The modified resonance frequency after using the variational method is found to be 124.34 GHz when compared with the initial value of 123.4 GHz. The accurate resonance frequency obtained from the full-wave simulation is 124.65 GHz. Table 2 compares two sets of resonance frequencies, obtained from the proposed technique and the full-wave simulation, for the D-band design.
A comparison between the calculated resonance frequency by the proposed algorithm, and the full-wave simulation for D-band design.

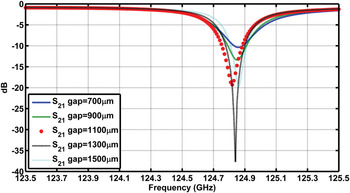
The depth of resonance is directly related to the DDR distance from the DIG. Choosing a proper depth, the system sensitivity to the environment conditions can be decreased at the cost of decreasing the selectivity margin of the sensor. Hence, a trade-off should be taken into account to choose the appropriate gap between the DIG and DDR. Figure 6 demonstrates the effect of the gap in the resonance response.
Effect of gap on the resonance response of DDR–DIG (simulation).

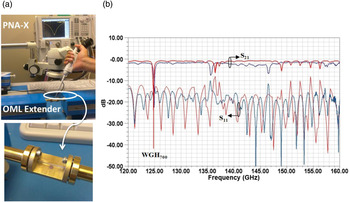
After performing comprehensive simulations, the prototype structure was made and tested as shown in Fig. 7(a). To fix the position of the DIG and the DDR over the metallic base, a low-loss epoxy glue was used. Although small drops of epoxy glue were used, the loss increment, due to the presence of the glue, is inevitable. Considering the fact that the desired mode inside the DIG is almost confined in the center, fixing the waveguide from the sides with a few glue drops has no significant effect on the field distribution. Since the resonator field is sensitive to any perturbation, fixing the DDR with glue should be handled with care. To get rid of this undesired effect, the bottom of the DDR is metalized. The overall functionality of the proposed sensor is verified by using the full-wave simulation. Figure 7 illustrates the experimental setup, consisting of an Agilent PNA-X, two harmonic mixers from OML at D-band, and the proposed sensor device. It should be noted that our measurement facility is based on the waveguide, and will provide a good matching at the device ports. The transmission and reflection responses of the system are depicted in Fig. 7(b). The fabricated setup shows three distinct WGM resonances. The resonance around 125 GHz is chosen for the sensing application. This resonance corresponds to the WGH 700 mode, which is a traveling wave. This means that there is a small reflection as well as a small transmission at the same frequency. In addition, most of the electromagnetic energy is captured inside the DDR.
(a) Measurement setup and the fabricated sensor device. (b) Comparison between the measured (dashed) and simulated (solid) scattering parameters along with the full-wave-simulated field distribution inside the DDR for WGH 700 mode.

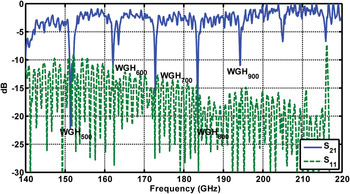
The final prototype sensor was designed and fabricated at the range of 140–220 GHz. The reason for designing in higher range of frequency is to increase the selectivity and accuracy of device at the cost of complexity in assembling and measurement. The design procedure is exactly the same as that of the two other sensors. Figure 8 shows the measurement result for the full setup including the transitions and metallic waveguide ports for a dielectric waveguide with 0.5 mm height coupled to a DDR with a radius of 0.95 mm.
Measured scattering parameters of the WGM-based sensor for 140–220 GHz.

VI. EXPERIMENTAL RESULTS FOR THE GLUCOSE SAMPLE USING THE SENSOR AT D-BAND
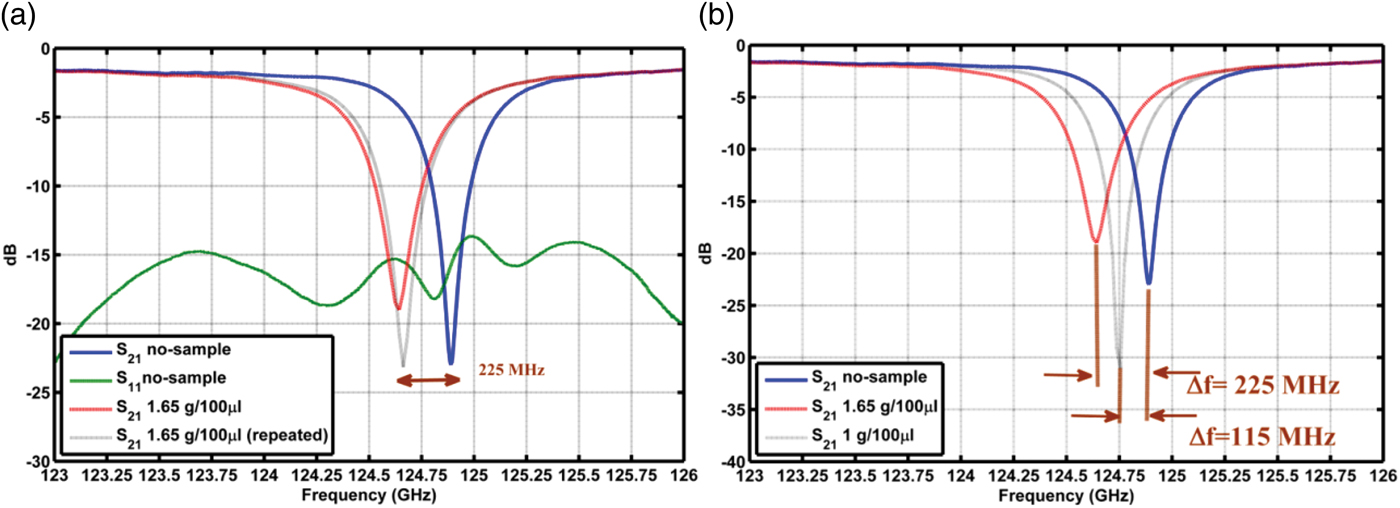
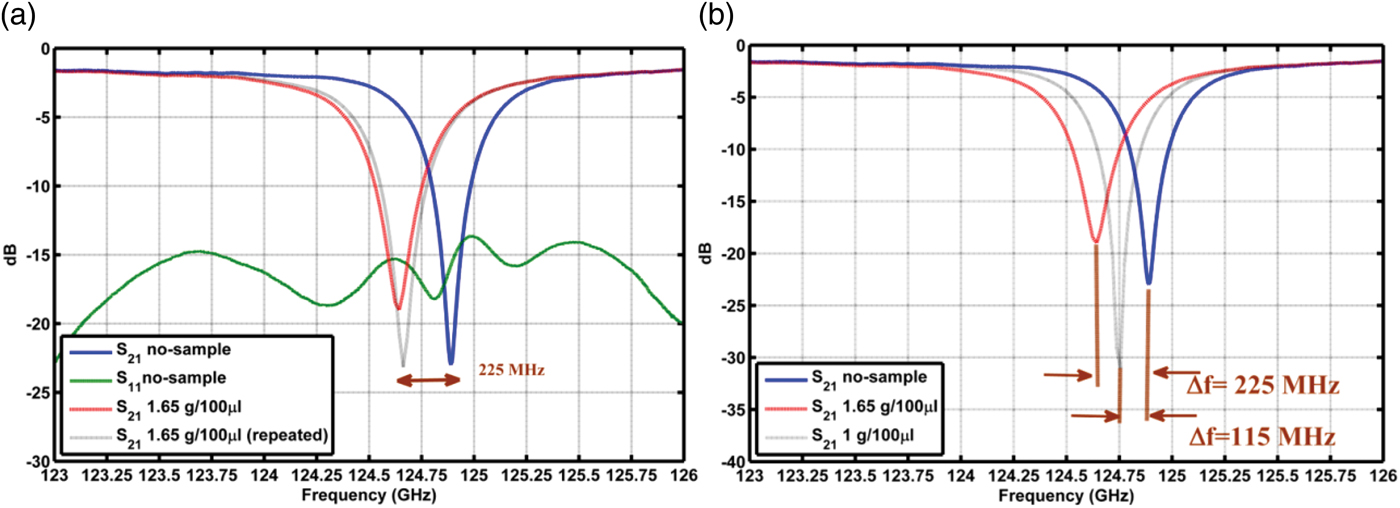
Determining the accurate amount of glucose in blood has been the subject of extensive research on sensing techniques [Reference Pickup, Hussain, Evans, Rolinsky and Birch20, Reference Feldman and Heller21]. Most of the existing approaches for glucose detection are based on electro-chemical methods. WGM-based sensing is an alternative promising technique, due to its high sensitivity, in comparison with other conventional methods. To test the proposed sensor, described in the previous section, two different concentrations of glucose in the water solution were prepared: 1 g/100 µl (60 mol/l) and 1.65 g/100 µl (99 mol/l) diluted glucose.
The glucose and water solution sample is chosen to investigate the functionality of the proposed bio-sensor device. Eventually, the obtained data will help us to optimize the system including the sensor and the measurement setup for our main goal, which is DNA sensing. In each trial, a constant volume of the solution (5 µl) is placed on top of the dielectric disc resonator, and the changes in the resonance frequency and Q-factor are recorded after the water evaporates. The repeatability of the measurement results is a key factor that should be examined carefully. Thus, for each concentration, the measurement is repeated several times. Undoubtedly, an accurate measurement is a consequence of a precise calibration. An intensive effort was made on the accurate calibration to reduce the transmission loss measurement error to less than 0.02 dB over the entire range of frequency. Additionally, the temperature was controlled at 23 ± 1°C. This small fluctuation in temperature does not have a significant effect on the resonance characteristics (less than ±3 MHz shift in the resonance frequency). It is because the temperature expansion of alumina is very low. For verification of the data, all the measurements were repeated a few times. Also, after removing each sample, the response of the sensor was verified to be the same as that in the initial state.
The sensor was tested for two different concentrations of the glucose solution, 1.65 g/100 µl and 1 g/100 µl. Figure 9(a) shows the measurement results for the concentration of 1.65 g/100 µl. As it is obvious from the graphs, 225 MHz shift in the resonance frequency is achieved. The effect of the thin layer of glucose can be considered as an equivalent surface impedance attached to the top surface of the DDR. For the second set of the samples, with the concentration of 1g/100 µl, the smaller resonance frequency shift is obtained. It is interesting to note that in this case, the resonance frequency shows higher Q-factor as compared with the no-sample case. The reason is that, the thin layer of sample increases the attenuation loss inside the DDR, and consequently the coupling state becomes closer to the condition of critical coupling. The results for all the cases are compared in Fig. 9(b).
(a) Measurement results of the 5 µl glucose solution samples with a concentration of 1.65 g/100 µl. (b) Comparison of resonance responses of the sensor loaded with two different glucose solution samples.
VII. CONCLUSION
A low-cost mm-wave bio-sensor based on the WGM resonance was proposed. The design and analysis methodology was explained. To improve the accuracy of the resonance calculation, an efficient variational method was applied. Three sets of sensor devices covering the frequency range of 85–220 GHz were designed and fabricated. As an experimental verification step, the fabricated device at D-band was tested to detect different quantities of glucose samples. Also, the system repeatability and selectivity were examined successfully.
ACKNOWLEDGEMENTS
This work has been supported by Natural Sciences and Engineering Research Council (NSERC) of Canada, Research in Motion (RIM), and the International Science and Technology Center (ISTC), A-1544 project.
 Aidin Taeb was born in Tehran, Iran in 1980. He received the B.Sc. degree from Tabriz University, Tabriz, Iran in 2003, and the M.Sc. degree in “field and wave” major from Amirkabir University of Technology (Tehran Polytechnique), Tehran, Iran in 2006. He is currently a Ph.D. candidate in the Department of Electrical and Computer Engineering in University of Waterloo, Waterloo, Canada. Also, he is a member of Center for Intelligent Antenna and Radio Systems (CIARS) group, University of Waterloo, Waterloo, Canada. His main interest lies in the area of terahertz and millimeter-wave components and structures design. Other areas in which he has worked are design of satellite antennas, THz bio-sensors, and on-chip RF circuits.
 Mohammad Neshat received his Ph.D. degree in electrical engineering from the University of Waterloo, Waterloo, ON, Canada in 2009. His doctoral dissertation was on development of resonance-based on-chip bio-sensors in terahertz and mm-wave range. He is currently a Postdoctoral Fellow with the Complex Materials Spectroscopy Group in Physics and Astronomy Department at the Johns Hopkins University, Baltimore, MD, USA. His current research is focused on modeling of integrated terahertz and mm-wave antennas and devices, and development of terahertz spectroscopy and ellipsometry systems for material characterization.
 Suren Gigoyan received his M.S. degree from Physics Department, Yerevan State University, Armenia, in 1980, and Ph.D. degree in electrical engineering from the Institute Electrical Engineering in Moscow, in 1991. In 2005–2006, he was a visiting Fulbright scholar at the University of Tennessee. He is currently a visitor scientist at the Microwave and Photonics Integrated System Lab University of Waterloo, Canada. His research interest is millimeter and THz spectroscopy, sensing, biological, and medical applications. He has published more than 50 peer-reviewed journal and conference papers. He is currently the head of the ISTC A-1544 project titled “THz spectrometer for detecting skin cancer”.
 Safieddin Safavi-Naeini (M'79) received the B.Sc. degree in E.E. from the University of Tehran, Tehran, Iran, 1974 and the M.Sc. and Ph.D. degrees in E.E. from the University of Illinois at Champaign-Urbana, in 1975 and 1979, respectively. He was a faculty member of the School of Engineering, University of Tehran, from 1980 to 1995. He joined the University of Waterloo, Waterloo, ON, Canada, in 1996, where he is now a Professor in the Department of Electrical and Computer Engineering, the holder of the RIM/NSERC Industrial Research Chair in Intelligent Radio/Antenna and Photonics, and is also the Director of a newly established Center for Intelligent Antenna and Radio System (CIARS).