Introduction
Quaternary paleoenvironmental conditions in southern Africa remain poorly resolved due to the spatially and temporally fragmented nature of available evidence. The reconstruction of longer-term paleoclimatic changes is, however, important because southern Africa is exposed to dynamics of both tropical and temperate climate regimes due to its latitudinal position (Carr et al. Reference Carr, Thomas, Meadows and Chase2006; Chase et al. Reference Chase, Boom, Carr, Meadows and Reimer2013). Southern Africa is influenced by a complex of tropical, subtropical and temperate climate systems arising from its geographical location and its position in relation to the Indian and Atlantic oceans. A deeper understanding of how climate and other features of the environment have varied during the Late Quaternary is significant for a number of reasons, including the fact that the region represents a key locality in the archaeology of behaviourally modern humans and that the elucidation of the longer-term dynamics of its various climate controls is important to developing more reliable climate models. Indeed, the volume and quality of research into reconstruction of paleoenvironmental conditions in the Quaternary of the region has increased markedly within the last decade in response to the recognition of its significance. Reconstructions are based on traditional proxies such as pollen (e.g. Quick et al. Reference Quick, Meadows, Bateman, Kirsten, Mäusbacher, Haberzettl and Chase2016), diatoms (e.g. Kirsten and Meadows Reference Kirsten and Meadows2012) and sedimentological parameters (e.g. Reinwarth et al. Reference Reinwarth, Franz, Baade, Haberzettl, Kasper, Daut, Helmschrot, Kirsten, Quick, Meadows and Mäusbacher2013) from wetland and lake sediments, as well as novel evidence, including a range of biological and chemical characteristics of rock hyrax middens (e.g. Chase et al. Reference Chase, Boom, Carr, Meadows and Reimer2013). Other investigations are underway, including those carried out recently within the RAiN project (Regional Archives for Integrated iNvestigations), which is a multidisciplinary and multi-institutional collaboration that aims to explore evidence from terrestrial and offshore sediments of changing climate and associated environmental conditions during the Late Quaternary in southern Africa (Haberzettl 2014). While these reconstructions have greatly improved understanding of environmental changes in the region during the Quaternary, the establishment of reliable chronologies, which are crucial for every paleoenvironmental reconstruction, remain a key challenge for sedimentary sequences (Wündsch et al. Reference Wündsch, Haberzettl, Meadows, Kirsten, Kasper, Baade, Daut, Stoner and Mäusbacher2016). Several studies that link terrestrial and marine records to reconstruct paleoclimates in the region have ensued, and therefore need to consider marine reservoir corrections (e.g. Wündsch et al. Reference Wündsch, Haberzettl, Meadows, Kirsten, Kasper, Baade, Daut, Stoner and Mäusbacher2016; Zhao et al. Reference Zhao, Dupont, Schefuss, Hahn, Meadows and Wefer2016).
Central to such studies is obtaining accurate age determination of the samples and, therefore, a reliable and robust chronology. This paper aims to approximate the marine reservoir effect for the southeast coastal region of South Africa as a step to better contextualizing results of the numerous Late Quaternary paleoenvironmental studies currently underway. ΔR is the regional marine reservoir offset from the global marine calibration curve and needs to be quantified in order to correct for the local conditions that affect diffusion of radiocarbon (14C) into the surface ocean (Stuiver et al. Reference Stuiver, Pearson and Braziunas1986). Reimer and Reimer (Reference Reimer and Reimer2001) remarked on the lack of reservoir correction data for most of Africa, and until now there have been very few such studies (Dewar et al. Reference Dewar, Reimer, Sealy and Woodborne2012; Southon et al. Reference Southon, Kashgarian, Fontugne, Metivier and Yim2002; Wündsch et al. Reference Wündsch, Haberzettl, Meadows, Kirsten, Kasper, Baade, Daut, Stoner and Mäusbacher2016). Dewar et al. (Reference Dewar, Reimer, Sealy and Woodborne2012) highlighted the need to conduct a regional reservoir correction study on the south coast of South Africa similar to the one they carried out for the west coast. The results reported here therefore respond to the need for additional ∆R estimates for the oceans around the African continent. The paper presents results of 14C dating of 15 known-age (pre-1950) shell samples in order to derive a marine reservoir correction value for coastal regions of South Africa, for which hitherto there has been an inadequate database to enable 14C age adjustment on sediments from coastal and marine sources. The samples yield results for two distinctive zones relating to the south and east coasts of South Africa and represent a sound data set on which to base ∆R values for a stretch of coastline extending over 1500 km between Richards Bay and Jeffrey’s Bay.
MARINE RESERVOIR EFFECT
The marine reservoir correction values differ spatially and temporally due to differences in ocean currents, upwelling and latitudinal atmospheric variation (Ascough et al. Reference Ascough, Cook and Dugmore2005; Reference Ascough, Cook, Church, Dugmore, Arge and McGovern2006). The difference between the local reservoir age (which is specific to a region and determined using known-age marine samples) and the modeled global marine reservoir age is known as the ∆R value (Stuiver et al. Reference Stuiver, Pearson and Braziunas1986, Reference Stuiver, Reimer and Braziunas1998; Stuiver and Braziunas Reference Stuiver and Braziunas1993; Southon et al. Reference Southon, Kashgarian, Fontugne, Metivier and Yim2002) and is calculated as follows:
 $$\Delta {\rm R}\left( {\rm t} \right){\equals}{\rm Rs}\left( {\rm t} \right)-{\rm Rg}\left( {\rm t} \right)$$
where:Rs(t) = regional reservoir age at a specific time period;Rg(t) = modeled 14C age of ocean surface water;∆R(t) = reservoir offset for a specific location at time t, usually determined using known-age marine samples.
The use of a marine reservoir correction value, ∆R, is fundamental to the construction of archaeological and paleoenvironmental chronologies in coastal or marine contexts. ∆R can be positive or negative for a specific location, and empirical studies of specific locations are required in order to determine the sign and the magnitude (Stuiver and Braziunas Reference Stuiver and Braziunas1993).
METHODOLOGY
There are three main methods used to determine ∆R values using marine samples, viz. using “paired” shell/terrestrial samples (Wündsch et al. Reference Wündsch, Haberzettl, Meadows, Kirsten, Kasper, Baade, Daut, Stoner and Mäusbacher2016), known-age marine samples and onshore/offshore tephra isochrons (Ascough et al. Reference Ascough, Cook and Dugmore2005). 14C dating of “paired” samples involves collecting charcoal/terrestrial and shell/marine samples from locations that are assumed to have adequate chronological integrity. The method employed in this paper bases ∆R calculations on the 14C dating of marine shells of known age which have been collected pre-AD 1950 shortly after death and, while there are some constraints indicated by this method (Ascough et al. Reference Ascough, Cook and Dugmore2005), the advantage of using known-age marine samples is that it does not require comparison between terrestrial samples and marine shells (as is the case with paired samples), therefore reducing additional uncertainties introduced through dealing with two different sets of 14C ages (Ulm Reference Ulm2002). Furthermore, there are no post-depositional issues or problems with bioturbation when using samples of known collection age (Ulm Reference Ulm2002). ∆R determination in this case relies, firstly, on the assumption that the date of original collection approximates the date of death of the organism and, secondly, on appropriately accurate museum curation and treatment prior to 14C dating.
Location of Sample Sites
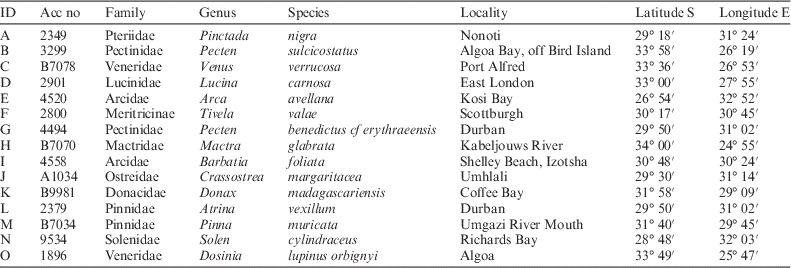
Only the west coast region of South Africa had been adequately studied in terms of marine reservoir corrections (Dewar et al. Reference Dewar, Reimer, Sealy and Woodborne2012). The choice of the southeast coastal region as a focus for this study was driven by the need to obtain accurate ∆R values due to the range of ongoing Quaternary paleoenvironmental studies in southern Africa that are reliant on 14C dating for chronology, more especially in relation to the ongoing RAiN project (Haberzettl et al. Reference Haberzettl, Baade, Compton, Daut, Dupont, Finch, Frenzel, Green, Hahn, Hebbeln, Helmschrot, Humphries, Kasper, Kirsten, Mäusbacher, Meadows, Meschner, Quick, Schefuß, Wündsch and Zabel2014). The general absence of limestone bedrock along the southeast coast is considered an advantage in this study as this reduces the likelihood of systematic error in the results through the incorporation of 14C-depleted material into the food chain. Carboniferous bedrocks have been shown to adjust the apparent 14C age of the Hawaiian coast by up to +620 yr (Dye Reference Dye1994). Therefore, non-filter feeding bivalves collected from areas where there is underlying limestone geology should be treated with caution (Reimer and Reimer Reference Reimer and Reimer2001). The search for a wide selection of bivalve material collected before AD 1950 led the authors to collections curated at the Natal Museum in Pietermaritzburg, South Africa, where there exists a substantial number of marine bivalve samples that meet the necessary criteria for the south and east coasts of South Africa (Table 1). Samples for 14C dating were chosen in order to produce a relatively even spatial distribution along the coast based on their original collection localities (Figure 1).
Locations of sample points used in this study (A–O). “Acc no” is the Museum reference for the sample.

Species Selection
Marine mollusks offer the most appropriate material in providing the required estimate of ∆R because of their sedentary habits (Ascough et al. Reference Ascough, Cook and Dugmore2005). The challenge with migratory species is that they may represent carbon influences of several locations with different background 14C content (Ascough et al. Reference Ascough, Cook and Dugmore2005). Hence, only, marine filter-feeding bivalves were selected as the most suitable object for this research as they are not migratory. The two pre-bomb samples from Wündsch et al. (2016) are gastropods (Ocenebra fenestrate from Mossel Bay is a carnivore and Drillia caffra from Jefferys Bay is a deposit feeder) but we have included them as they are in agreement with our filter-feeding samples. For the two samples from Southon et al. (Reference Southon, Kashgarian, Fontugne, Metivier and Yim2002), the Cape of Good Hope sample is a filter-feeding bivalve Venerupis corrugate but the feeding habitat of the bivalve Marcia paupercula from Natal is not known.
Harkness (Reference Harkness1983) stated that a requirement for known age samples from museums is live collection, as well as thorough and accurate recording of locality and date of collection and storage. The Natal Museum, which is the source of samples used in this study, has robust standards of curation and record-keeping. Yoneda et al. (2000) highlight the importance of collecting material where there is evidence that the organism was collected live. For this study, only one sample (#9534) contained unequivocal evidence of live collection, as the body tissues were preserved within the shell. Live collection can also reasonably be inferred from articulated bivalves and attachment of the resilium (Berkman and Forman Reference Berkman and Forman1996), which was the case for sample #9534. The other samples are assumed to have been collected a short time after death as the condition of the shells in question suggested that this was the case. All of the bivalves were unweathered and had both shells still in place, or available in the collection; this typically indicates collection at or shortly after death (Reimer and McCormac Reference Reimer and McCormac2002). Filter-feeding bivalve samples were collected for this research using only species that are known to reside predominantly in marine environments. Additional samples meeting the necessary criteria were not selected either because (a) they represented the last remaining sample in the collection, (b) it was the original sample used to describe/define the species type, or (c) they were too small to be subsampled for 14C dating. All samples had been collected in the pre-bomb era, dating from 1905 to 1939, as documented in the museum record.
Sample Preparation
Following sample selection from the Natal Museum Archives, the samples were mechanically prepared using a Dremel® micro-drilling tool. For all samples, preliminary external brushing was conducted to remove any visible surficial debris. Following this, a section of roughly 0.5 × 0.5 cm of the outermost 2–3 growth increments was excavated from each sample and stored for shipping. Sample preparation and 14C dating took place at the 14CHRONO Centre in the Queen’s University Belfast. The shell samples were washed in deionized water in an ultrasonic bath then air-dried and approximately 12 mg of shell was placed in a septum-sealed vial (Vacutainer). The samples were then etched with a quantity of 0.18 mL of 1% HCl for a 12 mg shell sample to remove approximately 25% of the initial weight and then rinsed again with deionized water. Following the method of Santos et al. (Reference Santos, Southon, Druffel-Rodriguez, Griffin and Mazon2004), the vials were sealed, evacuated and then injected with 85% phosphoric acid (H3PO4) and placed on a heating block at 60°C for 30 min to evolve carbon dioxide, which was cryogenically purified and transferred on the graphite line to a culture tube containing pre-baked iron. Following the method of Vogel et al. (Reference Vogel, Southon, Nelson and Brown1984), hydrogen gas was added and the tube was heated to 560°C for four hours. The graphite was then pressed in aluminium holders and analyzed on a 0.5 MV National Electrostatics Corporation Compact Accelerator Mass Spectrometer (AMS). The sample 14C/12C ratio was background corrected and normalised to the HOXII standard (SRM 4990C; National Institute of Standards and Technology). The 14C/12C ratio was corrected for isotopic fractionation using the AMS-measured δ13C, which includes natural and machine fractionation (and therefore is not included in the text). The 14C age and one standard deviation were calculated using the Libby half-life (5568 yr) following the conventions of Stuiver and Polach (Reference Stuiver and Polach1977).
RESULTS AND DISCUSSION
The ∆R values were calculated using the marine calibration curve (Marine13, Reimer et al. Reference Reimer, Bard and Bayliss2013) and computed on the basis of the following equation:
 $$\Delta {\rm R}{\equals}{\rm shell}\,{\rm sample}^{{14}} {\rm C}\,{\rm age}-{\rm Marine}13\,{\rm curve}\,{\rm age}$$
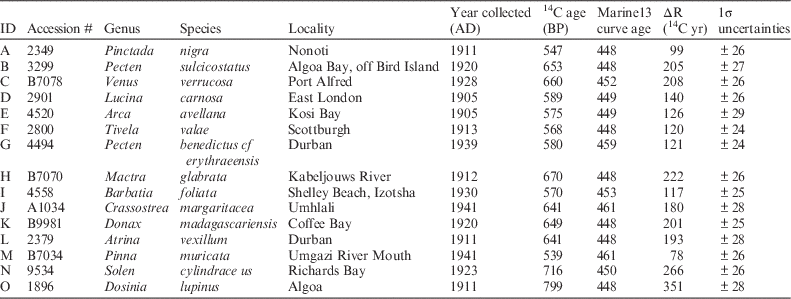
The uncertainty in ∆R is taken as the standard error in the 14C age of the sample without including the calibration uncertainty that is taken into account by the calibration programs (Table 2).
ΔR values as calculated for samples A–O.

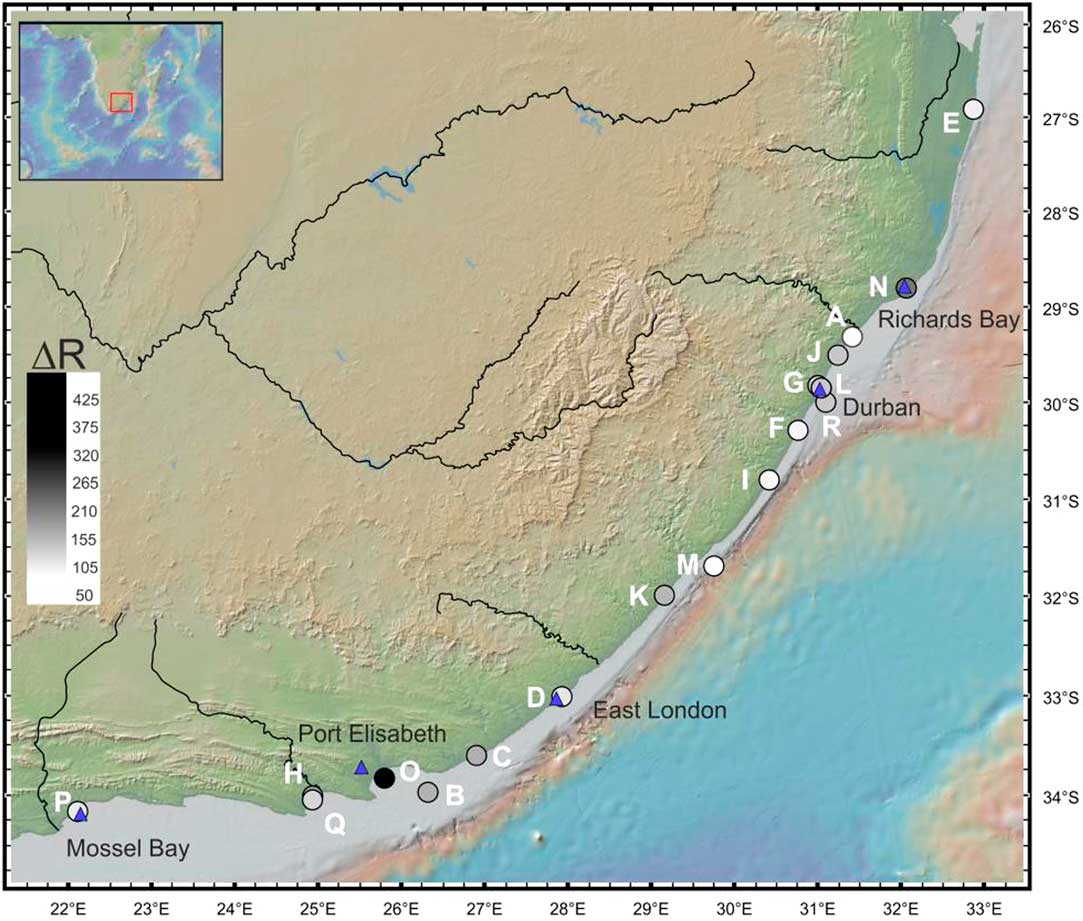
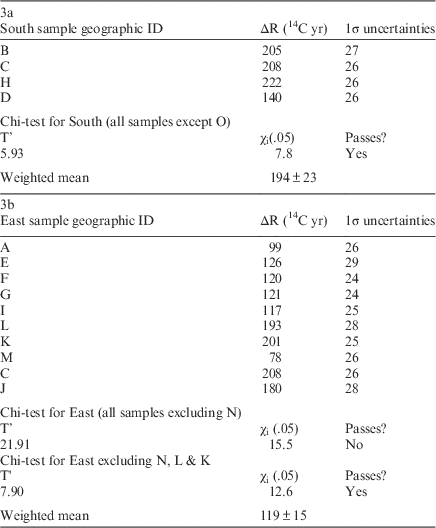
Considering all samples from this study (Table 2), the ∆R data span a range from 78±26 to 351±28 14C yr; however, the ∆R values do not pass a chi-squared test (T’ =105.0, χi 2(0.05)=26.3). Overall, ∆R values in the south of East London are larger than those in the east. We therefore split the data into two sub-groups: South and East, split at East London, between Sample C and Sample D (Figure 1). According to Reimer and Reimer (Reference Reimer and Reimer2001), samples with ∆R values that are very markedly greater than the mean should be excluded from any regional mean calculation because they may not have been collected within a sufficiently short time following death. Sample O (∆R=351±28), collected from Algoa Bay, has a ∆R value almost 100 yr greater than many of the others (Table 2) and so exclusion was deemed appropriate. Exclusion of outlier sample O from the south coast dataset results in a pass on the chi-squared test and produces a weighted mean ∆R value of 194±23 (Table 3a) where the uncertainty is given as the standard error for predicated values (Russell et al. Reference Russell, Cook, Ascough, Barrett and Dugmore2011). A similar exercise for the east coast samples identifies sample N (266±28) as an outlier as well as samples K and L (Table 3b); their exclusion lowers the weighted mean ∆R of the east coast samples to 119±15.
Locations of known-age marine shell samples A–O used in the analysis. Localities used in Wündsch et al. (Reference Wündsch, Haberzettl, Meadows, Kirsten, Kasper, Baade, Daut, Stoner and Mäusbacher2016) are labeled P and Q, the Natal location for Southon et al. (Reference Southon, Kashgarian, Fontugne, Metivier and Yim2002) is labeled R, while Cape of Good Hope sample is off the map, located about 300 km west of Mossel Bay. Color scheme shading from white to black correlates with increasing ΔR values. Descriptions for samples (A–O) can be found in Table 1. (Map: Ryan et al. Reference Ryan, Carbotte, Coplan, O’Hara, Melkonian, Arko, Weissel, Ferrini, Goodwillie, Nitsche, Bonczkowski and Zemsky2009.)

Geographical distribution of two populations of ΔR values from this study for the south and east coastal regions and correlating chi-tests with weighted means giving the uncertainty as the standard error of predicated values.

To test whether the ∆R values of the south coast are larger than the east coast, we used a one-tailed t-test assuming unequal variances with a null hypothesis that they are the same. The hypothesis was disproved at 95% confidence limits with probability=0.0135 and only slightly less significant (p=0.140) assuming equal variances. Using two-tailed t-tests, which imply the difference between the ∆R values of two coasts could be in either direction, results in p=0.0269 and p=0.0281 for unequal and equal variances, respectively. Therefore, according to the results outlined, ∆R values from the south and east coastal regions represent statistically significant sub-sets when evaluated with a t-test.
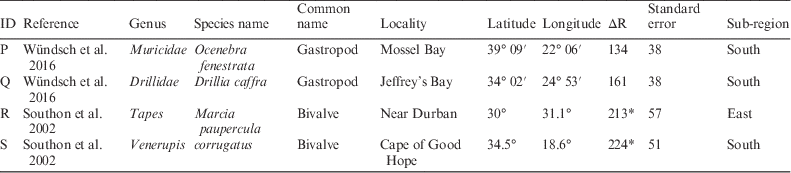
Prior to this study, only three ∆R studies have been reported across the entire coastline of South Africa (Southon et al. Reference Southon, Kashgarian, Fontugne, Metivier and Yim2002; Dewar et al. Reference Dewar, Reimer, Sealy and Woodborne2012; Wündsch et al. 2016) (Table 4), with the study by Dewar et al. (Reference Dewar, Reimer, Sealy and Woodborne2012) confined to the west coast. The ∆R value determined for the east coast by Southon et al. (Reference Southon, Kashgarian, Fontugne, Metivier and Yim2002) was based on a marine shell collected in Kwa-Zulu Natal that yielded a ∆R value of 213±57 (recalculated with Marine13) (Sample R) which accords within the uncertainty with the ∆R values presented here for this eastern part of the South African coast. A pooled mean ∆R for the east coast, inclusive of Sample R (Southon et al. Reference Southon, Kashgarian, Fontugne, Metivier and Yim2002) and ∆R values from this study is 121±16. For the south coast, Southon et al. (Reference Southon, Kashgarian, Fontugne, Metivier and Yim2002) documented a ∆R value of 224±51 (recalculated with Marine13) from a bivalve that was collected in AD 1820 from the Cape of Good Hope area, while Wündsch et al. (Reference Wündsch, Haberzettl, Meadows, Kirsten, Kasper, Baade, Daut, Stoner and Mäusbacher2016) recorded ∆R values of 134±38 (Sample P) and 161±38 (Sample Q). If these previous values (Table 4) are analyzed along with our south coast samples they are statistically the same (T’=9.12,χi 2=12.6). We therefore include these previous measurements in our weighted mean for the south coast. The resultant mean ∆R for the south coast, inclusive of Sample P, Q and S is 187±18.
ΔR values from prior studies in the region.

* Recalculated with Marine13.
Both the east and south coast weighted mean ΔR values are larger than the global ocean average (0 14C yr by definition). However, our results indicate higher ∆R values to the south, which suggests that waters with lower 14C content compared to the northern region are found here. Immediately south of East London the continental shelf widens. As the continental shelf widens, the Agulhas Current, which flows southwestward along the shelf break, is forced away from the coast inducing divergence and cyclonic circulation inshore of the Agulhas Currents resulting in upwelling (Gill and Schumann Reference Gill and Schumann1979). Applying the theory from Gill and Schumann (Reference Gill and Schumann1979), Lutjeharms et al. (Reference Lutjeharms, Cooper and Roberts2000a) explain the presence of a semi-permanent upwelling cell (surface water cooler than 17°C) inshore of the Agulhas Current, off Port Alfred (33.5°S). Additionally, along the south coast, wind-driven upwelling combined with divergent flow driven by the Agulhas Current bring colder water onto the Agulhas Bank (Lutjeharms et al. Reference Lutjeharms, Cooper and Roberts2000a). The colder upwelled water masses are sourced from 14C depleted South West Indian Central waters from depths of >500 m, which have been found to mix with surface waters (Stuiver and Ostlund Reference Stuiver and Ostlund1983; Lutjeharms et al. Reference Lutjeharms, Cooper and Roberts2000a). North of East London, the shelf is consistently narrow, and the northern Agulhas Current follows a stable trajectory, meandering less than 15 km from its mean path (Gründlingh Reference Gründlingh1983). The narrow continental shelf and stable trajectory of the Agulhas Current inhibits the possibility for persistent upwelling of 14C depleted waters, which may explain the lower ∆R to the north.
In addition to providing insight into why there are two ∆R populations, the regional oceanography may also explain why Sample N, near Richards Bay, has an older 14C age than the other samples in the region. Lutjeharms et al. (Reference Lutjeharms and Connell1989) describe a persistent topographically induced upwelling cell off Richards Bay due to a widening of the continental shelf, similar to the upwelling dynamics occurring near Port Alfred. However, contrary to Port Alfred whose upwelling waters are derived from the upper to middle layers of the South Indian Central Water (Lutjeharms et al. Reference Lutjeharms, Cooper and Roberts2000a), there is no conclusive evidence of substantial amounts of deeper South Indian Ocean Central Waters being upwelled onto the shelf of the Natal Bight (Lutjeharms et al. Reference Lutjeharms, Valentine and van Ballegooyen2000b), rather the circulation over most of the southern parts of the Natal Bight appear to be derived from Agulhas Current waters periodically encroaching onto the Bight, reaching as far as Durban, possibly explaining the outlier associated with Sample L.
CONCLUSIONS
Marine reservoir correction values for the south and east coastal regions of South Africa have hitherto been based on a very small sample size. This paper reports that the south coast has higher ∆R values than the east coast, and supplements those of Dewar et al. (Reference Dewar, Reimer, Sealy and Woodborne2012) for the west coast. Further studies on the hydrography of the south and east coasts may help to cast further light on this finding, and increase both the volume and quality of reservoir correction data for the region. The determined ∆R values for the south and east coasts of South Africa indicate two distinctive geographical sub-regions. The east coast has a mean ∆R of 121±16 yr, while the south coast has a mean ∆R of 187±18 yr. Both these ∆R values are important for ongoing and future Late Quaternary paleoenvironmental studies on marine sediments, or marine-influenced sediments from the region.
Acknowledgments
This study was funded by the German Federal Ministry of Education and Research (BMBF). The investigations were conducted within the collaborative project “Regional Archives for Integrated iNnvestigations” (RAIN), which is embedded in the international research program: SPACES (Science Partnership for the Assessment of Complex Earth System Processes). We would also like to acknowledge the Palaeontological Scientific Trust (PAST), Dr. Dai Herbert from the Natal Museum, as well as the National Research Foundation (NRF) for their support in this research. We thank the anonymous reviewers for their constructive comments.