Introduction
The freshwater faucet snail (Bithynia tentaculata) is native to Europe and was first discovered in the Great Lakes region and parts of the eastern USA in the late 1800s (Beauchamp, Reference Beauchamp1880; Walker, Reference Walker1893; Baker, Reference Baker1898). The snail has since spread into the Upper Mississippi River Region (UMRR), Minnesota (Roy, Reference Roy2014) and Montana (Henningsen et al., Reference Henningsen, Lance, Jones, Hagen, Laurila, Cole and Perez2010). The faucet snail acts as first and second intermediate hosts for several parasitic digenean trematode species, including Sphaeridiotrema globulus and Sphaeridiotrema pseudoglobulus (McLaughlin et al., Reference McLaughlin, Scott and Huffman1993; Sandland et al., Reference Sandland, Houk, Walker, Haro and Gillis2013). In the UMRR, the trematodes infecting faucet snails have been implicated in causing mortality in large numbers of migrating waterfowl (Sauer et al., Reference Sauer, Cole and Nissen2007). More than 182 000 migratory molluscivorous birds have died in the UMRR since 1996 (USGS, NWHC, Wildlife Health Information Sharing Partnership Event Reporting System 2017; R. Cole personal communication) likely as a consequence of ulcerative haemorrhagic enteritis associated with infection by these trematode species (Huffman et al., Reference Huffman, Fried, Roscoe and Cali1984; Huffman and Roscoe, Reference Huffman and Roscoe1989; Sauer et al., Reference Sauer, Cole and Nissen2007; Herrmann and Sorensen, Reference Herrmann and Sorensen2011). The birds die after consuming a lethal dose of infected snails, which can be consumed in as little as 24 h (Hoeve and Scott, Reference Hoeve and Scott1988; Sauer et al., Reference Sauer, Cole and Nissen2007; Herrmann and Sorensen, Reference Herrmann and Sorensen2009). At present, 15 species of waterfowl have been recovered with evidence of fatal infections by these trematodes (Sauer et al., Reference Sauer, Cole and Nissen2007). The importance of the UMRR as a major migratory flyway for waterfowl has raised concerns over the continued transmission of these parasites and outlines a clear need to better understand the basic ecology of the system.
Host susceptibility plays a major role in determining the infection success and transmission patterns of parasites (Krist and Lively, Reference Krist and Lively1998; Schmid-Hempel, Reference Schmid-Hempel2011; Goedknegt et al., Reference Goedknegt, Feis, Wegner, Luttikhuizen, Buschbaum, Camphuysen, van der Meer and Thieltges2016). Among digenetic trematodes, there is oftentimes a positive correlation between snail size/age and infection prevalence and intensity with smaller snails harbouring few to no parasites (Menard and Scott, Reference Menard and Scott1987; Lepitzki, Reference Lepitzki1993; Sorensen and Minchella, Reference Sorensen and Minchella2001; Graham, Reference Graham2003; Roy and St-Louis, Reference Roy and St-Louis2017). Consistent with this trend, Herrmann and Sorensen (Reference Herrmann and Sorensen2009) investigated the occurrence of S. globulus metacercariae in newly hatched faucet snails from the UMRR and found infections to be either low or non-existent across sites. Here, we test a number of factors that may help to explain this pattern, including that very small, young snails (1) are refractory to infection by cercariae, (2) die quickly from cercarial infection and are removed from sampled populations, and/or (3) are not preferred by the cercariae. It is important to note that the mechanisms listed here are not mutually exclusive and do not represent an exhaustive list of all of the factors potentially dictating patterns of metacercarial infection. For example, small snails may experience a shorter exposure period which could lead to fewer infections.
Here, we aim to better understand the host and/or parasite mechanisms underlying patterns of trematode infection in faucet snails serving as second-intermediate hosts. We have focused on metacercarial infections given the importance of this stage in the transmission of these parasites to waterfowl. First, we collected faucet snails ranging in size from 1 to 10 mm from the UMRR and quantified Sphaeridiotrema spp. metacercariae prevalence, abundance and intensity to further document natural infection patterns. Prevalence is defined as the proportion of infected individuals relative to the total number of individuals sampled. Mean abundance and intensity are defined as the number of metacercariae per sampled snail (abundance) or per infected snail (intensity) (Rozsa et al., Reference Rozsa, Reiczigel and Majoros2000). Subsequently, we performed a series of laboratory experiments to test potential mechanisms explaining observed infection patterns from the field. To examine whether very small snails are refractory to infection, we experimentally exposed laboratory-reared (uninfected) faucet snails ranging in size from 1 mm (newly hatched snails) to 9 mm (adult snails) to S. pseudoglobulus cercariae. We then monitored infection prevalence, abundance and intensity as well as subsequent host mortality. Finally, we performed experiments to explore the possibility that S. pseudoglobulus cercariae are more likely to attach to certain sizes of snails (i.e. smaller vs larger individuals).
Materials and methods
Study system
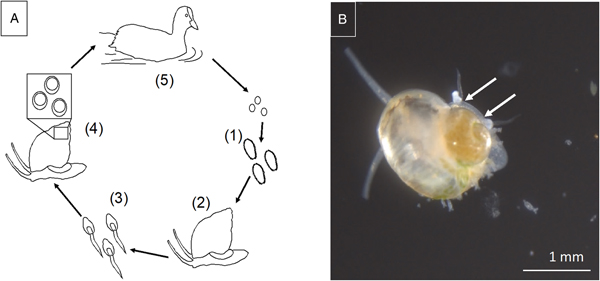
Sphaeridiotrema spp. exhibit complex life cycles involving multiple hosts. Sphaeridiotrema globulus and S. pseudoglobulus are distinguished by egg size, egg hatching time and adult morphology (McLaughlin et al., Reference McLaughlin, Scott and Huffman1993; McKindsey and McLaughlin, Reference McKindsey and McLaughlin1994). Eggs hatch in freshwater environments and release free-swimming larval miracidia that infect first-intermediate host snails, including B. tentaculata (Fig. 1). Inside the snail, miracidia eventually develop into rediae, which, in turn, asexually produce numerous cercariae. After a number of weeks, free-swimming cercariae are shed from infected snails into the water, where they penetrate second-intermediate snail hosts (including B. tentaculata) and encyst as metacercariae. Sphaeridiotrema spp. encyst in the spire of the shell (Lepitzki and Bunn, Reference Lepitzki and Bunn1994) or between the shell and visceral mass (Huffman, Reference Huffman1986).
(A) Schematic representation of digenetic trematode life cycle: (1) eggs shed in bird feces hatch as free-swimming miracidia and are ingested by first intermediate snail hosts, (2) miracidia mature into rediae or sporocysts within snail hosts, (3) free-swimming cercariae are released and penetrate second intermediate snail hosts, (4) cercariae encyst and mature as metacercariae in snail hosts, (5) snail hosts are consumed by waterfowl, where metacercariae mature to become adult reproductive flukes in the bird intestine. (B) Sphaeridiotrema pseudoglobulus cercariae penetrating faucet snail during experimental exposure trial. Sites of penetration marked with arrows. Photo credit: JAHK.
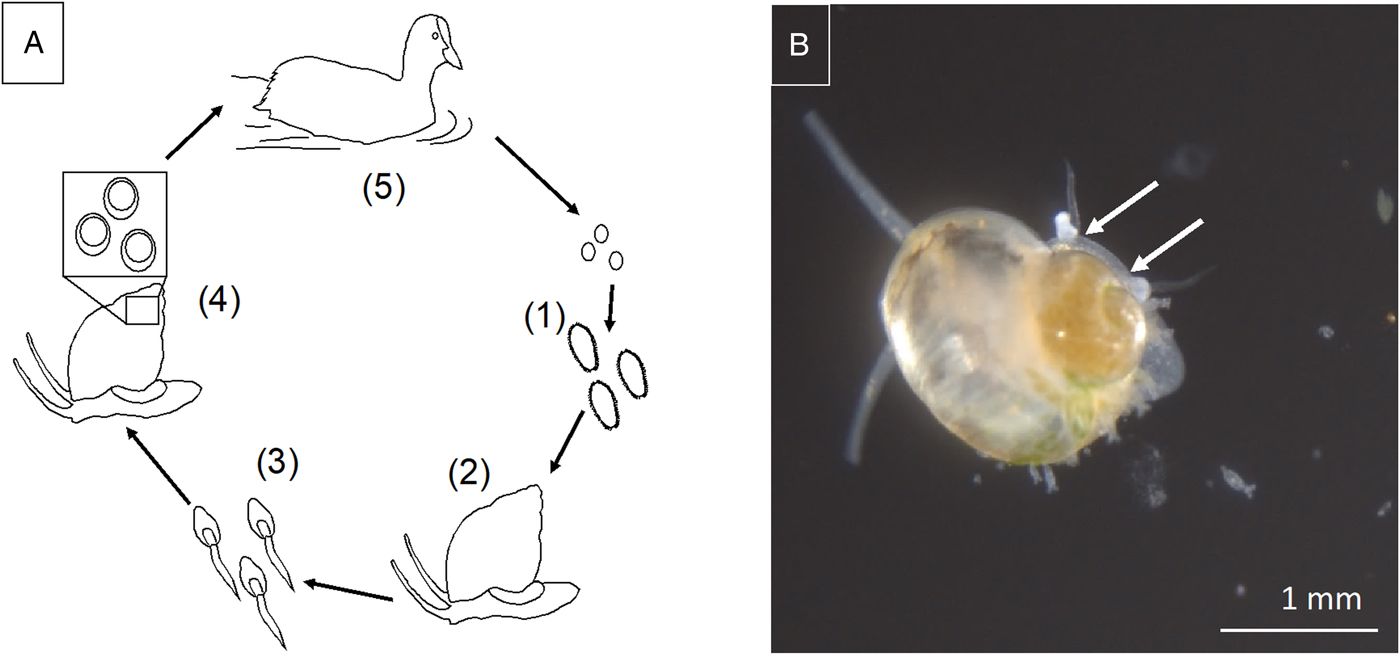
After migrating waterfowl consume infected snails congregating on submersed substrates and vegetation, metacercariae excyst in the avian gut and, within days, develop into adult, sexually reproducing flukes (Huffman et al., Reference Huffman, Fried, Roscoe and Cali1984). Parasite eggs are then released with the feces of the bird back into the water (Khan, Reference Khan1962; Hoeve and Scott, Reference Hoeve and Scott1988; McKindsey and McLaughlin, Reference McKindsey and McLaughlin1994). Adult flukes can cause haemorrhagic ulcerative enteritis, ultimately resulting in waterfowl death. Lethal doses of trematodes can be obtained in <24 h when waterfowl consume infected snails (Hoeve and Scott, Reference Hoeve and Scott1988; Sauer et al., Reference Sauer, Cole and Nissen2007; Herrmann and Sorensen, Reference Herrmann and Sorensen2009). Sphaeridiotrema spp. have caused mortality of Mute swans (Cygnus olor) with infection intensity as low as six flukes, though the average lethal dose is likely closer to 100 parasites (Huffman and Roscoe, Reference Huffman and Roscoe1989). Susceptibility varies among waterfowl hosts by species, age and prior consumption of non-lethal doses of metacercariae (Hoeve and Scott, Reference Hoeve and Scott1988; Huffman and Roscoe, Reference Huffman and Roscoe1989).
Natural infections
Observations of natural metacercarial Sphaeridiotrema spp. prevalence, abundance and intensity, relative to faucet snail size, were made following collections of wild-caught snails from a rocky breakwater in Pool 8, UMRR between July and August in 2012 (MR and GJS) and 2017 (RZB and JAHK) (43°40′40″ N, −91°13′26″ W). Live snails were acquired from rocks 0–1 m below the surface of the water and collections took place within a 20 × 2 m area. Live snails (n = 308) were brought back to the laboratory either at the University of Wisconsin La Crosse or the University of Massachusetts Dartmouth. Snails were measured from the tip of the spire to the base of the aperture with digital calipers (accuracy 0.1 mm). Each snail was then crushed in a petri dish using a metal spatula and the soft tissues and shell were carefully examined under a dissecting microscope at 30× magnification to determine the presence/absence and number of metacercariae. Sphaeridiotrema spp. metacercariae were found most commonly in the spire of the shell or between the shell and visceral mass (Huffman, Reference Huffman1986; Lepitzki and Bunn, Reference Lepitzki and Bunn1994). All portions of the shell and snail body were examined for metacercariae.
Statistical analyses of abundance and intensity were initially conducted using generalized linear models (GLM). However, normal, Poisson, quasi-Poisson and negative binomial distributions all failed to satisfy one or more assumptions of GLM. Accordingly, we employed a non-parametric procedure, Kendall's rank correlation coefficient (Kendall's τ), to test for positive correlation between size and abundance/intensity. Likewise, a binomial logistic regression on infection prevalence showed poor fit to the second and third quintiles of snail size and was therefore replaced with Kendall's τ to test for a positive correlation between size and prevalence.
Experimental infections
In May 2016, snails were collected from Pool 8 of the UMRR and shipped to the University of Massachusetts Dartmouth. Snails were separated into 266 mL plastic cups, filled with natural well water, at a density of ~10 snails per cup. They were fed a diet of bacto-agar mixed with dried lettuce, ad libitum, and water was changed weekly. All water used for the following experiments was natural well water collected from Dartmouth, MA, USA. Snails were kept in environmentally controlled chambers at 22 °C with a 12 h light/dark cycle (0700–1900). As snails laid eggs (June–September), adults were relocated to new plastic cups, separating the generations. Egg cups underwent complete water changes several times over the next few days to remove any potential remaining cercariae shed by adults. Faucet snail eggs from the UMRR take approximately 2–3 weeks to hatch, while typical trematode cercariae do not survive longer than 24–48 h outside a host (McCarthy, Reference McCarthy1998; Toledo et al., Reference Toledo, Munoz-Antoli and Esteban1999). Thus, this method effectively prevented vertical transmission of trematode parasites, creating naïve uninfected snails for experimentation (see below). Eggs were maintained until hatching in well water, which was changed once weekly. Following hatching, snails were reared as described previously.
In December 2016, S. pseudoglobulus eggs were extracted from adult flukes found in the digestive tract of a recently deceased Lesser scaup (Aythya affinis), collected from Pool 7 of the UMRR, following the methods detailed in Sandland et al. (Reference Sandland, Houk, Walker, Haro and Gillis2013). Eggs were stored in well water in a plastic petri dish, wrapped in aluminium foil (to prevent light-stimulated hatching), and kept at room temperature until they were shipped overnight to the University of Massachusetts Dartmouth. Eggs were hatched in a petri dish placed under an incandescent lamp (Sandland et al., Reference Sandland, Houk, Walker, Haro and Gillis2013). Five hatched miracidia were then transferred into each well of a six-well cell culture plate containing ~10 mL of water. A single wild-caught adult snail from Pool 8 UMRR was placed into each well (n = 7 snails total), where they remained for 24 h before being transferred to individual plastic cups. Approximately 10 weeks later, the seven successfully infected snails were placed under an incandescent light to quantify the presence/quantity of shed cercariae. Cercariae from each of these snails were used in the experiments outlined below.
Size susceptibility experiment
Shed cercariae were collected using a pipettor and placed into a 24-well cell culture plate with ~4 mL of water/well (n = 15 cercariae per well). Laboratory-reared uninfected snails were haphazardly selected (n = 128), measured from the tip of the spire to the base of the aperture (accuracy 0.1 mm), and placed individually into wells containing cercariae. Snail size ranged from 1.0 to 8.8 mm; snails typically reach maturity between 6.0 and 8.0 mm, depending on environmental conditions (Richter, Reference Richter2001). Snails were exposed to cercariae for 24 h, after which each snail was moved into its own plastic cup and fed bacto-agar mixed with dried lettuce, ad libitum. Snails were checked twice weekly for mortality and any dead snails were immediately necropsied to determine metacercarial prevalence, abundance and intensity. Nine weeks post-exposure, all surviving snails were euthanized and examined to quantify metacercariae metrics.
For experimental infections, statistical analyses of abundance and intensity were conducted using GLM. A binomial logistic regression on infection status showed good fit across all quintiles of snail size and therefore was used to test for a correlation between host size and prevalence. A Mantel–Cox procedure was used to assess survival differences in different size classes of experimentally infected snails. Only snails with confirmed metacercarial infections were included in survival analyses.
Host size and parasite attachment
A series of exploratory trials were conducted to determine if S. pseudoglobulus cercariae were more likely to attach to snails that differed in relative size. For each trial, two laboratory-reared (uninfected) snails of differing sizes were selected and measured. Small snails ranged in size from 1.0 to 6.25 mm and large snails ranged in size from 2.0 to 7.75 mm. If size differences between individuals fell between 1.0 and 4.0 mm, the pair was placed together into a single plastic well containing ~4 mL of well water. After each snail acclimated to the well and extended its head–foot (usually <5 min but no more than 10 min), multiple cercariae (n = 2–4) were simultaneously transferred to the well via a pipettor. Cercariae and snails were then observed under a dissection microscope at 10× magnification to identify the first snail to which a cercaria permanently attached (Fig. 1B). Cercariae would attach using oral sucker and acetabulum. A single observer (RZB) performed all host size × cercaria attachment trials (n = 20 trials). Trials concluded when either (1) a single cercaria successfully attached to a snail, (2) one of the snails closed its operculum prior to parasite attachment, or (3) no parasite attachment occurred within a 10 min window. Trials were limited to a total of 10 min in order to reduce the effects of the microscope light source on water temperatures within each well. Snails were categorized as ‘small’ and ‘large’ based on their relative sizes in each trial. We used a one-sample binomial test to assess likelihood of attachment based on snail size. Under the null hypothesis, we would expect that attachment should occur at equal frequency between small and large snails.
Results
Natural infections
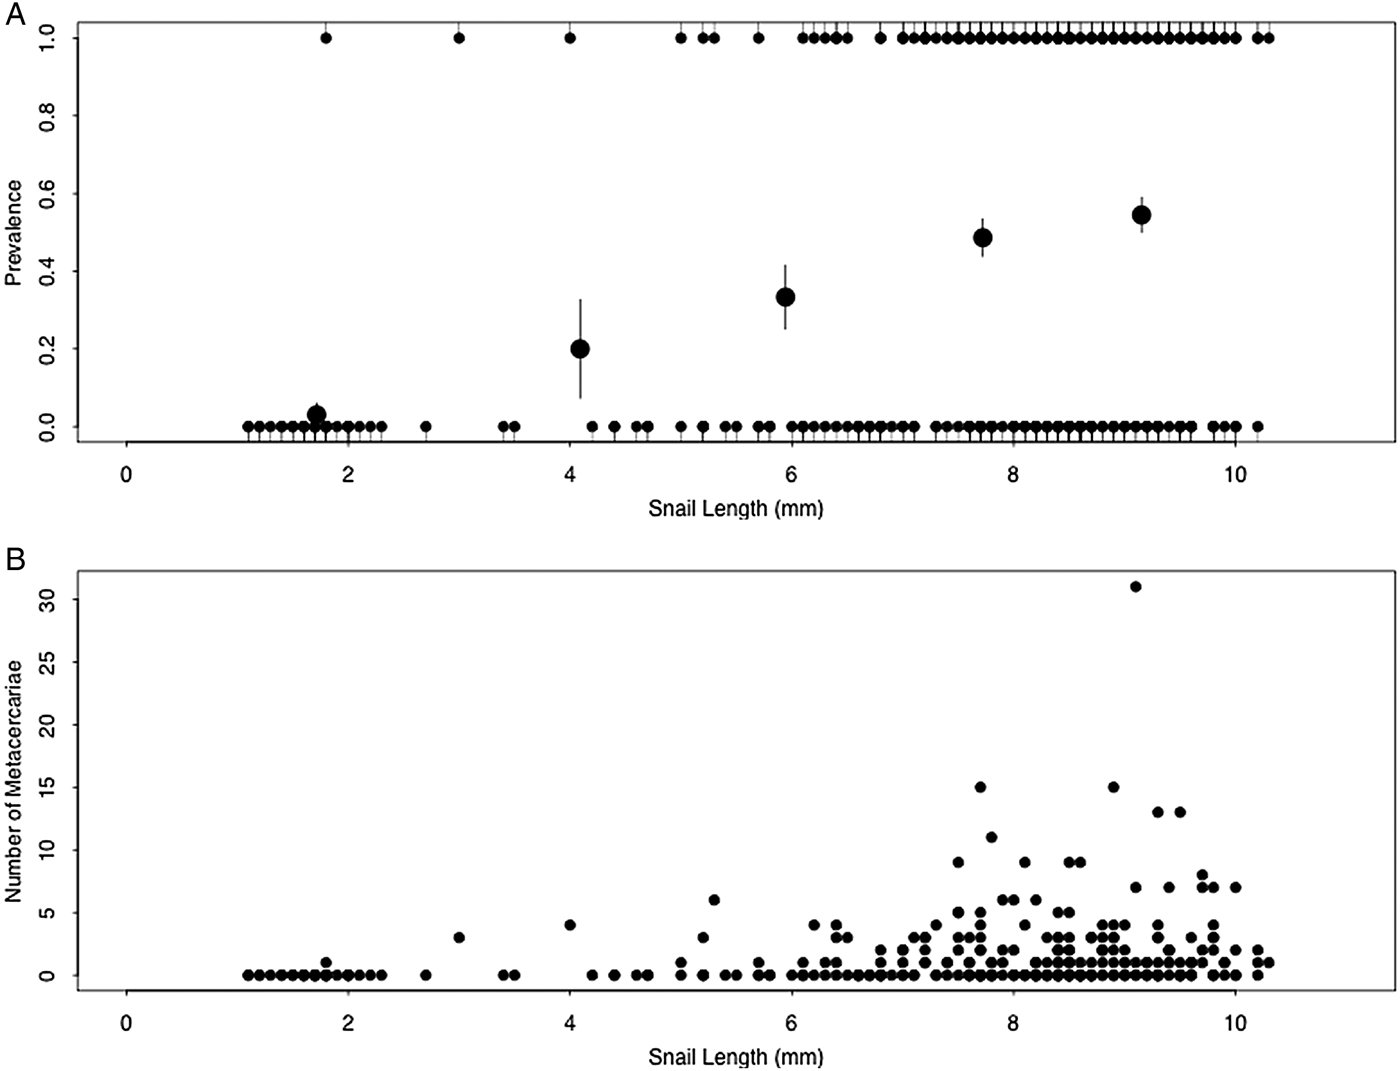
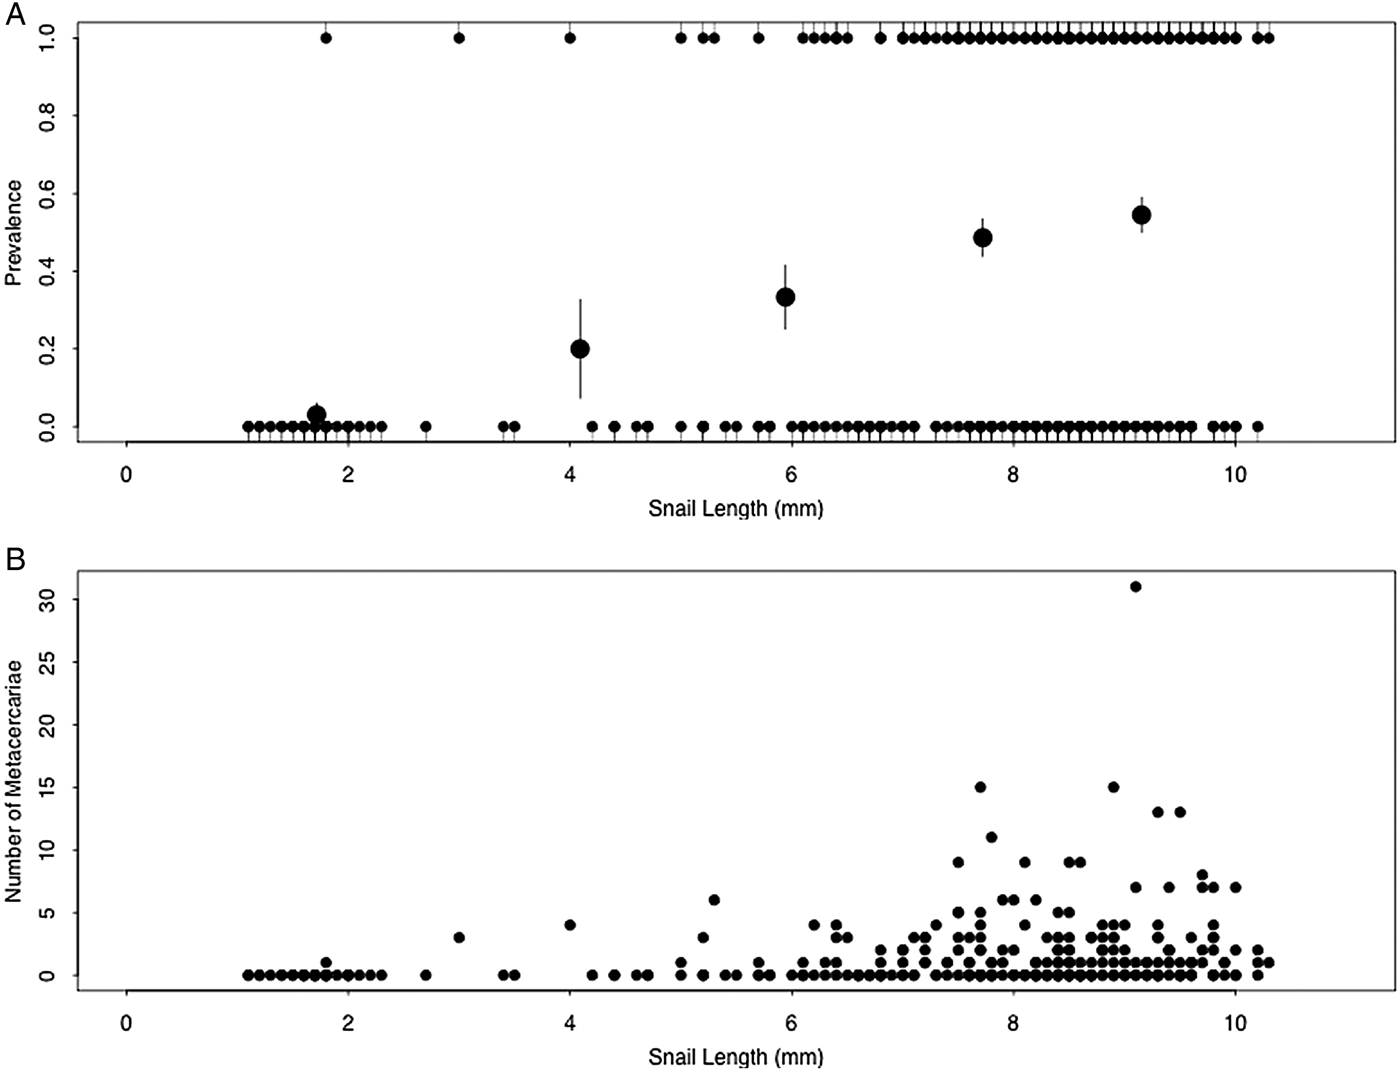
A total of 308 field-collected snails were examined. Among these individuals, prevalence of metacercarial infection significantly increased with increasing snail size (Kendall's τ = 0.24, P < 0.0001; Fig. 2A). Abundance of metacercarial infection significantly increased with increasing snail size (Kendall's τ = 0.21, P < 0.0001; Fig. 2B). However, intensity of metacercarial infection did not differ significantly with increasing snail size (Kendall's τ = 0.00, P = 0.48; Fig. 2B).
(A) Prevalence and (B) number of Sphaeridiotrema spp. metacercariae in faucet snails collected from Pool 8 of the UMRR. Large circles in (A) indicate the mean (±s.e.) infection probability of data quintiles. Infection prevalence (A) and abundance (B) increased with increasing snail size, while infection intensity (B) did not significantly correlate with snail size.
Size susceptibility experiment
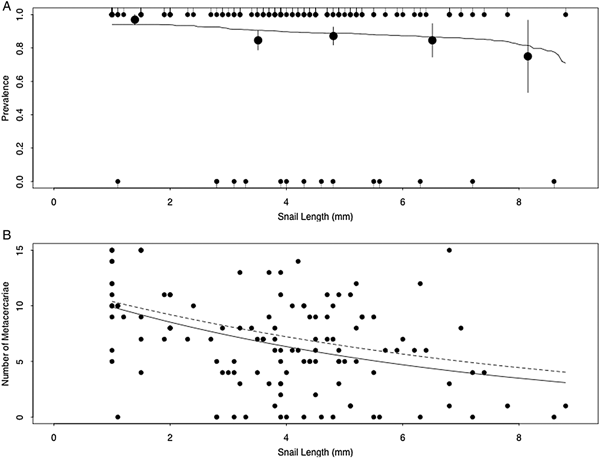
A total of 128 laboratory-reared snails were experimentally exposed to cercariae. Prevalence of metacercarial infection did not differ significantly with increasing snail size (binary logistic regression; β size = −0.24, P = 0.11; Fig. 3A). However, abundance of metacercarial infection significantly decreased with increasing snail size (Poisson GLM; size = −0.15, P < 0.0001; Fig. 3B), as did intensity of metacercarial infection (Poisson GLM; size = −0.12, P < 0.0001; Fig. 3B).
(A) Prevalence and (B) number of S phaeridiotrema pseudoglobulus metacercariae infecting faucet snails exposed to 15 cercariae in the laboratory. Infection prevalence did not signficantly correlate with snail size (A), while infection abundance and intensity decreased with increasing snail size (B). Solid line in (A) indicates prediction of binomial logistic regression, while large circles in (A) indicate the mean (±s.e.) infection probability of data quintiles. Solid line in (B) indicates prediction of Poisson regression on abundance, while dashed line in (B) indicates prediction of Poisson regression on intensity.

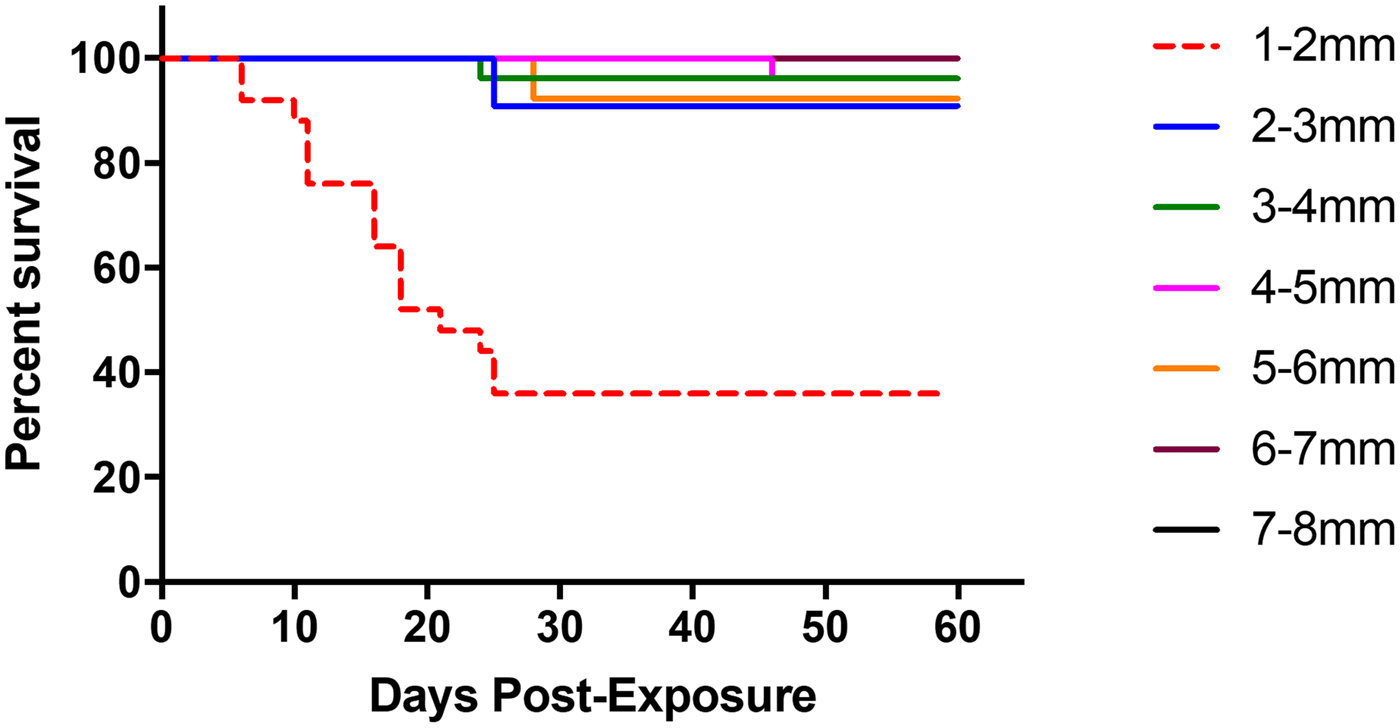
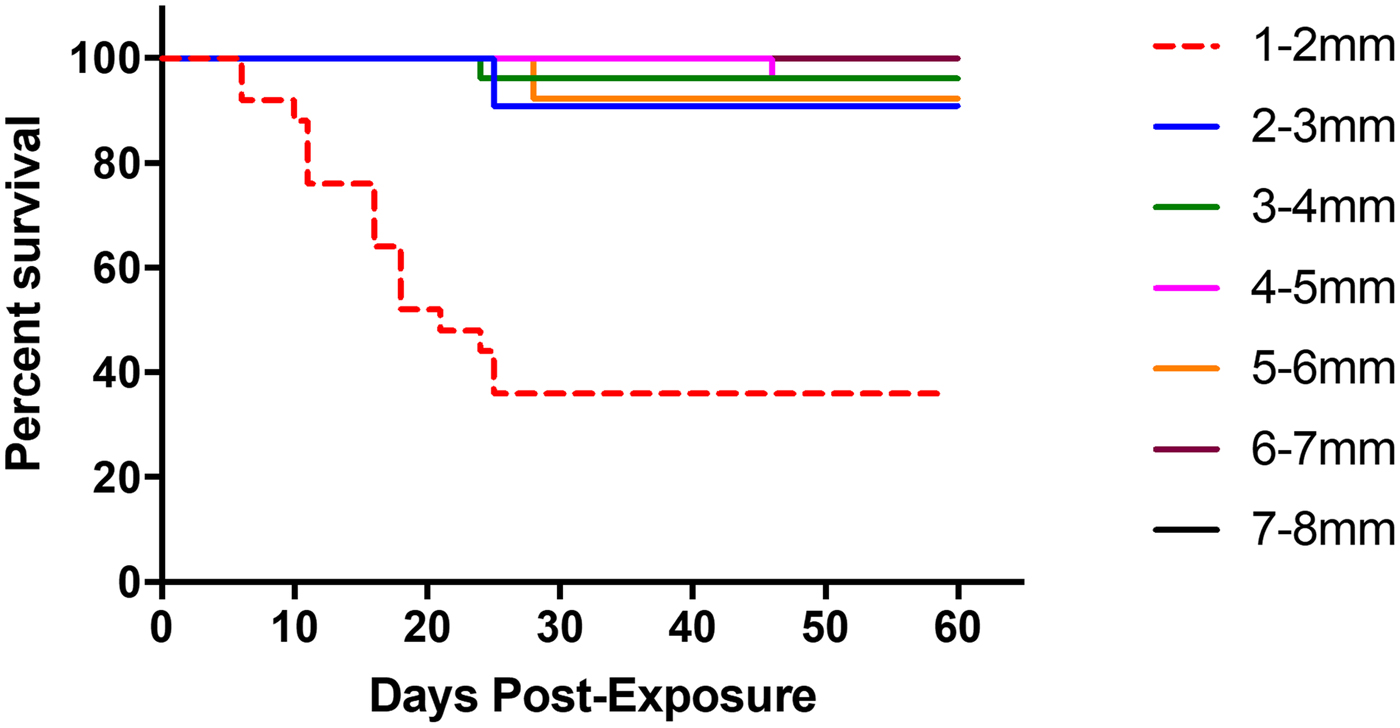
Among successfully infected experimental snails (n = 112), post-exposure survivorship differed significantly between snail size classes (Mantel–Cox test, χ 2 = 63.75, df = 6, P < 0.0001, Fig. 4), with the smallest snails (1–2 mm) experiencing higher overall mortality than snails from any of the larger size classes. Mean overall mortality was 64.0% (16 of 25) for 1–2 mm snails, 9.0% (one of 11) for 2–3 mm snails, 3.8% (one of 26) for 3–4 mm snails, 3.8% (one of 26) for 4–5 mm snails, 13.0% (one of 13) for 5–6 mm snails, 0.0% (zero of seven) for 6–7 mm and 0.0% (zero of four) for 7–8 mm snails. Among snails in the smallest two size classes (<3 mm), metacercarial abundance significantly negatively correlated with number of days survived (Pearson correlation r = −0.61, R 2 = 0.38, P < 0.0001).
Survivorship curve of infected faucet snails following experimental exposure to S phaeridiotrema pseudoglobulus cercariae. The smallest size class of snails (1–2 mm; indicated by red, dashed line) showed the highest level of mortality in comparison with other size classes. No mortality was experienced by snails in the 6–7 mm size class and 7–8 mm size class, thus they have overlapping lines on the figure.
Host size and parasite attachment
Across trials, cercariae attached to the smaller snail in seven out of 20 (35%) of the trials and the larger snail in 13 out of 20 trials (65%). Thus, cercariae did not show a significant likelihood of attachment based on snail size category (one-sample binomial test, P = 0.26).
Discussion
In snail–trematode systems, increases in snail size/age often correlate with increases in parasite prevalence, abundance and intensity, leading to the question of whether small (young) snails may play a role in parasite infection and transmission. However, the mechanisms underlying this pattern are rarely investigated. The objective of this study was to quantify natural variation in infection metrics relative to snail size and to use experiments to test several potential mechanisms underlying the observed patterns from the field. Our field study found that smaller snails had lower Sphaeridiotrema spp. metacercarial infection prevalence and abundance than larger snails, which is consistent with natural patterns in other digenean systems (Fernandez et al., Reference Fernandez, Hamann and Kehr2013) and in the Bithynia–trematode system (Lepitzki, Reference Lepitzki1993; Roy and St-Louis, Reference Roy and St-Louis2017). Infection intensity did not differ significantly with snail size, which is likely driven by the lack of observed infections in many of the small snails.
In contrast to our field study results, our experimental work showed that very small snails were, in fact, highly susceptible to infection. Prevalence of infection was equally high among all snail sizes, while infection intensity among experimentally infected snails actually decreased with increasing snail size, suggesting that the pattern of low parasite prevalence in smaller, field-collected snails is not due to them being more refractory to infection. Cercariae rapidly infected snails of all sizes, and observations revealed little in the way of resistance behaviours or an inability of parasites to infect snails due to size constraints. Larger snails were occasionally observed closing their opercula following penetration by cercariae, a mechanism that the smallest snails rarely employed (Bachtel, personal observation). In fact, once a 1–2 mm snail was penetrated by a cercaria, the tail of the cercaria protruded from the shell and appeared to make it difficult for the snail to close the operculum. At an approximate length of 0.191 mm (Huffman et al., Reference Huffman, Stevens and Fried2012), Sphaeridiotrema cercariae are nearly a fifth the length of the smallest snails tested. The physical hindrance of opercular closure by invading cercariae may have facilitated infection by additional cercariae in smaller hosts. Support for this idea comes from the fact that several of the snails in the smallest size class harboured 15 metacercariae (six out of 26), which was the maximum number of cercariae to which snails were exposed. By comparison, in all other size classes combined, only one snail had an infection intensity of 15 metacercariae. Work on both terrestrial and aquatic gastropods has recognized the importance of the operculum in protecting snails from both abiotic (e.g. desiccation) and biotic (e.g. predation) pressures (Vermeij and Williams, Reference Vermeij and Williams2007; Wood et al., Reference Wood, Haro, Haro and Sandland2011; Pall-Gergely et al., Reference Pall-Gergely, Naggs and Asami2016). Given these findings, it seems reasonable to expect that this structure could also aid in protection against parasites, including trematodes. Future work should attempt to elucidate whether closing of the operculum is a viable defensive mechanism employed by faucet snails against cercarial penetration.
The second mechanism we aimed to test was that small snails might be dying quickly from infection and are therefore removed from sampled populations in the field. Indeed, mortality following experimental infection was highest among smaller infected snails compared with larger infected snails. Within the smallest size classes of snails (those <3 mm), metacercarial abundance negatively correlated with number of days survived; while only three infected snails >3 mm died prior to the end of the experiment. This result suggests that snails may have a threshold size at which they are able to better tolerate secondary infections. However, the specific cause of mortality is an area in need of further investigation. Studies on related snail–trematode systems have documented extensive tissue damage as a result of cercariae exiting snail tissues (Pan, Reference Pan1965) and it has been postulated that cercarial reinfection can further contribute to snail morbidity (Sandland and Minchella, Reference Sandland and Minchella2003). The relative size of S. pseudoglobulus cercariae relative to the smallest snails (<2 mm) suggests that tissue damage as a consequence of cercarial penetration may also contribute to snail mortality in this system. Thus, the low infection prevalence and abundance observed in small snails collected from the field may be the product of high mortality among small snails following infection (Kuris and Warren, Reference Kuris and Warren1980); however, it is important to note that our study did not explicitly compare mortality among infected and uninfected snails of different size classes. Regardless of the mechanism underlying mortality, our study suggests that smaller snails have the potential to become infected in the field which may have consequences for the parasite population if small snails die shortly after metacercarial establishment.
Finally, we explored whether reduced parasite prevalence in small snails could be due to trematodes being more likely to attach to and infect larger snails (i.e. greater overall surface area for parasite contact). Based on our preliminary investigation using paired snails of differing sizes, we found no convincing evidence that cercariae were more likely to attach to larger hosts. It must be noted here however, that our tests were conducted in a relatively small volume of water using snails that differed in size between 1 and 4 mm. In the field, larger differences in size among individuals along with scaling changes in other infection-related parameters such as chemical cues and behaviours (Combes et al., Reference Combes, Fournier, Mone and Theron1994; Haas, Reference Haas1994, Reference Haas2003; Haas et al., Reference Haas, Haberl, Kalbe and Korner1995) could contribute to the natural infection patterns that we observed in B. tentaculata.
Although smaller snails succumb to infection quite quickly, successful parasite transmission to waterfowl hosts may still be possible if metacercariae reach maturity and become fully encysted prior to host mortality. Sphaeridiotrema spp. commonly encyst within the spire of the shell, where they can actually become encapsulated in the shell itself (Lepitzki et al., Reference Lepitzki, Scott and McLaughlin1994). Furthermore, S. pseudoglobulus has a plug in its outer metacercarial wall, which research has suggested could prolong parasite survival even after snail death and degradation of the visceral tissues (Lepitzki and Bunn, Reference Lepitzki and Bunn1994; Lepitzki et al., Reference Lepitzki, Scott and McLaughlin1994). There is evidence that the metacercariae of some digenean species (echinostomes) can survive for over a month after the death of their snail hosts (Christensen et al., Reference Christensen, Frandsen and Roushdy1980). Given this, Sphaeridiotrema spp. could continue to transmit to migrating waterfowl after the death of their hosts if these birds inadvertently ingest empty shells as they forage in and around benthic substrates and vegetation (Lepitzki and Bunn, Reference Lepitzki and Bunn1994).
In conclusion, while infection prevalence and abundance were low among small field-collected snails, laboratory experiments showed that susceptibility was high within this group. Thus, our study demonstrates the importance of pairing field and laboratory studies to understand mechanisms underlying patterns of parasite infection. Additional alternative hypotheses remain to be tested, including whether reduced prevalence and abundance among small snails in the field is a consequence of a reduced exposure period. As the invasive faucet snail and its trematode parasites continue to expand their range, the potential for increased overlap between infected snail populations and migrating waterfowl presents increased risks of future epidemics. By demonstrating the susceptibility of very small snails to trematode infection, our study highlights the need for further research aimed at understanding the role these small snails play in overall parasite transmission within this system.
Acknowledgements
We would like to thank Madison Bailey-Schofield, Lisa Bontemps, Allison Cambra, Susan Frankki, Calvin Gehri, Krista Hines, Anthony Hutchens, A.J. Kressin, Kendra Pednault, Tara Rajaniemi, Daniel Rittenhouse, Jessica Waite, Stephen Winter, Robert Wolf, Upper Mississippi River National Wildlife and Fish Refuge, and the US Fish and Wildlife Service for various forms of assistance with this work. We also thank several anonymous referees, whose comments greatly improved the manuscript.
Financial support
This work was supported by the Office for Undergraduate Research at the University of Massachusetts Dartmouth and a Dean's Distinguished Fellowship at the University of Wisconsin La Crosse.
Conflict of interest
None.
Ethical standards
Not applicable.