


Why don’t the poor soak the rich? This is an enduring puzzle in democratic political theory (see Shapiro Reference Shapiro2002), and the relative lack of support for redistribution in the United States is especially surprising, given high and rising income inequality (see Meltzer and Richard Reference Meltzer and Richard1981). One possible explanation, advanced in prior work, is that voters’ antipathy toward government undermines their support for policies designed to address inequality. Specifically, that opposition to federal spending on redistributive social policies can be explained by their distrust of government (see Hetherington Reference Hetherington2005). A key prediction from this theory is that, in the counter-factual world where Americans trusted the government more, they would be more supportive of redistribution.
Prior empirical studies have shown that political trust—an individual-level attitude—predicts support for federal spending on a variety of redistributive social policies, such as welfare and food stamps (Hetherington Reference Hetherington2005; Hetherington and Globetti Reference Hetherington and Globetti2002; Rudolph and Evans Reference Rudolph and Evans2005). The dominant approach to demonstrating the impact of political trust on support for redistribution has been to apply a multiple regression design to cross-sectional survey data. This process entails starting with a short regression of policy attitudes on political trust and then controlling for potential common causes that would lead to biased estimation if left out. The parameters in these long regressions, however, are not causally identified and estimation is biased and inconsistent unless strong (and untestable) assumptions hold (see Samii Reference Samii2016).
I depart from prior studies that rely on the multiple regression framework and instead use an approach that leverages a randomly assigned instrument to identify and estimate the effect of political trust on support for redistribution. Across three independent survey experiments, I find that large increases in political trust have negligible effects on support for redistributive social policy that are indistinguishable from zero. Although declining political trust may have caused the “demise of American liberalism” (see Hetherington Reference Hetherington2005), the evidence reported here suggests increased trust in government, on its own, is unlikely to restore it.
THEORY AND IDENTIFICATION
The measurement and meaning of voters’ judgments about “the honesty and other ethical qualities of public officials” (Stokes Reference Stokes, Cleveland and Lasswell1962, 64) has attracted attention since the concept of political trust was introduced to survey research in the 1950s. Although early studies focused on the causes of political trust (see Citrin Reference Citrin1974; Miller Reference Miller1974), subsequent research shifted toward its wide-ranging effects on support for government and its leaders (see Hetherington Reference Hetherington1998, Reference Hetherington2005; Hetherington and Rudolph Reference Hetherington and Rudolph2008) and the role perceived corruption plays in undermining this support (see Anderson and Tverdova Reference Anderson and Tverdova2003; Bowler and Karp Reference Bowler and Karp2004). More recent studies have found that publicizing corruption has strong and lasting effects on political trust (Green, Zelizer, and Kirby Reference Green, Zelizer and Kirby2018) and downstream consequences for voting behavior (Chong et al. Reference Chong, De La O, Karlan and Wantchekon2014).
An influential theory posits that political trust also affects voters’ policy preferences: “other things equal, if people perceive the architect of policies as untrustworthy, they will reject its policies; if they consider it trustworthy, they will be more likely to embrace them” (Hetherington Reference Hetherington2005, 51). Although this theory has broad implications for a variety of policies, the core claim is that political trust has the largest effects on support for policies that are explicitly redistributive in nature (e.g., welfare). This is because, unlike distributive social policies that spread costs and benefits across a broad political constituency (e.g., social security), redistributive policies require political majorities to make material sacrifices (e.g., increased taxes) for the benefit of political minorities (see Hetherington Reference Hetherington2005, chap. 5; Hetherington and Globetti Reference Hetherington and Globetti2002; Rudolph Reference Rudolph, Zmerli and var der Meer2017 for review).
This is a linear causal model: if an individual’s trust in government increases, their support for government spending on redistributive social policy increases. The dominant approach to testing has been to fit regression models of individuals’ policy preferences on their trust in government using national opinion surveys (e.g., Hetherington Reference Hetherington2005; Hetherington and Globetti Reference Hetherington and Globetti2002; Rudolph and Evans Reference Rudolph and Evans2005). The simplest approach would fit a bivariate model where support for redistribution is a linear function of trust in government. In the special case where factors omitted from the model are uncorrelated with political trust, this short regression is an unbiased and consistent estimator; otherwise, estimates are biased in an unknown direction. Prior studies have attempted to avoid this problem by adding a variety of control variables (e.g., Hetherington Reference Hetherington2005; Table 5.6), but long regressions are still biased and inconsistent when untestable assumptions fail.
The key assumption is that added controls are sufficient for eliminating the association between any unobserved determinants of policy attitudes and political trust. The President’s party is one important factor that affects both policy preferences and political trust (see Citrin Reference Citrin1974; Morisi, Jost, and Singh Reference Morisi, Jost and Singh2019), but others include Congressional approval ratings (e.g., Hetherington Reference Hetherington1998), voters’ evaluations of partisan conflict and legislative gridlock (e.g., Hibbing and Theiss-Morse Reference Hibbing and Theiss-Morse2002), prevailing economic conditions (e.g., Citrin and Green Reference Citrin and Green1986), and voter ideology (e.g., Rudolph and Evans Reference Rudolph and Evans2005). Regression estimates are biased, typically in an unknown direction, when common causes are omitted or unobserved.
Additional assumptions include (1) policy preferences do not affect political trust; (2) no control variables are affected by political trust (see Angrist and Pischke Reference Angrist and Pischke2009, chap. 3; Clarke Reference Clarke2005); and (3) the correct specification is used (see Aronow and Samii Reference Aronow and Samii2016; Ho et al. Reference Ho, Imai, King and Stuart2007). In prior studies, this would imply omnibus opinion polls (1) measured all potential common causes of political trust and support for redistribution; and (2) the minimally sufficient set of controls to include in a correctly specified regression were known. Whether these assumptions hold is ultimately a matter of faith (see Samii Reference Samii2016).
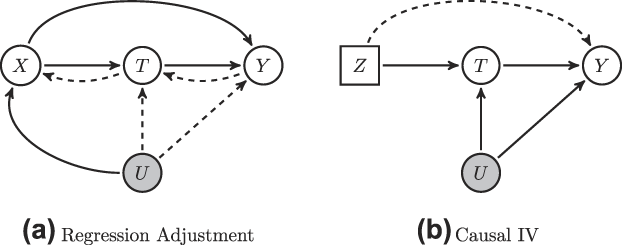
To overcome these inherent challenges, I use a Causal Instrumental Variables (IV) design that instead relies on a randomly assigned instrument, which is therefore uncorrelated with both observed and unobserved factors (see Hernán and Robins Reference Hernán and Robins2006; Sovey and Green Reference Sovey and Green2011 on causal and non-causal IV). Figure 1 compares regression adjustment with Causal IV, which rests on two assumptions: (1) the instrument, Z, has a causal effect on political trust, T; and (2) Z only affects support for redistribution, Y, through the path Z → T → Y. Here, I use three survey experiments that randomly assigned information about levels of political corruption, Z, to identify and estimate the effect of political trust, T, on support for redistribution, Y. I verify the first assumption using the observed data and examine testable implications of violations to the second “Exclusion Restriction” (ER) assumption using placebo experiments, and by testing for effects on other outcomes.
Political Trust T Affects Support for Redistribution Y, but the Relationship Is Confounded by Unmeasured Common Causes U
Note: (a) X denotes the minimally sufficient set of controls. (b) Z denotes a randomized instrument. Solid arrows are assumed causal pathways and dashed arrows represent violations of identification assumptions.
CORRUPTION EXPERIMENTS
The link between corruption perceptions and trust in government is well established in prior work. In theory, reducing the information asymmetries that prevent voters from learning about political corruption enables them to hold politicians accountable and forces elected officials to act in the public interest (Besley Reference Besley2006; Persson and Tabellini Reference Persson and Tabellini2002). Empirically, the link between perceived corruption and voters’ trust and confidence in public institutions has been demonstrated across multiple observational (see Anderson and Tverdova Reference Anderson and Tverdova2003; Ares and Hernández Reference Ares and Hernández2017; Bowler and Karp Reference Bowler and Karp2004; Clausen, Kraay, and Nyiri Reference Clausen, Kraay and Nyiri2011) and experimental studies (see Chong et al. Reference Chong, De La O, Karlan and Wantchekon2014; Green, Zelizer, and Kirby Reference Green, Zelizer and Kirby2018; Kuziemko et al. Reference Kuziemko, Norton, Saez and Stantcheva2015). Given the important role that media play in shaping perceptions of corruption (see, e.g., Brunetti and Weder Reference Brunetti and Weder2003), treatments were designed to inform respondents about levels of corruption using Opinion pieces (“Op-Eds”): instruments of civic discourse that have powerful and persistent persuasion effects (see Coppock, Ekins, and Kirby Reference Coppock, Ekins and Kirby2018).
These Op-Ed treatments were presented as written in the New York Times by a former prosecutor in the DOJ’s Public Integrity Section—the branch that prosecutes public corruption. Op-Eds were designed to affect readers’ beliefs about levels of generic government corruption and to be devoid of partisan content that might suggest corruption was related to a particular party or administration. In Experiments 1 and 2, subjects completed a short survey (including demographics and partisanship) and were then randomly assigned to one of three treatment arms: Honest, Corrupt, or Control. In Honest, participants read an Op-Ed that emphasized the integrity of government officials and low levels of political corruption. In Corrupt, participants read an Op-Ed that used contrasting language about the lack of integrity among government officials and the prevalence of political corruption. In Control, participants read a piece about celebrity chef Anthony Bourdain. Experiment 1 (N = 643) was conducted on Amazon Mechanical Turk (MTurk) in June 2014. Experiment 2 (N = 1,324), in September 2014, was a direct replication on a nationally representative panel. Experiment 3 (N = 1,870), on MTurk in March 2017, added data visualizations on DOJ corruption convictions that supported the Op-Eds; Control, an Op-Ed about recycling, also included a data visualization. These visualizations were added with the aim of increasing design power by making the Corrupt and Honest treatments more persuasive (see Nyhan and Reifler Reference Nyhan and Reifler2018). See Online Appendix S1 and S2 for additional details.
Placebo Experiments
The ER assumption here is that effects on support for redistribution only occur through political trust. This could be violated if treatment affected support for redistribution via another pathway (i.e., Z → Y in Figure 1). An important potential violation here is psychological valence because positive (or negative) stimuli tend to generate corresponding reactions (see Fredrickson Reference Fredrickson, Devine and Plant2013, for review), and the media content in the Honest and Corrupt treatment arms is either positive (absence of corruption) or negative (widespread corruption). I investigate this with Experiments 4 and 5, which were equivalent to Experiments 1 and 2, except the Honest and Corrupt arms provided information about the absence or presence of corruption in the National Football League (NFL). These “placebo experiments,” detailed in S3 of the online Appendix, serve two purposes. First, if effects on political trust in Experiments 1–3 are simply a function of content valence, they should also be detectable when political content is removed. More importantly, if support for redistribution—but not political trust—is affected by treatments about nonpolitical corruption, this provides evidence of an ER violation and suggests an alternative mechanism could bias estimates in Experiments 1–3.
Measurement
Prior work cautions that estimates from regressions fit to ANES measures of political trust (e.g., “How much of the time do you think you can trust the government in Washington to do what is right?”) are attenuated due to measurement error (see Hetherington Reference Hetherington2005, 14–6). To mitigate this, I measure political trust by combining four survey items (e.g., “We generally cannot trust politicians”) recorded on the same measurement interval from “Strongly Disagree” to “Strongly Agree” into an additive scale.Footnote 1 Support for redistribution is also measured using an additive scale of responses to four questions about federal spending on food stamps, welfare, programs that assist “blacks and other minorities,” and assistance to the homeless. These dependent variables were used in foundational studies of political trust and support for redistribution (e.g., Hetherington Reference Hetherington2005). See S4 of the online Appendix for details on measurement and reliability.
RESULTS
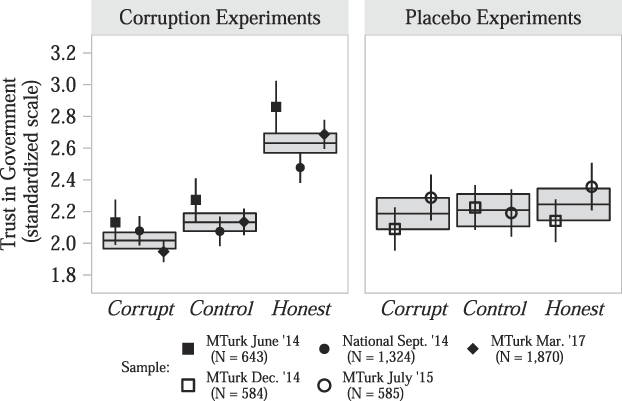
Figure 2 shows that, in the corruption experiments, average levels of political trust were lowest in the Corrupt arm and highest in the Honest arm but approximately the same across conditions in the placebo experiments. I leverage these experimentally induced changes to estimate the effect of increased political trust on support for redistribution with instrumental variables regression using two-stage least squares (2SLS). The 2SLS estimator,
 $${\hat{\beta }_{{\rm{IV}}}} = {{\widehat {{\rm{Cov}}}\left( {{Y_i},{Z_i}} \right)} \over {\widehat {{\rm{Cov}}}\left( {{T_i},{Z_i}} \right)}} = {{\widehat {{\rm{Cov}}}\left( {{Y_i},{Z_i}} \right)/\widehat {{\rm{Var}}}\left( {{Z_i}} \right)} \over {\widehat {{\rm{Cov}}}\left( {{T_i},{Z_i}} \right)//\widehat {{\rm{Var}}}\left( {{Z_i}} \right)}},$$
is the ratio of the “reduced-form” effect of subject i’s treatment assignment (the “instrument” Z i) on their support for redistribution Y i and the “first-stage” effect on their trust in government, T i. I code Z i = 0 if subject i is assigned Corrupt, Z i = 0.5 if assigned Control, and Z i = 1 if assigned Honest. Given random assignment of the instrument,  ${\hat{\beta }_{{\rm{IV}}}}$ is consistent for the causal effect of political trust on support for redistribution, provided the ER assumption holds and the first-stage effect is positive. With a multivalued instrument,
 ${\hat{\beta }_{{\rm{IV}}}}$ is a weighted average of causal estimates for different subpopulations of compliers, and my coding scheme assumes political trust increases with higher values of Z i (see Figure 2). This structural model mirrors the theory and estimation approach in prior literature, which specifies a linear causal relationship between political trust and support for redistribution (see Angrist and Pischke Reference Angrist and Pischke2009, chap. 4.5 on generalizing IV for multivalued treatments/instruments, and S5.2 of the online Appendix for results using Corrupt and Honest as separate instruments).
Trust in Government by Treatment Arm and Study Type
Note: Point estimates (with 95% CIs) are scaled by the standard deviation in control and denote average levels of trust in government for each experiment. Crossbars (with 95% CIs) denote group means pooled across experiments. See Table S.15 for point estimates and standard errors.
I use covariate-adjusted regression on the stacked dataset of individual experiments to estimate effects. Results are standardized using Glass’s Δ, which scales outcomes by the standard deviation in the control group (see Supplementary Material), and presented graphically with 90% and 95% confidence intervals (CIs) and a margin of equivalence (MOE) bound of ±0.20 standard units, which corresponds to an effect size of about one-fifth of one standard deviation. The hypothesis that an effect is indistinguishable from zero is rejected if a 95% CI excludes zero, and the hypothesis of nonequivalence is rejected in favor of equivalence when a 90% CI is contained within the MOE. I conclude an estimate is indistinguishable from zero and equivalent to a “negligible” effect size (larger than −0.20 and smaller than 0.20) when a 95% CI covers zero and a 90% CI falls inside the MOE (see Lakens Reference Lakens2017; Rainey Reference Rainey2014).
Figure 3 presents first-stage and reduced-form estimates across corruption and placebo experiments. The first-stage effect on trust in government (a 1 unit increase in Z from Corrupt to Honest) is 0.62 standard units (t = 15.20, P < 0.001, 90% CI: [0.55, 0.68]) in the corruption experiments, but approximately zero (Δ = 0.06, t = 0.82, P = 0.41, 90% CI: [−0.06, 0.18]) in the placebo experiments and statistically equivalent to a negligible effect size. This comparison supports the notion that first-stage effects in Experiments 1–3 are driven by content about political corruption.
Estimates From OLS Regression with HC2 Robust Standard Errors
Note: Thick horizontal lines denote 90% CIs and thin lines denote 95% CIs. Dotted vertical lines denote an MOE of ±0.20 standard units. Covariates: age, conservatism, income, indicators for partisanship (Republican, Democrat, Independent), sex (male or female), education (college degree or not), race (white or non-white), employed (yes or no), and a study fixed effect. See Table S.21 for point estimates and standard errors.
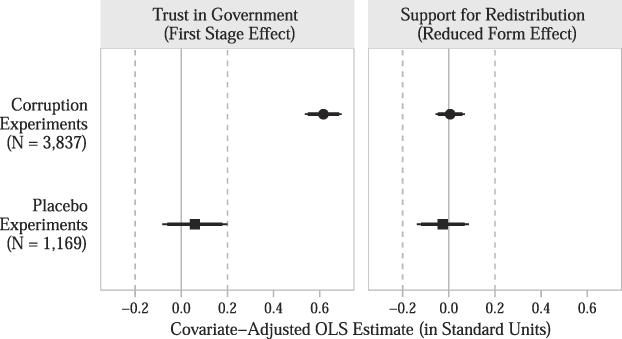
Reduced-form estimates in the corruption (Δ = 0.01, t = 0.20, P = 0.84, 90% CI: [−0.05, 0.06]) and placebo experiments (Δ = −0.03, t = −0.45, P = 0.66, 90% CI: [−0.12, 0.07]) are indistinguishable from zero. Because reduced-form estimates are proportional to the causal effect of interest, this can be taken as evidence that the effect of political trust on support for redistribution is approximately zero. The 2SLS estimate confirms this (Δ = 0.01, t = 0.21, P = 0.83, 90% CI: [−0.08, 0.10]). For context, the reduced-form and 2SLS estimates are approximately one one-hundredth the 1.05 point partisan gap in support for redistribution observed in Control. Because the corresponding 90% CIs are all within the MOE (roughly one-fifth the partisan gap), I conclude these effects are substantively negligible.
The 2SLS estimator is justified by random assignment and strong first-stage effects; and the combination of negligible reduced-form and first-stage estimates in the placebo experiments provides empirical support for the ER assumption. S5 of the Online Appendix contains a variety of supplementary material, including estimates for individual experiments, results without covariate-adjustment, tests for instrument strength, consideration of “demand effects” and alternative definitions of “negligible,” and tests of the sharp null of no effect for any subject. Results are also robust to using the ANES measure of political trust, partitioning the redistribution scale, using alternative measures of support for redistribution, and dropping subjects that failed pretreatment attention checks. I do not find evidence of first-stage effects on other attitudes that might indicate an ER violation, such as concerns about inequality. I also test the prediction that political trust should have weaker effects on distributive policies and find similar results, suggesting political trust has negligible effects on support for both distributive and redistributive policies.
Heterogeneity
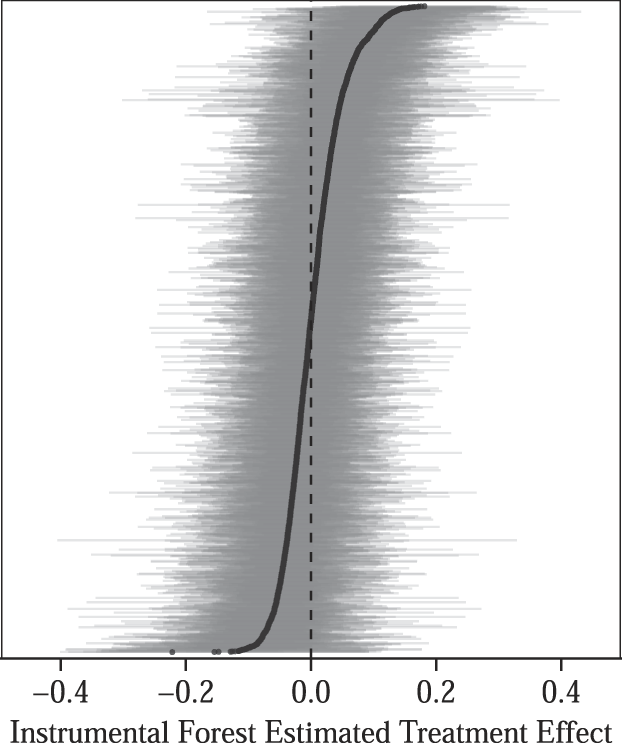
Political trust is predicted to have especially large effects among individuals that must make both material and ideological sacrifices to support redistribution (e.g., Popp and Rudolph Reference Popp and Rudolph2011). This has been supported by studies showing political trust is a stronger predictor of redistributive preferences for certain subgroups, for example, high-income white Republicans (see Rudolph Reference Rudolph, Zmerli and var der Meer2017, for review). I investigate this using generalized random forests (GRF), a machine learning algorithm that automates the search for treatment effect heterogeneity (see Athey, Tibshirani, and Wager Reference Athey, Tibshirani and Wager2019). GRF estimates heterogeneity as a function of subject-level covariates, with the key advantage that the “Instrumental Forest” estimator in the GRF framework is designed for IV estimation. Following graphical presentations in prior work (e.g., Guess and Coppock Reference Guess and Coppock2018), Figure 4 plots predicted treatment effects as a function of individuals’ covariate profiles, along with 95% CIs, to provide an overall summary of effect heterogeneity in Experiments 1–3. According to this analysis, only 3% of predictions were positive and statistically distinguishable from zero. S5.4 of the online Appendix examines treatment–covariate interactions for race, employment status, partisanship, and ideology. None are statistically significant after correcting for multiple comparisons.
Estimated Effects of Political Trust on Support for Redistribution Using the Instrumental Forest Estimator in the grf Package for R with the Recommended Settings of Honest Splitting and 4,000 Trees
Note: Black dots indicate estimated treatment effects for each individual in Experiments 1–3, as a function of their covariate profile, ordered by effect size. Gray horizontal lines indicate 95% CIs. Covariates: age, conservatism, income, indicators for partisanship (Republican, Democrat, Independent), sex (male or female), education (college degree or not), race (white or non-white), employed (yes or no), and a study fixed effect.
IMPLICATIONS
In the United States, income for the top 1% of adults more than tripled from 1980 to 2014, whereas earnings for the bottom 50% remained stagnant (Piketty, Saez, and Zucman Reference Piketty, Saez and Zucman2017, 557). This should, in theory, increase demand for redistribution; yet, support for government policies designed to ameliorate inequality has not increased since the 1970s (see Ashok, Kuziemko, and Washington Reference Ashok, Kuziemko and Washington2016). An alternative theory, which might explain this puzzling divergence, holds that trust in government causes support for redistribution.
According to this account, the post-1960s decline in political trust “played the central role in the demise of progressive public policy in the United States” (see Hetherington Reference Hetherington2005, 3). Trust in government remains at historic lows, and the vast majority polled in recent years believe corruption is “widespread” throughout the government (see Doherty, Kiley, and Johnson Reference Doherty, Kiley and Johnson2017; Gallup 2015). In the counter-factual world where Americans trust their government more, are they more supportive of redistribution?
Prior studies have not provided a clear answer, leaving open a question with direct implications for the puzzling disconnect between economic conditions and public support for redistribution. Here, I find that large increases in political trust—more than enough to eliminate the gap between Democrats and Republicans—have negligible effects on support for redistribution that are statistically indistinguishable from zero. This provides new evidence, and raises additional questions, about the theory that political trust causes support for redistribution.
Though I do not find support for this theory, it should be noted that the experiments reported here caused larger increases in political trust compared with decreases (see Figure 2, S5.2 of the online Appendix), and inducing distrust via other methods may produce different results. For example, Kuziemko et al. (Reference Kuziemko, Norton, Saez and Stantcheva2015) found telling Americans Transparency International ranked the United States among the most corrupt in a class of countries with similar levels of income and development induced small decreases in political trust and support for direct transfer policies (e.g., Food Stamps), and increased support for private charity as a nongovernmental solution to inequality. Although I was unable to replicate these results using Op-Ed treatments (see S5.7 of the Online Appendix), information about domestic corruption delivered by an NGO with a cross-national comparative frame may introduce exclusion restriction violations by priming other considerations that undermine support for redistribution, such as nationalism (see Shayo Reference Shayo2009). Nair (Reference Nair2018), for example, finds that simply priming Americans to think about their relative affluence also decreases support for domestic redistribution (p. 826).
The estimates reported here are also local to subgroups of “compliers”—respondents who would be induced to change their political trust if treated. This important caveat applies to all IV estimates because effects in a broader population may be different. Further, strong effects on reported political trust could reflect experimentally induced measurement error in survey instruments rather than effects on underlying attitudes. This would imply the direction of error depended on treatment assignment: negative in Corrupt and positive in Honest. Given estimates from the placebo experiments, one would also need to assume asymmetric error depended on domain-specific content about political corruption. The potential disconnect between effects on self-reported versus latent attitudes is a potential limitation of all survey-based research. Because prior studies draw largely on correlations among survey responses, accumulated knowledge about the measurement and meaning of self-reported political trust may be inadequate (see Intawan and Nicholson Reference Intawan and Nicholson2018; Levi and Stoker Reference Levi and Stoker2000).
A related consideration is that even large increases in political trust may not be enough to increase support for redistribution. If both are largely determined by partisanship and long-standing ideological convictions, this could also explain their association and the results reported here. If they are not causally related, their association may nevertheless be indicative of a particular political equilibrium. For example, individuals with higher levels of political trust were more opposed to food stamps in the 1980s, a period dominated by Republican administrations, political rhetoric about “welfare fraud,” and media content that overrepresented the proportion of black individuals in receipt of government assistance (see Gilens Reference Gilens1999). Other correlates of political trust—including racial prejudice and views about government inefficiency—may provide better insights into Americans’ opposition to redistribution than their distrust of government.
The effects of political trust on support for redistribution may ultimately prove more complex than prior theory suggests. This paper provides new empirical benchmarks that demonstrate increased trust in government, on its own, has a negligible effect on support for redistribution. This should provide a starting point for further discussion about the relationship between policy preferences and attitudes toward the state during an era of rising inequality and eroding confidence in public institutions.
SUPPLEMENTARY MATERIAL
To view supplementary material for this article, please visit https://doi.org/10.1017/S0003055420000076.
Replication materials can be found on Dataverse at: https://doi.org/10.7910/DVN/L3NT6P.




Comments
No Comments have been published for this article.