1. Introduction
1.1. A good understanding of longevity risk is important for the financial management of pension funds, annuity portfolios and longevity derivatives.
1.2. Actuaries have been using socio-economic circumstances (SEC) of individuals estimated through postcodes, pension size and occupation to price annuities of prospective customers (McLoone Reference McLoone2001; Richards Reference Richards2008). Differences in mortality rates of people in different SEC have been discussed extensively (Telford et al., Reference Telford, Browne, Collinge, Fulcher, Johnson, Little, Lu, Nurse, Smith and Zhang2011). However, less is known about how their mortality rates have changed over time (CMI, 2009a, b). The lack of credible data has hampered the study of mortality improvement by SEC.
1.3. Previous attempts to investigate mortality improvement by SEC have included the: i) comparison of data (England and Wales) from the Office for National Statistics (ONS) with the Continuous Mortality Investigation (CMI) Assured Life dataset; ii) comparison of broad socio-economic groups using the English Longitudinal Study (ELS) (CMI, 2009a, b).
1.4. The authors of the Continuous Mortality Investigation (CMI) (2009b) had compared the annual rates of improvement in mortality derived from various datasets including CMI Permanent Assurance, CMI Life Office Pensioners and England & Wales population from the ONS. These datasets were compared because the CMI insured lives were thought to include people in higher SEC when compared with the ONS population. However the results were inconclusive as the CMI dataset had experienced a decline in the contribution of data from participating members, causing a fall in data volume. The authors noted that the CMI datasets had suffered from issues related to continuity, reliability, credibility and volume, making trend analyses difficult (CMI, 2009a, b).
1.5. Examining recent data from the ONS Longitudinal Study, the authors also concluded there was a lack of evidence for any difference in annual rates of improvement in mortality between various social class (CMI, 2009b). The ONS Longitudinal Study mortality data comprises 1% of the population within England with releases about once every four years. The relatively low volume and infrequent release of data may have added uncertainty to mortality trend analyses for people in different social classes.
1.6. Consequently, it is a common practice to assume the same future mortality assumption regardless of socio-economic groups. There is a risk that improvements in mortality of sub-populations are not in line with assumptions that are based on total population trends. This is basis risk which could result in inadequate funding for annuities or losses in longevity swaps. We examine the potential extent of basis risk retrospectively using historical data and prospectively considering some potential future scenarios.
1.7. Taken together, a lack of regular, consistent and credible past mortality data of people in different SEC have hampered the study of historical mortality trends. This in turn has made forecasting a greater challenge. To address these data issues, we have obtained mortality data between 1981 and 2007 for England, divided relatively equally into SEC quintiles (measured by relative deprivation of area of residence according to the Index of Multiple Deprivation (IMD) 2007). Annual death counts by gender, SEC quintiles and 5-year age bands (ages 50 to 85+) were obtained from the ONS. By using the data of the total population of England, rather than 1%, this dataset addresses the issues of low volume and enhances statistical credibility. As death information has been consistently collected by the Death Registry, it is more reliable and consistent than the CMI life assured dataset which has suffered from falling data contribution from life offices. So, our dataset addresses issues of low volume, consistency and credibility that have been encountered in the past. We are aware of the substantial volume of data which has been collected and analysed by the CMI's Self-administered Pension Schemes (CMI, 2011a) working party and Club Vita. We look forward to comparing our results with them.
1.8. We smoothed 3-year moving average mortality rates by 5-year age bands using the P-Spline Age-Period method (Currie et al., Reference Currie, Durban and Eilers2004). We then estimated the annual mortality rates (Mx) and Qx for individual ages. Annual change in Qx were measured and ‘heat maps’ of annual rates in improvement in mortality were produced for illustration. The results suggest differences in historical improvements in mortality between SECs. For example, people in the least deprived IMD quintile have experienced faster rates of improvement in mortality and potentially more pronounced cohort patterns when compared with the most deprived.
1.9. The findings can provide insight into mortality improvement for people in different SEC. This can contribute to commercial decisions for annuity businesses, reinsurance and longevity swaps.
2. Data and Methods
2.1. Step 1: Obtaining mortality and population data split by SEC
2.1.1. Socio-economic classification of the population was derived using the 2007 version of an area based measure known as the Index of Multiple Deprivation or IMD (Noble et al., Reference Noble, McLennan, Wilkinson, Whitworth and Barnes2008). The IMD 2007 combines seven socio-economic domains of deprivation (based upon 38 indicators) into a single deprivation score for each geographically defined lower layer super output area (LSOA) within England. There are 32,482 LSOAs covering approximately 1500 persons each. The seven domains provide measures of: i) income deprivation (22.5%); ii) employment deprivation (22.5%); iii) health deprivation and disability (13.5%); iv) education, skills, and training deprivation (13.5%); v) barriers to housing and services (9.3%); vi) living environment deprivation (9.3%) and vii) crime (9.3%). The LSOAs were ranked from 1 to 32,482 by their IMD 2007 score and separated into quintiles representing a range from the least (IMD Quintile 1) to the most (IMD Quintile 5) deprived.
2.1.2. Mortality data: We obtained mortality data by year of registration of death for each year over the period 1981 to 2007 from the ONS. To preserve anonymity, counts were provided by ONS aggregated up to 5-year age bands to age 85+, by sex and by IMD quintile. For this paper, we limited our analysis to people aged 55 and older. To reduce year-on-year variability in age-specific rates, we calculated three-year moving averages by aggregating counts and exposure data over contiguous years. In the tables and results, we quote just the central year to denote each three-year interval (i.e. ‘1982’ for rates calculated by pooling mortality and population data for 1981, 1982 and 1983).
2.1.3. Population Data: For the period 2001–2007, mid-year population estimates for each LSOA by five year age-group and sex were provided by ONS. These were then aggregated up to deprivation quintiles, based on the quintile membership of each LSOA.
2.1.3.1. For the period 1981 to 2000, we used annual population estimates calculated by Dr Paul Norman and colleagues at Leeds University. These were produced as part of Economic and Social Research Council (ESRC) funded projects to update and improve prior work (Norman et al., Reference Norman, Simpson and Sabater2008; Rees et al., Reference Rees, Norman and Brown2004). A cohort-component model was used with outputs constrained to sum to the ONS sub-national estimates for each year. The methodology was similar to that used by ONS for the 2001–2007 estimates: namely, for any small area, the population for the year following a reliable count (such as in a census year) can be calculated by adding in the count of births (by sex), subtracting deaths (by age and sex) and allowing for in and out migration (by age and sex) as people move house (whether sub-nationally or internationally) with all survivors one year older. Initially, estimates were made at the electoral ward level in 5-year age bands by sex and constrained to sum to the ONS mid-year estimates at local government level in the inter-censal period. The ward estimates were then converted to the LSOA geography using the number of postcodes as a weighting proxy to apportion the population between overlapping ward and LSOA boundary systems.
2.1.3.2. For this report, the LSOA population estimates for each year were aggregated into IMD quintiles: aggregations reduce the impact of any error at LSOA level and ensure robustness so that the age-sex counts by quintile are fit for purpose. No other organisation has produced for publication or public consumption population counts by deprivation for all years going as far back as 1981.
2.2. Step 2: Analysis of change in mortality between 1982 and 2006 by SEC, gender and 5 year age-bands
2.2.1. We compared 3-year moving average mortality rates of 5-year age-bands for males or females in different SEC quintiles between 1982 and 2006. Using a method described by the CMI (Robjohns, Reference Robjohns2010) for estimating standard deviation for change in mortality rates, we calculated the 95% confidence intervals of the change in mortality rates of various SEC between the 2 periods. These were then used to determine statistical significance of the differences in the change in mortality rates between the 2 periods.
2.2.2. The equations for the derivations of standard deviation for improvement in mortality for age x between time t and t + 1 are:
2.2.2.1. Mortality rate
Mortality rate at age x and time t, Qx,t = Dx,t/Nx,t
Standard error for mortality rate, σ(Qx,t) = √(Dx,t/Nx,t)
Where D = number of deaths at age x at and time t to t + 1 and N = number of population alive at age x and time t
2.2.2.2. Rates of mortality improvement (RMI)
RMIx,t + 1 = 1−(Qx,t + 1/Qx,t) = 1− (Dx,t + 1/Nx,t + 1)/ (Dx,t/Nx,t)
Standard error for mortality improvement rate, σ(RMIx,t + 1) ≈
(Qx,t + 1/Qx,t) × [exp{√ (1/Dx,t + 1 −1/ Nx,t + 1+1/Dx,t −1/ Nx,t)}−1]
≈ √ (1/Dx,t + 1 + 1/Dx,t)
2.3. Step 3: Graduation of mortality rates by age-bands and calendar years using the P-Spline method
2.3.1. A spreadsheet based tool (CMI Mortality Projection Spreadsheet v3.0) supplied by the Continuous Mortality Investigation Board (CMIB) of the Institute and Faculty of Actuaries (http://www.actuaries.org.uk/) was used to smooth the mortality data by 5-year age bands and calendar year, divided by gender and IMD quintile.
2.3.2. We employed the P-Spline (Age-Period) method supplied by the tool. The P-Spline regression method is a localised 2 dimensional (age and period) smoothing mechanism (Eilers et al., Reference Eilers and Marx1996; CMI, 2007). Default parameters for age and period were selected including the following: i) Order of penalty: second order (linear projection); ii) Distance between knots (B-Spline basis): 5 knots. Other parameters include the degree of the B-Spline used as the basis for the fit (comparable to the order of the function within a polynomial regression the default value is 3).
2.3.3. The outputs are graduated log of 5-year age-band mortality rates by calendar years split by gender and IMD quintiles.
2.4. Step 4: Estimating mortality rates for individual ages
2.4.1. Log of mortality rates of 5-year age bands were linearly interpolated to derive the log of mortality rates for individual ages, with the age in the middle of the age-band retaining the mortality rates for the entire 5-year age band. For example, age 72 assumes the mortality rates of age-band 70–74.
2.5. Step 5: Deriving annual rates of improvement in mortality
2.5.1. The mortality rate of an individual age x is interpreted as Mx. The Mx is used to estimate Qx using the formula Qx ≈ Mx/(1 + 0.5Mx).
2.5.2. Annual rate of improvement in mortality of age × between time t and t + 1 is derived from the formula (1−Qx,t + 1/Qx,t).
2.6. Step 6: Estimating financial consequences
2.6.1. To understand the potential extent of basis risk, we compare the present value of a group of male pensioners’ liability using the historical improvement in mortality for the total population against that of the most or least deprived IMD quintile (1982 to 2006). The pensioner population reflects the UK age structure for ages 60 to 84 (1982). They all have the same nominal fixed pension. For this illustration, the pension payments will stop at age 84 to ensure the analysis relies on the more robust SEC data between ages 60 and 84, without using information on the open age group 85+. The PMA80 life table, reflecting annuitants’ mortality rates in the early 80s, is used as the base mortality in 1982. Cash flows for these pensioners were projected into the future then discounted at 0%, 3% or 5% p.a.
2.6.2. We consider potential differences in future mortality improvement for different SEC relative to the total mortality trend. For illustration, we project the future mortality improvement of England & Wales population using the CMI 2011 Model with long term rates of 1% or 2% p.a. which are within the range of assumptions commonly used in the insurance and pensions practices (CMI, 2011b). We consider 2 scenarios:
2.6.2.1. Scenario 1: the difference in average mortality improvements between SEC quintiles and the total population, observed in 5 years ending 2005, would continue perpetually. Annuity factors for age 65 were produced using the CMI 2011 Model core parameters. Increments of 0.25% p.a. mortality improvement rates were added or deducted to all projected mortality improvement rates. Suppose the population is assumed to have long-term rates of 1% p.a. The scenario would have 0.25% p.a. added to all projected rates including the initial and long-term rates.
2.6.2.2. Scenario 2: the difference in average mortality improvement between SEC quintiles and the total population, observed in 5 years ending 2005, would be temporary. For example the initial annual mortality improvement rates of the most affluent SEC groups would be higher than that of the total population. But the difference will reduce and will eventually disappear over the convergence period between initial and long-term rates in the CMI model (ranges from 5–20 years depends on age). Annuity factors for age 65 were produced using the CMI 2011 core parameters. Increments of 0.25% p.a. mortality improvement rates were added or deducted to all projected mortality improvement rates, and long-term rates were adjusted such that the sum of long-term and additional rates equals 1% or 2% as intended. Suppose the population is assumed to have long-term rates of 1% p.a. The scenario would have 0.25% p.a. added to all projected rates with a long-term rate of 0.75% p.a., giving a total long-term rate of 1% p.a.
3. Results and Discussion
3.1. Differences in changes in mortality rates of various age bands between 1982 and 2006 for different IMD quintiles and gender
3.1.1. Some previous reports on mortality improvement between SECs have not provided statistical analyses or confidence intervals (CMI, 2009a, b). Using the described statistical analysis, we investigate the evidence of differences in the change in mortality rates between 1982 and 2006 of males and females in various IMD quintiles of various age-bands. We have also compared the change in mortality rates between genders within the same IMD quintiles and age-bands.
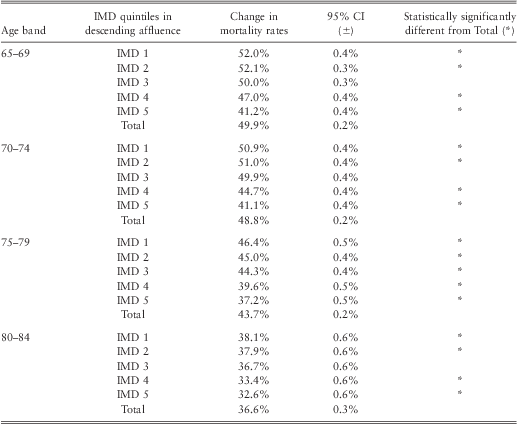
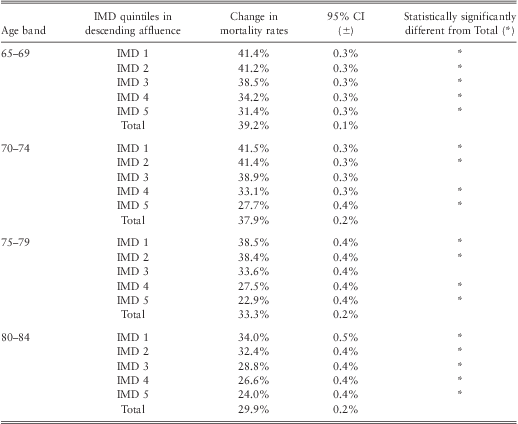
3.1.2. The results show that the change in mortality rates between 1982 and 2006 of males and females living in all IMD quintiles, except the middle quintile, are statistically significantly different from that of total population for all investigated age bands. This is shown in Tables 1 and 2 where the lack of overlap between 95% confidence intervals of 2 observations is interpreted to be statistically significantly different from each other.
Comparison of change in male mortality rates between IMD quintiles and Total Population, between 1982 and 2006 by age bands.

Comparison of change in female mortality rates between IMD quintiles and Total Population, between 1982 and 2006 by age bands.
3.1.3. Generally, the less deprived, younger and male categories have experienced greater change in mortality rates than their respective counterparts over the period 1982 and 2006. (Tables 1 and 2).
3.2. Cohort patterns of SEC illustrated by ‘heat maps’
3.2.1. A prominent demographic feature in the UK is the observation that people born between 1925 and 1945 have experienced faster mortality improvement than generations born before or after them. This feature is usually called cohort effect (CMI, 2002, 2009a, 2009b; Willets et al., Reference Willets, Gallop, Leandro, Lu, MacDonald, Miller, Richards, Robjohns, Ryan and Waters2004; Willets, Reference Willets2004; Jagger et al., Reference Jagger, Christensen and Murphy2009; Murphy, Reference Murphy2009). It has been effectively demonstrated by using colours to represent annual rates of mortality improvement of each age in individual year, with hotter colours (such as red rather than green) representing higher mortality improvement rates. The resulting charts with colours between perpendicular axes of age and calendar year are usually called ‘heat maps’ (CMI, 2002).
3.2.2. These heat maps reveal cohort effects as streaks of hot or cold colours running diagonally across the chart. Heat maps of England & Wales total population have been well documented (CMI, 2002). However analysis of cohort effects in various SEC has been limited.
3.2.3. Using this SEC dataset, we have plotted our estimates of annual rates of mortality improvement of England and different IMD quintiles (Figures 1–4). As shown in Figure 3 and 4, we can see streaks of warmer colours appearing diagonally across the heat maps, demonstrating cohort effects in IMD quintiles 1, 3 and 5 (males and females). The colours in the heat maps of the least deprived IMD of both genders are warmer than their less affluent counterparts, indicating higher annual rates of mortality improvement.
Annual rates of improvement in mortality for males and females. (England 1985–2005)
Annual rates of improvement in mortality for males and females. (England 1985–2005)
Annual rates of improvement in mortality for males (England 1985–2005). Comparison of IMD quintiles 1, 3 & 5
Annual rates of improvement in mortality for females (England 1985–2005). Comparison of IMD quintiles 1, 3 & 5
3.2.4. One may ask if analyses on the most deprived quintile are relevant to pension schemes or annuity portfolios, given that pension liabilities are concentrated on the more affluent. The composition of people in different SEC in pension schemes differs from scheme to scheme depending on industry and location. Individual pension scheme would be better placed to understand its own pension SEC representation. However, our experience shows that it is not uncommon to have about 20% of lives (15% pension amount) belonging to IMD quintile 5 for many pension schemes. This means that they are relevant to many pension schemes and potentially annuity providers.
3.3. Average annual rate of improvement in mortality
Figures 5 and 6 show the average annual rates of improvement in mortality of people within different SEC (ages 65 to 74 and 75 to 84). With some exceptions, the less deprived quintiles have experienced higher average rates of improvement in mortality for most of the investigatory period. The gap in annual improvement in mortality between different SEC have widened in recent years.
(Colour online) Average improvement in mortality over time (Males, ages 65–74 & 75–84, 1985–2005)
(Colour online) Average improvement in mortality over time (Females, ages 65–74 & 75–84, 1985–2005)
3.3.1. For both males and females, the gap between SECs in the average rate of improvement in mortality within the 5 years ending 2005 were, for the most part, greater than mortality improvement rates within the previous 10 to 20 years. For males, absolute differences between the least (IMD 1) and most deprived (IMD 5) quintiles were 1.26% for ages 65 to 74 and 1.56% for ages 75–84. For females, the absolute differences between IMD quintiles 1 and 5 were higher, ranging from 1.09% for ages 65–74 to 1.88% for ages 75–84.
3.3.2. After the late 1990s, IMD 5's average annual rates of mortality improvement appear to diverge from that of IMD 1 and 3. The reasons for this are unclear and more research would shed light on this observation.
3.3.3. Historical gaps in mortality improvements by IMD quintile (e.g., the least versus most deprived quintile) have not, however, been consistent. As crossovers in annual rates of mortality improvement (males and females) have occurred within the recent past, it highlights the prospect that it may be repeated in the future (with the rate of improvement for the most deprived quintiles possibly surpassing that of the least deprived).
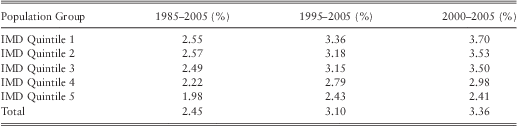
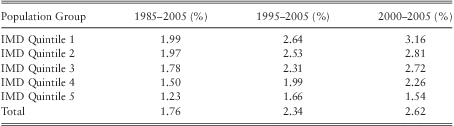
3.3.4. To illustrate changes over time, we examined the average annualised rates of mortality improvement (IMD quintiles 1 to 5 for ages 65 to 84) for males (Table 3) and females (Table 4) during the periods 1985–2005; 1995–2005 and 2000–2005. The average annualised rate of improvement in mortality in 5 years leading to 2005 is greater than that in 10 or 20 years ending 2005. (Tables 3 and 4).
Male Average Annualised Mortality Improvement Rates (Ages 65–84)
Female Average Annualised Mortality Improvement Rates (Ages 65–84)
3.3.5. Tables 5 (males) and 6 (females) illustrate differences in mortality improvement rates between IMD quintiles 1, 3 and 5 and total population. For males and females the gaps in the average rate of improvement in mortality between IMD quintiles in the 5 years ending 2005 were greater than those over the previous 10 or 20 years. We have considered factors that could affect the robustness of our results including modelling options and the potential “drift” across time of people across SEC groups.
Annual Mortality Improvement Rates: Average Difference between IMDs 1, 3, 5 and Total (Male, Ages 65–84)

Annual Mortality Improvement Rates: Average Difference between IMDs 1, 3, 5 and Total (Female, Ages 65–84)

3.3.5.1. To examine the impact of model changes to our findings, sensitivity tests were performed by applying: i) 1 year mortality rates; ii) alternative parameters (e.g., by varying the spacing of knots to 3 knots and 7 knots) to the P-Spline Age-Period method. The application of different model inputs or parameters did not alter our findings that: i) a gradient exists between IMD quintiles 1, 3 and 5 (least deprived showing the highest rate of mortality improvement); ii) more recent years showed a greater gap in mortality improvement between the least and most deprived than prior years. If these gaps were to continue, there would be financial consequences for valuation, pricing and hedging of longevity risks.
3.3.5.2. Implication of using a fixed IMD quintile over time and health selection. In our analysis we are not tracking a consistent group of lives, but a consistent group of small areas. We have classified small areas by a surrogate measure of socioeconomic status, area deprivation, and we fixed the allocation of LSOAs to deprivation quintile over the entire period of the analysis. It was important for us to assess the scale of movement between deprivation quintiles in order to assess the validity of our assumption that relative ranking by deprivation remains virtually unchanged over time. It would also be helpful to understand whether the results are affected by any tendency for selective (net) population migration with healthier people moving out from more deprived to less deprived areas and vice versa. Both large shifts in deprivation quintile allocation and selective population mobility have the potential to distort the conclusion of our analyses. Our test of deprivation stability (tracking wards across the 1981, 1991 and 2001 censuses) concludes that the majority of small areas in England have remained in their quintile group over the 25-year period of our analysis. Furthermore, although selective migration of healthy people to better-off areas is a factor, net migration would have some, but not a significant, impact on the analysis of trends in inequalities we report. For details, see Appendix D.
3.3.6. Our findings have raised questions over the potential drivers behind our key observations including:
i. greater reduction in mortality rates in the less deprived IMD quintiles over the period 1982 and 2006,
ii. more pronounced cohort patterns for annual rates of improvement in mortality and
iii. widening of differences in annual rates of improvement in mortality between people in different SECs.
We and other authors have discussed in some detail the forces behind health or mortality gaps between SECs and trends in these (Wanless et al., Reference Wanless, Pattison, McPherson, Haberman, Blakemore, Wong and Lu2012; Scholes et al., Reference Scholes, Bajekal, Love, Hawkins, Raine, O'Flaherty and Capewell2012; Bajekal et al., Reference Bajekal, Scholes, Love, Hawkins, O'Flaherty, Raine and Capewell2012; Bartley, Reference Bartley2004; Marmot Review, 2010). The powerful forces behind the differences in mortality rates between SECs would include differences in wealth, risky behaviours which impact on health, psycho-social factors, access to treatment, and the accumulation of health-disadvantage over the life-course . However, more research is required to understand their independent effects and interactions in influencing the trends that we have observed in this paper. We discuss some potential factors that could have contributed to historical trends and potentially influence the future.
3.3.6.1. Wealth/Income gap. Lower income would directly disadvantage people in terms of living conditions, access to health care, nutrition and other factors; leading to disadvantaged health conditions and higher mortality rates (Bartley, Reference Bartley2004). It could also indirectly lead to poorer health through its association with less desirable employment conditions; exposing them to work hazards, lack of control and stress. Since the 1980s, the income gap between the rich and poor has widened, with mean income of the wealthiest 10th rising from 3 times to 4 times that of the poorest tenth of the population (Wanless et al., Reference Wanless, Pattison, McPherson, Haberman, Blakemore, Wong and Lu2012). It is perhaps worth considering widening inequalities in wealth distribution contributed to the higher annual rates of improvement in mortality among the least deprived IMD quintile observed in this paper. With the recent economic crisis in 2008 and current unfavourable economic environment, it is unclear if the income gap would narrow or widen. However, it would be reasonable to expect that the income gap would continue, and hence continue to act as a force to differentiate mortality rates between the wealthier and poorer.
3.3.6.2. Risk factors. Scholes et al. (Reference Scholes, Bajekal, Love, Hawkins, Raine, O'Flaherty and Capewell2012) examined the trends of some key risk factors for cardiovascular diseases including prevalence of smoking, obesity, exercise, hypertension, cholesterol levels and diabetes of people in different IMD quintiles from the mid-1990s to 2008. They concluded that little progress has been made in reducing inequalities in these risk factors over this period: parallel changes in both positive and negative trends in risk factors were seen across SEC groups. If differential risk factor trends had contributed substantively to our finding of higher annual rates of mortality improvement in SEC Quintile 1 (least deprived), we would have expected inequality in risk factors to widen in favour of people in higher SEC. Their results don't show a widening in socio-economic inequality, hence trends of single risk factor don't appear to be able to explain the higher rates of mortality improvement in the least deprived IMD quintile. However, comparison of trends in the clustering of multiple lifestyle risks factors in individuals gave a different picture. People with no qualification were 3 times more likely than those with higher education to engage in all 4 lifestyle risks of smoking excessive alcohol use, poor diet and low physical activity levels in 2003 (Buck & Frosini, Reference Buck and Frosini2012). By 2008, people with no qualification were 5 times more likely than their counterparts with higher education to engage in those combined risks (Buck & Frosini, Reference Buck and Frosini2012). These authors suggest that people in higher socio-economic positions have experienced a greater reduction in the proportion who engage in multiple risky behaviours than those in lower positions over this period. It is plausible that the reduction in the clustering of risky behaviours in least deprived SEC (and, at the same time, the adoption of healthy behaviours) have had a synergistic effect in accelerating the fall in mortality rates in this group over the first decade of the 21st century (Bajekal et al., Reference Bajekal, Scholes, Love, Hawkins, O'Flaherty, Raine and Capewell2012). Considering the scope for future improvement, there is more potential for health gain amongst people in the most deprived quintile, for example males in the most deprived quintile were nearly 3 times more likely to be smokers or 1.5 times more likely to be diabetic during the 1982–2008 period (Scholes et al., Reference Scholes, Bajekal, Love, Hawkins, Raine, O'Flaherty and Capewell2012). So it is plausible that they could experience higher future mortality improvement rates, potentially closing the gap with that of people in less deprived IMD quintiles.
3.3.6.3. Access to health care. Bajekal et al. (Reference Bajekal, Scholes, Love, Hawkins, O'Flaherty, Raine and Capewell2012) studied the change in uptake rates of a range of surgical, drug and rehabilitation treatments for coronary heart disease between 2000 and 2007. The study concluded there is no evidence of systematic differences in uptake rates between deprivation quintiles in 2007. A study by Raine and colleagues similarly reported that the receipt of stroke prevention drugs did not vary by SEC, but by age (Raine Reference Raine, Wong, Ambler, Hardoon, Petersen, Morris, Bartley and Blane2009). However, for rectal, breast and lung cancer treatment, Raine et al. (Reference Raine, Wong, Scholes, Ashton, Obichere and Ambler2010) reported that patients in deprived areas were less likely to be given preferred surgical procedures.
3.3.6.3.1. These findings show that treatment access to some major killers (like heart disease) is relatively equitable between SEC groups owing to concerted action in the implementation of national guidelines and providing incentives for disease management within primary care (Bajekal et al., Reference Bajekal, Scholes, Love, Hawkins, O'Flaherty, Raine and Capewell2012). But for other disease groups where treatment protocols are less clear-cut or which have not been rolled-out nationally with the same vigour, it is likely that variations in timely access to care or the quality of care received could have contributed differences in mortality rates of people in different SEC. It is unclear if access to health care for different SEC has changed over time. Going forward, there is potential scope to improve health care for more deprived patients, for example by closing the disparity described by Raine et al. (Reference Raine, Wong, Scholes, Ashton, Obichere and Ambler2010), contributing to their annual rates of mortality improvement. In a scenario where health care is no longer free for all, patients in higher SEC may have greater access to health care due to affordability, leading to higher mortality improvement rates than those in lower SEC.
3.3.6.4. Behavioural and ‘cultural’ model (Bartley, Reference Bartley2004). Sociologists have proposed that differences in behaviours or culture between people in different SEC could potentially explain the differences in health between SEC. For example, healthy behaviours, such as exercise, may be encouraged by peers in higher SEC. Conversely some less healthy behaviour such as smoking may be more tolerable among peers in more deprived circumstances. These would imply that changes in behaviours and culture within IMD quintiles could potentially influence future rates of improvement in mortality.
3.3.6.5. Psycho-social model (Bartley, Reference Bartley2004). The psycho-social model proposes that people in occupations with a lower social status experience less control, autonomy, respect and reward at work. These negative experiences could induce stress and trigger hormonal actions in the body that results in depressed immunity which in turn leads to diseases. Establishing a causal link between SEC-related stresses to historical mortality improvement patterns would be challenging. But any changes in potential difference in psycho-social stress between SEC could change the pattern of future mortality improvement between people in different SEC.
3.3.6.6. Life-course model (Bartley, Reference Bartley2004). There is a view among social epidemiologists that health differences between SEC arise as the result of cumulative experience of lifetime advantageous or adverse social, biological and psychological circumstances. This approach would imply that the higher mortality risk of people in more deprived SEC is a result of embedded health disadvantages. The study of genetic material in people with different educational level has shown that having taken into account age, gender and other risk factors; people with lower educational level are associated with biological cells that have experienced more ageing and stress as marked by shorter leukocyte telomere length (Steptoe et al., Reference Steptoe, Hamer, Butcher, Lin, Brydon, Kivimäki, Blackburn and Erusalimsky2011). Bearing in mind that studies on relationship between telomere length and social factors would attract much future debate, this study potentially suggests that the health disadvantage of older cells is ‘embedded’ in people with lower education level.
3.3.6.6.1. It remains uncertain what contributes most to the differential health trajectories over the life course between the advantaged and deprived groups – childhood, adolescence or adult behaviours and circumstances – and the interactions between these. We also do not have estimates of the cumulative benefits associated with a lifetime of low-risk health behaviours, material and psycho-social circumstances. For example, the (longitudinal) Finnish Public Sector Study found that even in a sub-set of people who had never smoked, were not obese or physically inactive and who consumed moderate amounts of alcohol, a marked socioeconomic gradient in absolute risk of CHD mortality persisted. (Kivimäki Reference Kivimäki, Lawlor, Davey Smith, Kouvonen, Virtanen, Elovainio and Vahtera2007). Changes in experiences over the life-time of people in different SEC could change the pattern of improvement in mortality between SEC.
3.3.6.7. Government policies. During our investigation period (1982 and 2006), successive governments have tried to reduce inequality in health and mortality between people from different SEC, sometimes with high profile targets, but eventually without success (House of Commons Committee of Public Accounts, 2010). This highlights the challenge in reducing the health and mortality gap associated with SEC. Bartley (Reference Bartley2004) has considered various policy options targeting behaviours, wealth gap and psycho-social pressure, but successful implementation of these options remains to be studied. The Marmot Review (2010) suggests that any action taken to narrow a gap in mortality by SEC will require action across all social determinants of health including poverty, educational attainment, occupation types, etc. Taken together, it is unclear if there is a single pathway to narrow SEC health inequality. Potential success appears to require a concerted effort targeting many aspects of life, with intense and synchronised actions from different government departments. Without a co-ordinated strategy, it would be challenging to achieve the narrowing of SEC health inequality.
3.3.6.8. Adopting Healthcare Initiatives. A study of the BBC's mass media campaign, ‘Fighting Fat, Fighting Fit’ found that the more educated tend to remember the healthy lifestyle message (Wardle et al. Reference Wardle, Rapoport, Miles, Afuape and Duman2001). People in higher SEC groups have been reported to be more likely to participate in government's campaign for cancer screening (Weller et al. Reference Weller, Coleman, Robertson, Butler, Melia, Campbell, Parker, Patnick and Moss2007; Power et al. Reference Power, Miles, von Wagner, Robb and Wardle2009; Whynes et al. Reference Whynes, Mangham, Balfour and Scholefield2010; Cuthbertson et al. Reference Cuthbertson, Goyder and Poole2009). These suggest that people from less deprived SEC are more likely to respond to new health initiatives, wedging the health gap between SEC groups. This might have partly explained the higher mortality improvement rates among the more affluent in the past, for example the more affluent may have responded more quickly to anti-smoking messages. It remains to be seen if people in more deprived SEC are catching up, potentially fuelling future mortality improvement. Any effort in addressing this disparity in responding to health messages could change future mortality improvement trends between SEC.
3.4. Financial consequences
3.4.1. Basis risk – historical perspective
3.4.1.1. The pensions industry is attempting to develop a liquid market for longevity and mortality related risks. For instance, the objectives of the Life & Longevity Markets Association (LLMA) include the promotion of “liquidity in the trading of financial instruments that reference longevity and mortality related risks as well as consistency of relevant demographic data.”Footnote 1
Typically, the higher the liquidity of the market, the lower the cost of hedging. This would be especially beneficial for small to mid-size pension funds with limited risk management budgets. In a scenario where regulatory requirements were to increase substantially, all sizes of insurances and pension funds may need to transfer at least part of their longevity risk. This increased demand could be met by the capital market and its capacity to absorb risk. The capital market already absorbs a significant share of interest and inflation risk for the pensions industry; the same is possible for longevity risk.
3.4.1.2. Pension funds could benefit from longevity hedging if the financial market absorbs financial obligations when pensioners live longer than expected. It may be an efficient use of capital if insurers or re-insurers use longevity derivatives to manage longevity risks of existing or new annuity businesses.
Derivatives such as longevity swaps involve payments relating to the mortality of a reference population, such as England and Wales population, usually represented by a longevity index. For example, a pension fund or insurer may pay a pre-determined cash flow (fixed leg of the swap) to an investment bank or capital market investor in return for a cash flow that is determined by the longevity index derived from the general population mortality (floating leg of the swap). If mortality is lower than expected, the floating leg should cover the additional liabilities of the pension fund.
The number of survivors of the reference population could be used as index metric as the decreasing number of survivors corresponds to the decreasing amount of liabilities. If the pensions industry can agree on a common index as a market standard for measuring longevity risk, this would significantly promote liquidity. It would lead to competitive prices and in the medium-term possibly the development of a secondary market for longevity swaps.
Investors are already familiar with the concept of index-based products from other asset classes. Thus, if an index is used as underlying for longevity risk transfer, investors will be able to use it, even if they do not have an actuarial background. However, due to the long-term structure of longevity transactions, the majority of investors will only enter such a transaction if a secondary market exists where they can sell the position before maturity, which may often be more than 10 years in the future.
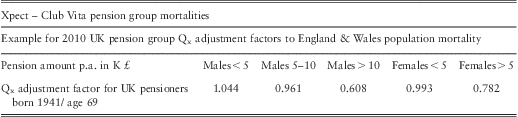
3.4.1.3. A longevity index based on population mortality is a reasonable longevity risk proxy, especially for the risk of large portfolios. The reference data is publicly available and regularly updated by the ONS and the data volume is sufficient to derive a meaningful mortality benchmark. However, there has been concern that pension funds are seeing mortality rates that differ from the reference population. In response to this, Deutsche Börse developed the socio-demographic Xpect – Club Vita Indices in addition to its already existing population indices (http://www.xpect-index.com/13-0--Longevity-Risk-.html). The Xpect – Club Vita Indices display the mortality of subgroups, based on their annual pension payments. Three significant groups were identified: pensioners with yearly pensions below £5,000, those with pensions between £5,000 and £10,000 and those with pensions above £10,000 (Table 7). For the index calculation, five-year cohorts are grouped, genders are separated and the survivors of the subgroup are computed on a monthly basis. The indices draw on Club Vita's analysis of five million pension member records covering men and women from over 140 UK schemes.
Xpect – Club Vita pension group mortalities.
It is clear that a single population index, rather than several SEC-related indices, stands a better chance of creating a larger and more liquid market because it could pool resources and investment. The need for mitigating basis risk with the help of sub population indices depends on the potential extent of financial implications (e.g. less liquidity and higher prices). If the market perceives that basis risk is manageable, then there would be less need for SEC-specific longevity indices. So, the debate on the merit of multiple sub-population longevity indices appear to balance on market confidence in managing basis risk and benefit of scale due to the pooling of investments.
3.4.1.4. It is a common practice for pension funds and annuity providers to use future mortality improvement assumption derived from the total population trends. This would represent basis risk if the pensioners belong to a certain SEC group exhibiting different annual rates of improvement in mortality from that of the population.
3.4.1.5. This dataset with mortality experience of different SEC offers us an opportunity to examine the potential extent of basis risk. To understand the potential extent of basis risk, we compare the present value of a hypothetical group of male pensioners’ liability using the historical improvement in mortality of the total population against that of the most or least affluent fifth of the population between 1982 and 2006.
3.4.1.6. This hypothetical pensioner population reflects the UK age structure for ages 60 to 84 in 1982, with an average age of 70. They all have the same nominal fixed pension. For this illustration, the pension payments will stop at age 84 to ensure that the analysis relies on the more robust SEC data between ages 60 and 84. The PMA80 life table, reflecting annuitants’ mortality rates in the early 80s, is used as the base mortality in 1982. Cash flows for these pensioners were projected then discounted at 3 or 5% p.a. Our results show that the liability associated with the mortality improvement of the total population is about 0.5% lower or higher than that of the most or least affluent fifth respectively (see Table 8).
Extent of basis risk based on historical data. Present value of liability of a nominal pension portfolio using the most or least affluent fifth's mortality trend assumption relative to that of total population between 1982–2006.

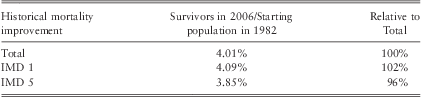
3.4.1.7. For this hypothetical population over the period 1982 and 2006, the number of people survived in 2006 relative to 1982 is 4.01%, 4.09% or 3.85% for assumptions associated with the total population, most affluent fifth or least affluent fifth respectively (Table 9). This implies that comparing to the change in mortality improvement of the total population, there would be about 2% more or 4% fewer survivors for the most and least affluent fifth populations respectively at the end of the period (Table 9). Decision makers would have to assess if they are willing to take on basis risks with this range of survivorship.
Survivorship in 2006 relative to starting population in 1982
3.4.1.8. Our assumptions above intentionally omit calculations above age 85. For information, the number of people above age 85 of people in the most extreme 2 SECs are within 1% from that of total population for most of the years between 1982 and 2006 (Appendix C).
3.4.1.9. Pensioners in most pension funds or insurers’ portfolio are likely to be a mix of different wealth levels. Their mortality trends would be closer to the total population's trend if compared to their counterparts in the extreme IMD quintiles. So, having a mix of pensioners in different IMD groups could dampen basis risk.
3.4.1.10. Our analysis of historical experience can help decision makers better understand basis risk. For example, the market could decide whether 0.5% of liability or −4 to 2% survivorship is an acceptable risk level. If not, they could find a way to price for it. If the market decides that basis risk is manageable, it may be advantageous in having a single index, rather than multiple SEC-based indices. With a single index, longevity derivatives could deliver scale and simplicity that could eventually lead to a liquid market. However, we note that history may not be a good guide to the future.
3.4.2. Basis risk – future perspective
3.4.2.1. As shown in section 3.3.6., the potential drivers for a mortality gap between SEC are subject to complex socio-medical factors interacting with each other under the influence of social policies. There is scope for the differences in mortality rates between SEC to narrow, widen, stay the same or experience a combination of different trends. Differences in annual rates of improvement in mortality between SEC would vary depending on the outcome of forces acting in different directions to narrow or widen differences in mortality rates between SEC. For illustration, we project future mortality improvement of England & Wales population using the CMI 2011 Model with long term rates of 1 or 2% p.a. The CMI Model is used because it is commonly used within the industry, hence it would be a reasonable common currency for illustration. However, it is worth-noting that choosing 1 and 2% long-term rates would dampen the effect of differences in initial rates of mortality improvement, especially when these long-term rates are lower than most initial mortality improvement rates
(www.longevitas.co.uk/site/informationmatrix/applyingthebrakes.html). Recognising that there are many plausible scenarios for the future, we consider 2 scenarios for simplicity:
3.4.2.2. Scenario 1: the difference in average mortality improvement between SEC groups and total population, observed in 5 years ending 2005, would continue perpetually. This would imply that the combined factors mentioned in section 3.3.6. would result in continued widening of the relative difference in mortality rates between SEC. For example, the widening income gap since the 1980s could have improved the health of aged 50 more among the rich than poor, all things being equal, resulting in higher mortality improvement among the wealthier population of age 80 in 2015 through the life-course process. In addition, an independent report suggests that the potential UK health care budget cut is likely to affect the more deprived areas more severely (Hastings et al. Reference Hastings, Gramley and Watkins2012). These would lend support to a scenario where the more affluent would continue to experience higher mortality improvement than the more deprived.
3.4.2.3. Scenario 2: the difference in average mortality improvement between SEC quintiles and the total population, observed in 5 years ending 2005, would be temporary. This means that the initial annual mortality improvement rates of the most affluent SEC groups would be higher than that of the total population. But the difference will reduce and eventually disappear over the convergence period between initial and long-term rates in the CMI model. This would imply that the combined factors mentioned in section 3.3.6 would narrow the relative difference in mortality rates between SEC. For example, actions to improve the risk factors profile and access to treatment of people in more deprived SEC would increase their mortality improvement rates. In this hypothetical scenario, to understand financial sensitivity, we assume the increase in annual rates of mortality improvement of people in more deprived SEC would eventually match that of people in less deprived SEC.
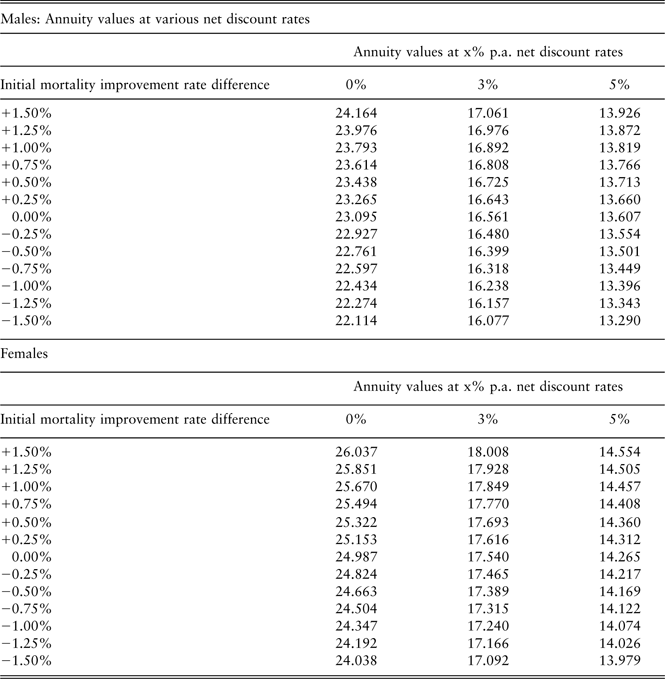
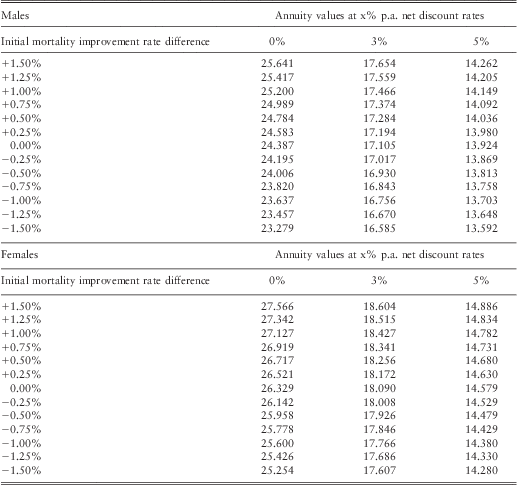
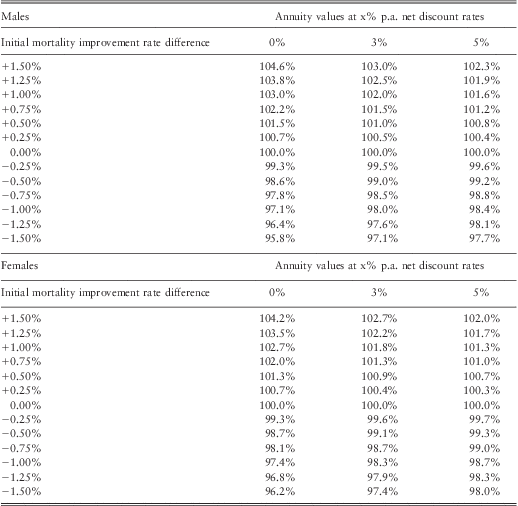
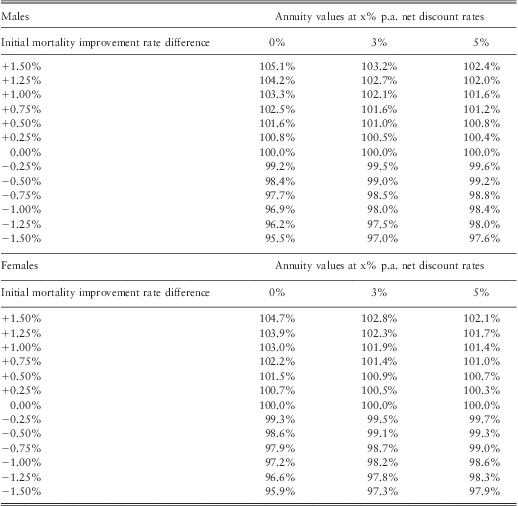
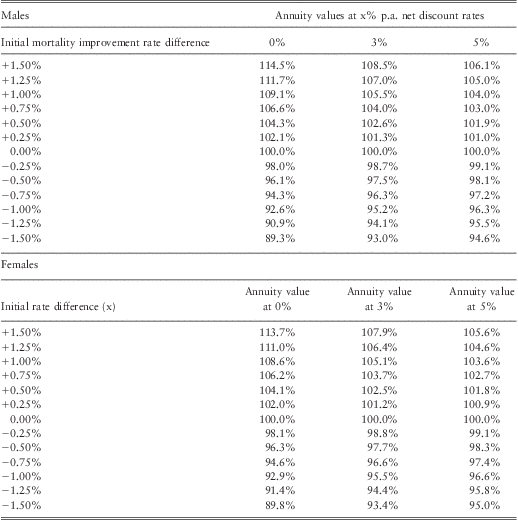
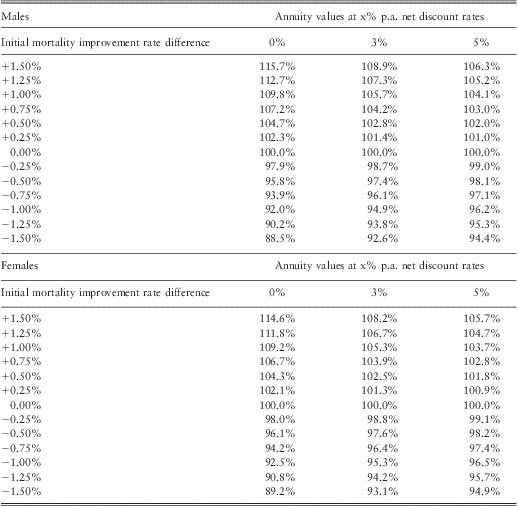
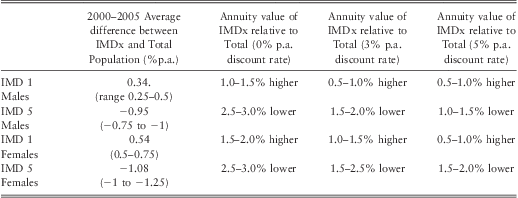
3.4.3. For males in the least deprived fifth of the population, the average difference in annual rates of improvement in mortality from that of the total population is 0.34% p.a. (Table 5), so we choose the range 0.25%–0.5% p.a. for financial illustration. As shown in Tables 10 and 11, this corresponds to annuity values that are about 1.0%–4.5% higher than that of the total population in Scenario 1 or 0.5%–1.5% higher for Scenario 2 depending on net discount rates. For males in the most deprived fifth of the population, the average difference in annual rates of improvement in mortality from that of the total population is −0.95% p.a. (Table 5). As shown in Tables 10 and 11, using −0.75% to −1.00% p.a. difference in initial mortality rates for financial illustration, this corresponds to annuity values that are about 3.0%–8.0% lower than that of the total population in Scenario 1 or 1.0%–3.0% lower for Scenario 2, depending on net discount rate. The results are not sensitive to using long-term improvement in mortality rates of either 1% or 2% p.a. (Appendices A and B).
Potential impact on annuity values for age 65 due to gap in initial mortality improvement in Scenarios 1 (gap continue perpetually), depending on net discount rates (0, 3 or 5% p.a.) rounded to 0.5%.

*Figures derived from Appendices A and B
Potential impact on annuity values for age 65 due to gap in initial mortality improvement in Scenarios 2 (gap eventually converges), depending on net discount rates (0, 3 or 5% p.a.) rounded to 0.5%.
*Figures derived from Appendices A and B
3.4.4. For females in the least deprived fifth of the population, the average difference in annual rates of improvement in mortality from that of the total population is 0.54% p.a. (Table 6), so we use the range 0.50%–0.75% p.a. for financial illustration. As shown in Tables 10 and 11, this corresponds to annuity values than are about 2.0%–6.5% higher than that of the total population in Scenario 1 or 0.5%–2.0% higher in Scenario 2 depending on net discount rates. For females in the most deprived fifth of the population, the average difference in annual rates of improvement in mortality from that of the total population is −1.08% p.a. (Table 6), so we choose the range −1.00% to −1.25% p.a. for financial illustration. This corresponds to annuity values that are about 3.5%–9.0% (Table 10) or 1.5%–3.0% (Table 11) lower than that of the total population in Scenario 1 or 2 respectively, depending on net discount rates.
3.4.5. These differences imply potential basis risk of using the total population's mortality improvement rates for individual SEC quintile. With up to about 9% liability value at stake based on our Scenarios (Tables 10 and 11), it may alert some market participants to desire a SEC-based longevity index or more advanced mortality projection methods that account for SEC. This risk would reduce if the pensioner population SEC composition reflects that in the population. Owners of longevity risks such as pension funds, insurers and investors would have to consider their risk appetite and tolerance for basis risk.
4. Conclusion
4.1. We have obtained England's death and population data between 1981 and 2007 split by gender, IMD quintiles and 5-year age-bands. Using 3-year moving average mortality rates of 5-year age bands, we have demonstrated statistical differences between change in mortality rates between total population and all IMD quintiles, except the middle quintile, over the period 1982 to 2006. Between 1982 and 2006, males have experienced greater fall in mortality rates than females within each IMD quintile and age-band.
4.2. Heat maps show cohort effects in all IMD quintiles. The heat maps of the least deprived IMD quintiles for both genders have warmer colours indicating higher rates of improvement in mortality. We observe that the average absolute differences in improvement in mortality rates between the most and least deprived IMD groups have widened between 1985 and 2005. This leads to uncertainty about the future projections for different SECs and basis risk.
4.3. We have examined the potential extent of basis risk using experience over the 1982–2006 period and using some potential future scenarios. These examples suggest that owners of longevity risks such as pension funds, insurers and investors would be able to assess their risk appetite and tolerance for basis risk using appropriate data and method.
Acknowledgements
We would like to thank the scrutineers and the following for their valuable comments and help. Any errors are the author's responsibility.
Douglas Anderson, Hyman Robertson LLP
Peter Banthorpe, RGA UK Services Limited
Steven Baxter, Hyman Robertson LLP
Andrew Coburn, Risk Management Solutions, Inc.
Eva-Maria Keller, Deutsche Börse
Chris Marchmont, Legal & General Group Plc.
Paul Norman, University of Leeds
John Palin, Risk Management Solutions, Inc.
Stephen Richards, Richards Consulting
Pretty Sagoo, Deutsche Bank
Richard Willets, Friends Life
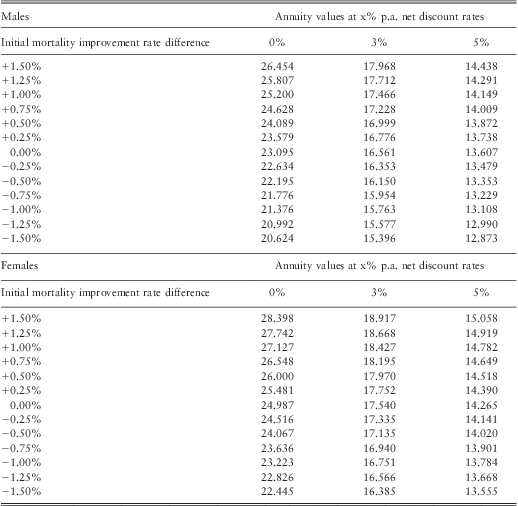
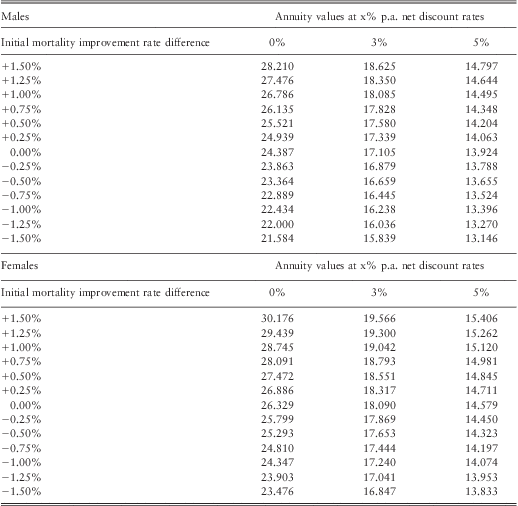
Appendix A
Annuity values
Model used to calculate figures: CMI_2011, no adjustment
Calculation date: 31 December 2012
Life tables used: PCXA00 (Base date 01/07/2000)
Initial rates of Improvement: In line with CMI_2011 up to 01/07/2008
Overall long term rate (combination of initial rate difference and long-term rate) = 1%
Overall long term rate (combination of initial rate difference and long-term rate) = 2%
Overall long term rate = 1% + Initial rate difference (x)
Overall long term rate = 2% + Initial rate difference (x)
Appendix B
Annuity values (Percentage)
Model used to calculate figures: CMI_2011, no adjustment
Calculation date: 31 December 2012
Life tables used: PCXA00 (Base date 01/07/2000)
Initial rates of Improvement: In line with CMI_2011 up to 01/07/2008
Overall long term rate (combination of initial rate difference and long-term rate) = 1%
Overall long term rate (combination of initial rate difference and long-term rate) = 2%
Overall long term rate = 1% + Initial rate difference (x)
Overall long term rate = 2% + Initial rate difference (x)
Appendix C
Number of Males aged 85 in Different IMD quintiles relative to Total
Appendix D
Implications of using a fixed IMD quintile allocation, 1981–2007
Background:
In this study we have used the composite score of the 2007 index of multiple deprivation (IMD) to categorise lower super output areas (LSOAs) into equal quintile groups of areas. The IMD is the government's current preferred indicator of deprivation in England. Its main strength is that unlike deprivation indices based on census data, the majority of the 38 indicators which underlie the composite score can be updated between the inter-censal period using routinely collected data. The IMD scores also provide a more granular and precise measure of local deprivation as they are based on LSOAs which, unlike electoral wards, are statistical units designed to contain roughly equal sized populations and capture similar ‘neighbourhoods’. Furthermore, because LSOAs boundaries remain fixed over time, the distortions caused by constant change in the geographical units of aggregation are eliminated. Hence, the index was designed so as to allow regularly updated IMD scores to be used to monitor the ‘real’ underlying trends in area inequalities.
The IMD series was first released in 2000 (at ward level). Subsequent updates in 2004, 2007 and 2010 were all produced at the LSOA level. The indices from 2004 onwards are highly inter-correlated; this was expected as they share a common methodology and use the same or similar datasets.
For the purpose of our analysis of mortality trends from 1982 to 2006, we used the IMD score closest to the end-point of our series – 2007 – to define our quintile groups with Q1 being the least deprived and Q5 the most deprived areas. The IMD quintile group membership of an area and its boundary remained fixed over the entire period of analysis, i.e. 1982–2006. This was partly for practical reasons - there was no equivalent composite score of multiple deprivation for LSOAs available prior to 2004 - and partly because the relative ranking of small areas in England is thought to have remained remarkably stable over long periods whatever measure of relative deprivation is used (Gregory, Reference Gregory2009).
Does area deprivation ranking remain stable over time?
However, we do know that over time some areas undergo ‘gentrification’ while others move down the deprivation ladder. Selective (net) population migration between quintile groups is also likely to have an impact on the average ‘healthiness’ or otherwise of areas. However, aggregated over a large number of similar LSOAs (c. 6,500) we would expect that the net effect of moves between quintile groups would have a minor impact. Hence, we tested our assumption of relative stability in quintile allocation across time and the potential scale of the ‘noise’.
We are not aware of any extensive work on IMD 2007 to address this issue. However, data and results using another system of measuring deprivation by geography, the Townsend index of deprivation can shed light on the relative stability in quintile allocation across time.
Dr Paul Norman at the University of Leeds has previously analysed change in deprivation levels between 1991 and 2001 censuses using the Townsend index of deprivation calculated at a common ward geography (Norman, Reference Norman2010). The aim of this analysis was to look at absolute change over the decade. We, on the other hand, were interested in the stability or otherwise of the relative ranking in quintile allocation of wards over time. We therefore requested Dr Norman to share with us the Townsend scores he had calculated using census data from three censuses – 1981, 1991 and 2001 – calculated on a common ward geography across all three time periods.
We normalised the deprivation score in each time period to the England average so that scores reflected the ward's relative ranking at each time point. Unlike LSOAs, because wards were of vastly unequal population sizes (larger in inner-city deprived areas), we calculated population-weighted quintile groups such that each quintile had roughly equal fifths of the population, not areas. On average, wards are about four times larger than LSOAs (2001: Wards n = 7,958, population, min = 557, max = 35,102, mean = 6,174; LSOAs n = 32,482; population min = 1,000 max = 6,537 mean = 1,513 persons).
Our analysis of change in the relative position of wards, as allocated to deprivation quintiles, was carried out using the Townsend deprivation scores for 1981, 1991 and 2001.
Results
Table D.1 shows the transition matrix of the percentages of the 1981 population as distributed into deprivation quintiles based on 1981 score ranking and 2001 score ranking. Table D.2 shows the equivalent quintile matrix for the transition between 1991 and 2001 rankings for 1991 population.
Transition matrix of % population distribution categorised into quintiles by 1981 and 2001 Townsend deprivation scores, England
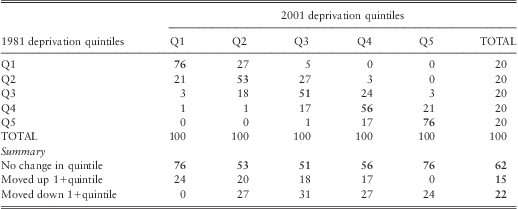
Transition matrix of % population distribution categorised into quintiles by 1991 and 2001 Townsend deprivation scores, England
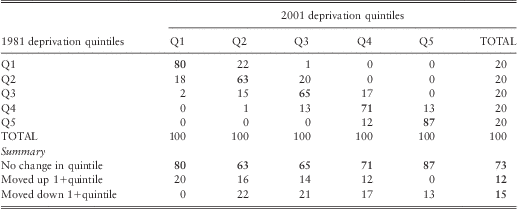
Table D.1 shows that just over three-quarters (76%) of the population in 1981 who were living in either in the least or the most deprived fifths of wards remained in their respective top/bottom quintiles in 2001 - i.e. their position relative to national deprivation level remained unchanged. As we might expect, there was more movement in the intermediate quintile groups (up and down). Hence, the population in wards that retained their deprivation group categorisation over these two decades (i.e. ‘on the diagonal’) was 62%. The remainder were fairly evenly split: 15% moved up one or more quintile groups (‘gentrification’), and 22% moved down the deprivation ladder.
The equivalent table for transitions between 1991 and 2001 is markedly more stable than that between 1981 and 2001 (Table D.2). Changes in the 1990s included a large reduction in non-home ownership as people took advantage of the ‘right-to-buy’ their council rented property (39.6% non-home ownership in 1981, 29.7% in 1991 and 28% in 2001). 80% of the 1991 population living in the most advantaged quintile and 87% of those in the most deprived retained their respective position. Overall, about three-quarters (73%) of England's population did not change quintile position between 1991 and 2001. Of the remainder, 12% of the population moved up one or more quintile groups, and 15% moved down the quintile grouping.
These results demonstrate that the top and bottom fifths of the deprivation distribution remained fairly stable over the two decades of the study, particularly so at the extreme ends of the distribution whereby in general non-deprived wards remain so as do deprived wards. However, as we might expect, the consistency of the match deteriorated over time.
It is therefore plausible to assume that the quintile match between LSOAs over the 25-year period would have been at least as stable as for wards, and possibly more so.
Selective migration and it impact on inequality trends
Numerous studies have shown that there is a consistent inverse relationship between health and deprivation: poorer areas have the worst health outcomes, with health improving as deprivation falls. This relationship is partly because areas are socially segregated (i.e. the area composition effect) and partly because of differences in the physical environment, resources and facilities between areas (or the contextual effects). However it should be borne in mind that not all socially disadvantaged people live in deprived areas, and vice-versa. But because area-based deprivation measures capture both the contextual and compositional aspects of deprivation, they may be a more reliable measure of socioeconomic inequalities than disadvantage measured between groups based on individual social position alone.
Recently, a number of studies examining the health-deprivation relationship have explored the possibility that at the least part of the explanation for the persistence of inequality relates to selective migration of healthy people to less deprived areas and for either sicker people to move to poorer area or the relative immobility of sicker people relative to healthy out-migration.
Norman et al used the closed population sample of the Longitudinal Study (LS) to examine the health effects of net internal migration between relatively deprived and affluent areas between 1971, 1981 and 1991 (Norman et al., Reference Norman, Boyle and Rees2005). To control for initial poor-health selection, those who reported being sick or disabled in 1971 were excluded from the analysis. In general they found that those who were downwardly mobile had poorer health than their origin group, but better health than their destination group. Conversely, those who went up the social ladder had health intermediate between their group of origin and the more advantaged group they joined. Those who remained in the top quintile across all censuses had the best health outcomes; and those who stayed in the bottom quintile had the worst health.
These findings would suggest that selective migration would tend to reduce the (cross-sectional) health gap between rich and poor areas. However the researchers found the opposite: selective mobility increased the health gap (Boyle and Norman, Reference Boyle and Norman2009).
The authors explored this apparent paradox further and showed that this was because of the distribution in the relative numbers of those who moved into an area, those who moved out and those who stayed put in the same quintile group. For example, in the most deprived quintile, mortality rates increase because those moving out of the quintile (largest group) had better health than those who moved into it (next biggest group) ; who in turn had better health than the ‘stayers’ (the smallest group). In contrast, in the least deprived quintile, the out-migrants were the largest group and had poorer health than both the new in-migrants and the stayers. The net effect of these moves therefore resulted in the widening of the mortality inequalities between the most and least deprived quintiles.
Is the impact of selective migration material to cross-sectional analysis of trends in inequalities in mortality? Norman and colleagues concluded that unlike health status measures such as limiting long-standing illness, the impact of mobility on mortality was not significant and that deprivation gradient will not be ‘exaggerated to a significant degree’ (Norman et al., Reference Norman, Boyle and Rees2005). Furthermore, the dominant flow is by relatively healthy people aged 20–59 moving away from more to less deprived areas, rather than the older age groups who are the focus of our research.
Over time, geographical patterns of inequality are maintained and often exaggerated. Where areas change their level of deprivation or where people's deprivation circumstances change, then there are likely to be concomitant changes in health. The majority of change (as with social mobility), is in the ‘middle ground’ rather than in the extremes. Wholesale change is rare.
In summary: the majority of small areas in England have remained in their quintile group over the 25-year period of our analysis. Furthermore, although selective migration of health people to better-off areas is a factor, net migrations would have some, but not a significant, impact on the analysis of trends in inequalities we report.