


INTRODUCTION
Estuarine systems are natural boundaries between marine and terrestrial systems and are often subjected to anthropogenic pressures such as pollution, urban and industrial development and modification of the shoreline, as well as to natural stressors. Natural and human influences can be assessed in estuaries by their benthic condition (Chainho et al., Reference Chainho, Chaves, Costa, Costa and Dauer2008).
Estuaries display a number of common features. For instance, the salinity gradient is correlated with sediment distribution (coarser sediments outside the estuary and finer in inner regions) and with changes in turbidity and dissolved gases (Elliot & McLusky, Reference Elliott and McLusky2002). The salinity gradient largely determines the distribution of macrobenthic assemblages in estuaries, along with the sediment characteristics and the depth of the vertical gradient (Ysebaert et al., Reference Ysebaert, Meire, Coosen and Essink1998, Reference Ysebaert, Herman, Meire, Craeymeersch, Verbeek and Heip2003). By turn, and among the macroinvertebrates, deposit-feeder polychaetes usually dominate the feeding guilds in estuarine assemblages (Mucha & Costa, Reference Mucha and Costa1999; García-Arberas & Rallo, Reference García-Arberas and Rallo2002).
The general features of estuaries are dependent on a number of factors. For example, the freshwater inflow determines the spatial and temporal distribution of macrobenthic species (e.g. Zajac & Whitlach, Reference Zajac and Whitlatch1982). Construction of dams and barriers diminish the freshwater inflow and the supply of nutrients and suspended particulate matter to estuaries (Cravo et al., Reference Cravo, Madureira, Felícia, Rita and Bebianno2006). On the other hand, droughts and floods events act as natural constraints, conditioning the dynamics of estuarine macrobenthic assemblages (Attrill et al., Reference Attrill, Rundle and Thomas1996) or populations of specific species (Matthews & Constable, Reference Matthews and Constable2004). These natural drivers may be recognizable even when anthropogenic stressors are present (Dolbeth et al., Reference Dolbeth, Cardoso, Ferreira, Verdelhos, Raffaelli and Pardal2007; Chainho et al., Reference Chainho, Chaves, Costa, Costa and Dauer2008).
A winter flooding occurred in the Guadiana estuary in February 2001. Winter 2000/2001 was unusually rainy in Portugal (according to the Portuguese Weather Institute), also causing floods in other Iberian estuaries (e.g. Teixeira et al., Reference Teixeira, Salas, Pardal and Marques2007). The flood attained a maximum inflow of 3300 m3 s−1, measured near the upper estuary (National Water Institute, INAG, http://snirh.inag.pt/). This river inflow represented a 20-fold increase in relation to the annual mean flow of 160 m3 s−1. The flow rate was slightly higher than the maximum of 2900 m3 s−1 recorded in the previous flood three years before. Between these two flood events there was a period of low fresh water supply to the estuary (Figure 1). The river inflow decreased considerably after the 2001 winter flooding, with low values registered in spring and summer 2001 (6.6 m3 s−1 in September: Chícharo et al., Reference Chícharo, Chícharo and Ben-Hamadou2006). Additional data on the physicochemical parameters in the Guadiana estuary after the flooding are available in literature (Ferreira et al., Reference Ferreira, Martins and Vale2003; Caetano et al., Reference Caetano, Vale and Falcão2006; Chícharo et al., Reference Chícharo, Chícharo and Ben-Hamadou2006; Garel et al., Reference Garel, Pinto, Santos and Ferreira2009). North Atlantic Oscillation (NAO) determines the rainfall regime in the Guadiana River (Dias et al., Reference Dias, Gonzalez and Ferreira2004). Negative oscillations in the NAO index are usually correlated to higher rainfall and floods in the Guadiana River basin (Dias et al., Reference Dias, Gonzalez and Ferreira2004).
Daily inflow of the River Guadiana, measured at the Pulo do Lobo hydrometric station from February 1998 to February 2001. The two highest peaks coincide with flood events in the Guadiana estuary.

The purpose of this study was to investigate the effects of the 2001 winter flooding on the macrobenthic assemblages in the Guadiana estuary. An approach to causality is made in a manner (Warren, Reference Warren2011) that allows separation of the two main factors that might explain the temporal evolution of our data: (1) due to seasonal changes; and (2) conditioned by a disturbance produced by the flood. While in the first case a transition in the temporal dynamic of the assemblages could be expected between seasons, a disruption in that transition marked by the flooding is hypothesized in the second case.
MATERIALS AND METHODS
Study area
The total length of the River Guadiana is approximately 810 km. Its catchment area is the fourth largest in the Iberian Peninsula (~67,500 km2). The river arises in Spain and reaches Portugal almost at the end of its length. The Guadiana estuary is approximately 70 km long with a maximum width of 800 m and mean depth of 6.5 m. The estuary is mesotidal, with mean tidal amplitude of 2 m (Chícharo et al., Reference Chícharo, Chícharo, Galvão, Barbosa, Marques, Andrade, Esteves, Miguel and Gouveia2001). It is partially mixed estuary with a typical maximal turbidity zone (MTZ; Garel et al., Reference Garel, Pinto, Santos and Ferreira2009) in which the concentration of suspended sediment is highest. The MTZ changes its position depending on the river inflow (Chícharo et al., Reference Chícharo, Chícharo, Galvão, Barbosa, Marques, Andrade, Esteves, Miguel and Gouveia2001; Garel et al., Reference Garel, Pinto, Santos and Ferreira2009). The estuary is surrounded by large unpopulated areas. Therefore, the anthropogenic pressure is low, except in the mouth of the estuary where urban settlements are located (Chícharo et al., Reference Chícharo, Chícharo, Galvão, Barbosa, Marques, Andrade, Esteves, Miguel and Gouveia2001).
Six sampling sites were considered in the study (Figure 2). Site B was the closest to the adjacent coastal area. Site D was located 5 km upstream from site B, close to the entrance of Castro Marim salt marsh. Site S_D was in the Castro Marim salt marsh, in a creek approximately 200 m from the salt marsh entrance. Site E and site F were located at approximately 8 km and 20 km, respectively, from the estuary mouth. Finally, site G was located about 30 km from the mouth, in the upper estuary (Figure 2). Midway between sites F and G approximately coincides with the most common location of the MTZ (Garel et al., Reference Garel, Pinto, Santos and Ferreira2009).
Map of the Guadiana estuary with the location of the sampling stations.

Sampling and laboratory procedures
The first sampling survey took place in October 2000, three months before the flooding. A second sampling survey was conducted three days after the flooding, in February 2001. Two additional sampling surveys were carried out after the flooding, in spring and summer, at the beginning of June and September 2001, respectively. Sampling was conducted during spring tides at the intertidal low tide limit. The sampling strategy was not modified because of the flooding.
Sampling for infaunal organisms was carried out with a corer with an inner radius of 11.4 cm (6 replicates = 0.241 m2 = 0.04 m2 replicate−1) inserted to a depth of 30 cm. All samples were sieved through a 1 mm mesh. The retained material was preserved in 70% ethanol. Benthic fauna were stained with rose Bengal and sorted under a dissecting microscope. The ash-free dry weight (AFDW) biomass of each replicated was estimated by drying the organisms at 105oC and ashing them for 6 h at 450oC.
All organisms were classified into four trophic groups in order to establish feeding guilds: suspension feeders (SF), deposit-feeders (DF, including surface and sub-surface-deposit feeders), carnivores or predators (P) and others (O). The last group included omnivores and species with more than one feeding strategy. With the exception of the group O, this trophic classification follows Chardy & Clavier (Reference Chardy and Clavier1988). Functional groups were classified in accordance with Ysebaert et al. (Reference Ysebaert, Meire, Coosen and Essink1998, Reference Ysebaert, Herman, Meire, Craeymeersch, Verbeek and Heip2003) and Macdonald et al. (Reference Macdonald, Burd, Macdonald and van Roodselaar2010). We also considered taxonomic groups in a similar way to Chardy & Clavier (Reference Chardy and Clavier1988): annelids, crustaceans, molluscs and others.
Statistical analysis and hypothesis
The temporal effects were analysed by a linear mixed-effects model (or linear mixed model, LMM) that includes fixed and random effects in the same design (Pinheiro & Bates, Reference Pinheiro and Bates2000). The time factor was considered a fixed effect and sites were treated as a random factor. The model applied to the response variable Y ij, had the following general form:
 $$Y{_{ij}} = {\rm \alpha} + {\rm \beta} \;{\rm Time}_i +a_j + b_j \;{\rm Time}_i + e_{ij}$$
where α and β represents the intercept and slope for the fixed factor ‘time’, respectively. The a j and b j terms represent the random intercept and slope that account for the random variation of each site. The random term e ij represents the residual value for each site and time. The subscript i and j are related to time and site levels respectively. It is assumed that the random terms follow a normal distribution with mean 0 and associated variance σa2, σb2 and σ2 for the random intercept, random slope and random error, respectively. The LMM (Pinheiro et al., Reference Pinheiro, Bates, DebRoy and Sarkar2009), was fitted by applying the steps outlined by Zuur et al. (Reference Zuur, Ieno, Walker, Saveliev and Smith2009), so that testing for the significance of the random terms before constructing a final model. At each step, the maximum likelihood or the restricted maximum likelihood estimation of the model was considered (Zuur et al., Reference Zuur, Ieno, Walker, Saveliev and Smith2009). The model was applied to the ecological parameters abundance, biomass, species richness, diversity (Shannon–Weaver index), number of annelid species, number of deposit-feeders species and number of predator species. When necessary, the response variables were transformed to conform to normality and in all cases the model residuals were visually inspected and tested by the Shapiro–Wilk normality test. Residuals for predator species did not satisfy the normality test but they were included because their visual inspection did not reveal any particular pattern.
The variance structure was adjusted for each site when necessary by VarIdent function of the nlme package (Pinheiro et al., Reference Pinheiro, Bates, DebRoy and Sarkar2009), in order to improve the distribution of residuals in the model. The LMM applied to biomass produced satisfactory residuals only after omitting the data from sampling station B. The Akaike information criterion (AIC) was used to measure the goodness of fit and the complexity of the model (Zuur et al., Reference Zuur, Ieno, Walker, Saveliev and Smith2009). Pairwise comparisons were carried out to detect any significant differences between the levels of the ‘time’ factor (Tukey adjusted), with the multcomp package (Hothorn et al., Reference Hothorn, Bretz and Westfall2009), which accepts LMM objects for post-hoc analysis. The values reported are means ± standard deviation (SD). The free statistical software R (R Development Core Team, 2009) was used for computations.
Non-parametric permutational multivariate analysis of variance (PERMANOVA) was applied to test for any changes in the macrobenthic assemblages caused by different composition or abundances of the species (Anderson, Reference Anderson2001) attributable to the factors ‘site’ and ‘time’. This analysis compares the variability within the assemblages with the variability among the different assemblages, under the null hypothesis of no differences between assemblages when considering the factors of interest. PERMANOVA is based in the permutation of the sampling units to obtain a probability associated with the null hypothesis. In the simplest cases, this probability is constructed by comparing a pseudo-F ratio that accounts for the distance among groups (numerator) and the distance within groups (denominator) against the pseudo-F ratio produced after n appropriate permutations of the sampling units under the null hypothesis (Anderson, Reference Anderson2001). We considered ‘time’ as a fixed factor and ‘site’ as a random factor in a similar way to the LMM approach. For this design, permutations are carried out as explained by Anderson & ter Braak (Reference Anderson and ter Braak2003), to obtain a valid result with a satisfactory power. Basically the permutation is done within the levels of the random factor, and the significance of the fixed factor is calculated by the use of the mean squares of the interaction term. If any significant differences between assemblages are detected, the program also enables post-hoc analysis based on a permutational test uncorrected for multiple testing (Anderson, Reference Anderson2001).
Grouping of sites over space and time in accordance with their similarity in species composition was carried out by cluster analysis (Legendre & Legendre, Reference Legendre and Legendre1998). The Euclidean distance was used after prior transformation of the raw data (Hellinger transformation, as explained in Legendre & Gallagher, Reference Legendre and Gallagher2001) in order to overcome the difference in the numbers of individuals between sampling stations over time and space. Objective criteria were applied to compute an interpretable cluster result in an R environment, a method that enables measurement of the intensity of the linkage of the objects in the different number of branches of a cluster, so that the computation identifies the optimal, most coherent subgroups in which the cluster can be split by using the function silhouette (Borcard et al., Reference Borcard, Gillet and Legendre2011). The complete linkage agglomerative clustering was used because it converged on the result with the Ward's hierarchical clustering (with the largest silhouette width = 0.27) and is also appropriate for detecting discontinuities in the data (Borcard et al., Reference Borcard, Gillet and Legendre2011).
A non-metric multidimensional scaling (nMDS) was applied on site centroids over time after carrying out a dissimilarity matrix based on the Euclidean distance of the Hellinger-transformed raw data. The nMDS method is an ordination technique that displays the distance between the considered objects in accordance with a previously computed dissimilarity matrix (e.g. Legendre & Legendre, Reference Legendre and Legendre1998). The nMDS enables visualization of any pattern among the considered objects, and in this sense it assists in the interpretation of the PERMANOVA (Anderson, Reference Anderson2001).
We considered the following null hypotheses:
1. There are no differences between times of sampling in relation to the ecological parameters and the composition and abundance of the assemblages.
2. There is no interaction between the factors ‘time’ and ‘site’.
RESULTS
Ecological parameters and multivariate results
The mean number of individuals varied considerably among sites (Figure 3). Acute differences in density were observed over time (Table 1; Appendix). Post-hoc comparisons revealed significant seasonal differences in abundance (Tables 1 & 2). The total biomass recorded during the study was of 77.6 g, mainly due to the bivalve Scrobicularia plana (da Costa, 1778) (70.53% of the total biomass). A shift in biomass became apparent along time (Figure 3; Table 1), attributable to the disappearance of adults specimens of the bivalve Cerastoderma edule (Linnaeus, 1758) at sampling station B. The mean number of species observed at each site was higher in summer than in autumn, with the only exception of site B (species richness: Figure 3). During the winter flooding a number of species that had been observed in the autumn disappeared from the assemblages, mainly at sites B, D and S_D (Table 1; Figure 3). The opposite trend was observed at the remaining sites (E, F and G), with a gain in species richness. The value of the Shannon–Weaver diversity index was lower in the winter. However, its overall value recovered and surpassed the values observed in the autumn (Table 1) after the flooding. A large loss of diversity occurred at site B between autumn and winter (Figure 3) from 3.48 ± 0.17 to 0.62 ± 0.23. The observed proportion of annelids (mainly polychaetes) was more than half of the remaining species at all sites after the winter, except at site F (Figure 4). The number of annelid species prevailed over the remaining taxonomic groups after the flooding, in a trend that became greater over time (Table 1). The distributions of the deposit-feeding species across the sites and throughout the study period are also shown in Figure 4. These species generally dominated the feeding guilds in the estuary and increased in proportion after the autumn at all sampling stations over time (except at site G). The mean number of predator species was higher in the autumn than during the flooding, when minimal levels were reached (Table 1). Predator richness tended to recover gradually after the winter, reaching 1.42 ± 0.72 species per replicate in the summer. It is worth noting that the random term b j Timei for these entire LMMs (see above) was significant at a probability <0.05, indicating an interaction between the factors (for details, Zuur et al., Reference Zuur, Ieno, Walker, Saveliev and Smith2009) time and site.
Mean values (±SD) for the ecological parameters abundance, biomass, species richness and diversity at each site and each season (Aut, autumn; Win, winter; Spr, spring; Sum, summer). The flooding event occurred during the winter.

Mean (± SD) proportion of the number of species for both annelids and deposit-feeders by site and season (Aut, autumn; Win, winter; Spr, spring; Sum, summer).

Mean values (±SD) for abundance (ind 0.04 m−2), biomass (g 0.04 m−2), species richness, diversity, number of species of annelids, deposit-feeders and predator (per 0.04 m−2) by season.

Summary of the linear mixed model (LMM) applied to the response variables. Data transformation, Akaike information criterion (AIC), F ratio, P-value (P) and temporal differences 1, 2, 3, 4 (numbers indicating autumn, winter, spring and summer, respectively) are shown. P < 0.05*, P < 0.01**, P < 0.001***.
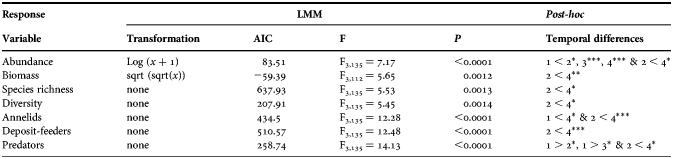
The effect of the flooding was systematic on the ecological parameters under investigation. As a binomial probabilistic approach, consider the chance of existing a difference between seasons 0.5 (equaling the chance of no differences) and the probability of that difference occur between the winter and the summer (one of six possible combinations) be 0.17 (1/6). Under these circumstances, the joint probability of an ecological parameter differs between a particular combination of two seasons is the multiplication of two independent events (0.5 × 0.17) that equals 0.0425. If this probability is considered a success in a binomial distribution, the likelihood of observing seven such successes (Table 2), is 2.5 × 10⁻¹⁰ (=0.04257). This extreme common pattern on all of the ecological parameters under study must be a general response to a conspicuous environmental pressure.
The analysis of the composition of the assemblages using PERMANOVA over 4900 permutations, revealed a significant multivariate interaction between the factors ‘time’ and ‘site’ (F15,120 = 11.39, P = 0.0002), and a highly significant difference among sites (F5,120 = 35.45, P = 0.0002), which is more acute than the difference detected in the assemblages over time (F3,15 = 1.72, P = 0.0058). Post-hoc analyses were conducted among levels of the time factor for each level of the site factor because of the significant interaction between them. The tests revealed that the assemblages were different at different times at every sampling station, with a probability of at least of 0.014; there were only two exceptions between autumn and summer (t = 1.35, P = 0.119) and between winter and summer (t = 1.46, P = 0.067) at site F. The results of the nMDS analysis applied to the sites at every sampling time (Figure 5) are consistent with those of the overall test carried out by the PERMANOVA. Sites are separated along the horizontal axis, in accordance with a longitudinal gradient (salinity). In turn, the vertical axis appears to be related to the temporal changes in the assemblages at each site. The interaction between the factors ‘time’ and ‘site’ is visually evident, as was the case for site D during the autumn or for sites E and F in the spring (Figure 5).
Non-metric MDS plot of the observed macrobenthic assemblages at each site. The three main groups identified by cluster analysis are separated by diagonal lines. Each group of letters indicate sites (B, D, S_D, E, F, G) and sampling time (1, autumn; 2, winter; 3, spring; 4, summer).

Temporal changes of the assemblages
The gastropod Bittium reticulatum (da Costa, 1778) was one order of magnitude more abundant at site B during and after the winter than in the autumn (15 ± 21 ind 0.04 m−2) while the polychaete Diopatra neapolitana Delle Chiaje, 1841, decreased in number over time to almost half the population density observed before the winter (2 ± 0.89 ind 0.04 m−2). Both of these species and the polychaete Heteromastus filiformis (Claparède, 1864) occurred at site B in all sampling occasions. This site was also characterized by some filter-feeder in the autumn, amongst which Cerastoderma edule was the most abundant. It occurred again in the summer (Figure 6), although as newly recruited individuals. The central part of the estuary (the cluster of stations in the middle of Figure 5) was dominated by a number of species that thrived after the flooding, as was the case of the bivalve Scrobicularia plana, the polychaete Hediste diversicolor (O.F. Müller, 1776) and the isopod Cyathura carinata (Krøyer, 1847), all with a maximum density in the summer (Figure 6). The latter two species were present at all sites in all seasons, except at sites B and G, respectively (see Appendix). Some other species became predominant in the central part of the estuary and widened their distribution range. Such was the case for the tubificid (Oligochaeta) and the polychaetes Streblospio shrubsolii (Buchanan, 1890), Alkmaria romijni Horst, 1919, Heteromastus filiformis and Capitella capitata (Fabricius, 1780), all of which reached a maximum density in the summer, except A. romijni (Figure 6). Some of the species observed in the central part of the estuary extended to the upper reaches. However, the only species that dominated site G in terms of abundance (with a maximum of 54.33 ± 36.11 ind 0.04m−2, in summer) was the amphipod Corophium orientale Schellenberg, 1928, that occurred here in all seasons.
Mean values (±SD) of the most abundant species by site and season (Aut, autumn; Win, winter; Spr, spring; Sum, summer).

DISCUSSION
The macrobenthic assemblages responded to the disturbance brought by the 2001 winter flooding in the Guadiana estuary. A number of significant changes in abundance and composition of the macrobenthic assemblages were recorded during and after the flooding. The overall trend was temporally attributable to the flood because of a systematic difference in all the univariate ecological parameters under study, significant changes in the abundance and composition of the macrobenthic assemblages after the flooding and a strong interaction between the factors time and site.
It is known that floods may cause the increase of opportunist deposit-feeder polychaetes (Salen-Picard & Arlhac, Reference Salen-Picard and Arlhac2002; Salen-Picard et al., Reference Salen-Picard, Arlhac and Alliot2003). In turn, deposit-feeders and polychaetes are usually observed as the most common taxa and feeding guilds in estuaries (Ysebaert et al., Reference Ysebaert, Meire, Coosen and Essink1998; Mucha & Costa, Reference Mucha and Costa1999; García-Arberas & Rallo, Reference García-Arberas and Rallo2002; Ysebaert et al., Reference Ysebaert, Herman, Meire, Craeymeersch, Verbeek and Heip2003). Indeed, deposit-feeder polychaetes and oligochaetes individuals are among the characteristic species of the Scrobicularia plana–Cerastoderma edule community, commonly observed in Iberian estuaries (MuxiKa et al., Reference Muxika, Borja and Bald2007). This community may be observed under different river freshwater discharges and seasons, even after floods, although the structure of the community in terms of species dominance may be significantly different over time (Chainho et al., Reference Chainho, Costa, Chaves, Lane, Dauer and Costa2006; Silva et al., Reference Silva, Costa, Almeida and Costa2006; this study). Moreover, Silva et al. (Reference Silva, Costa, Almeida and Costa2006) reported that abundance may fluctuate significantly on a seasonal and inter-annual basis, although clear aggregations between winter/spring and summer/autumn may be established, in agreement with other studies (e.g. Alden et al., Reference Alden, Weisberg, Ranasinghe and Dauer1997). Sharp differences such as those observed in this study would not normally be found under a regular seasonal cycle. As such, Ysebaert et al. (Reference Ysebaert, Herman, Meire, Craeymeersch, Verbeek and Heip2003), reported a mean number of species per sample, mean total abundance and mean total biomass significantly higher in autumn than in spring, plus negligible seasonal differences (accounted as variance by multivariate techniques) for the intertidal macroinvertebrate assemblages of the Schelde estuary. Accordantly, Edgar & Barrett (Reference Edgar and Barrett2002), described a much lower seasonal and interannual variance in comparison to spatial variance in Tasmanian estuaries. The last authors also stressed that temporal differences are more acute in abundance than in biomass, the latter rarely doubling throughout the year. However, we found clear differences in the structure of the assemblages between the autumn and the summer, a higher mean number of species, total abundance and total biomass in spring rather than in autumn, and a fluctuation in biomass that was as much as four-fold higher between the winter and the summer (Table 1). These results clearly suggest that the study site in the Guadiana estuary did not reflect a regular seasonal trend in the dynamics and structure of the macrobenthic assemblages. In essence, many species observed during the winter were still present after the flooding, increasing progressively in abundance until the summer (Figure 6).
Regarding the time of the flooding in the Guadiana estuary, it must be taken into consideration that: (1) a number of species may disappear on a short term basis (Norkko et al., Reference Norkko, Thrush, Hewitt, Cummings, Norkko, Ellis, Funnell, Schultz and MacDonald2002; Chainho et al., Reference Chainho, Costa, Chaves, Lane, Dauer and Costa2006) as a result of the physical stress imposed by a highly-abrasive freshwater run-off or due to their low osmotic tolerance; and (2) the overall estuarine abundance of intertidal macroinvertebrates was significantly lower in the autumn than in winter (Table 2), indicating that the resilient species were well adapted to the flooding. The latter applied mainly to the polychaetes Streblospio shrubsolii and Alkmaria romijni and the amphipods Leptocheirus pilosus Zaddach, 1844 and Corophium orientale. In addition, the tubificid oligochaetes, juvenile individuals of the bivalve Cerastoderma edule and the polychaetes Heteromastus filiformis, Capitella capitata and Polydora ligni Webster, 1879, also widen their distribution and density in the spring and the summer.
All of these tolerant species that are indicative of organic enrichment (Borja et al., Reference Borja, Franco and Pérez2000) extended their distribution to the lower and upper estuary. Sediments were organically enriched by suspended particles deposited after the flooding (Ferreira et al., Reference Ferreira, Martins and Vale2003) attaining values of 2.1 ± 0.4% in organic carbon content in the upper estuary (Caetano et al., Reference Caetano, Vale and Falcão2006), where flushing increases with higher river flow. The enrichment of the sediments with organic matter explains the significant proliferation of deposit-feeders (Salen-Picard & Arlhac, Reference Salen-Picard and Arlhac2002; Salen-Picard et al., Reference Salen-Picard, Arlhac and Alliot2003; Bolam et al., Reference Bolam, Whomersley and Schratzberger2004; Lu & Wu, Reference Lu and Wu2007). Moreover, dissolved oxygen varied from 5.6 to 10.7 mg l−1, suggesting no anoxic events between January and October 2001 (Caetano et al., Reference Caetano, Vale and Falcão2006). High water temperatures in the spring and the summer after the flooding (higher than 20oC since May 2001: Chícharo et al., Reference Chícharo, Chícharo and Ben-Hamadou2006) provided favourable conditions for the proliferation of opportunistic species in high numbers (Zajac & Whitlatch, Reference Zajac and Whitlatch1982; Levinton & Kelaher, Reference Levinton and Kelaher2004; Figure 6). Also, accordingly, Lu & Wu (Reference Lu and Wu2007) found a direct relationship between the warm seasons and the abundance and number of species observed in organically enriched sediments in sub-tropical waters. The decline in the number of predators during and after the flooding contributes to explaining the subsequent overall increase in abundance and biomass in the estuary (Beukema et al., Reference Beukema, Essink and Dekker2000).
The present study shows an overall improvement in the ecological condition of the estuary after the flooding (except at site B, under marine influence), particularly considering the ecological parameters of abundance, biomass, species richness and diversity. The values of the ecological parameters decreased in winter (except abundance) and recovered or surpassed their autumn values in spring or summer. Thus, as a general trend, a disruption in the ecological parameters occurred at the time of the flooding. The higher values were recorded in the summer in all cases except for the mean number of predator species (Table 1). A number of species well adapted to the estuarine habitat were reduced to localized populations before the flooding, possibly reflecting a depressed heterotrophic food chain. After the flooding, these species dominated the macrobenthic assemblages in terms of abundance and biomass. An autotrophic marine assemblage near the mouth of the estuary occurred with better ecological indices before the flooding. The proliferation of a heterotrophic community, in addition to its seaward dislodgment and the decline of the marine assemblages after the flooding, shows how the same flooding has converse effects on macrobenthic assemblages located in different parts of the estuary. This bidirectional response is an important finding because it describes an alternative response of the estuarine intertidal macrobenthic assemblages to a flooding, rather than a unidirectional response, such as catastrophic (e.g. Norkko et al., Reference Norkko, Thrush, Hewitt, Cummings, Norkko, Ellis, Funnell, Schultz and MacDonald2002) or negative responses (e.g. Cardoso et al., Reference Cardoso, Raffaelli and Pardal2008).
The findings of the present study are partly in agreement with those obtained for the Mondego estuary after the flooding in the winter 2000/2001. While in both cases there were significant effects on the structure of the intertidal macroinvertebrate assemblages after the flooding, the post-flooding effects in the Mondego estuary showed a negative overall trend (Cardoso et al., Reference Cardoso, Raffaelli and Pardal2008; Grilo et al., Reference Grilo, Cardoso, Dolbeth, Bordalo and Pardal2011). This pattern was only observed in the marine-influenced assemblages in this study. As such, the decline in total biomass, species richness and suspension feeders in the Mondego estuary after the flooding (Cardoso et al., Reference Cardoso, Raffaelli and Pardal2008; Grilo et al., Reference Grilo, Cardoso, Dolbeth, Bordalo and Pardal2011) fully resembles the tendency observed in site B in the Guadiana estuary. In turn, the improvement of the ecological parameters that occurred in most of the sampling sites after the flooding was similar to the observations of Sivadas et al. (Reference Sivadas, Ingole and Nanaikar2011) in an Indian tropical estuary after the monsoon season. These authors found an increase in abundance, biomass and species richness after the monsoon. Bachelet et al. (Reference Bachelet, de Montaudouin, Auby and Labourg2000) showed that seasonal trends in abundance and biomass of macrobenthic assemblages are not so sharp when there are not seasonal disturbances. Moreover, intertidal macrofauna is expected to peak in spring and decline in summer at temperate latitudes (Levin, Reference Levin1984; Sarda et al., Reference Sarda, Foreman and Valiela1995).
This study showed that flooding may cause a beneficial response in some compartments of the ecosystem. The effect of floods on the macrobenthic assemblages is likely determined by the nature of the disturbance event that is reflected in the magnitude of the response (Bengtsson, Reference Bengtsson2002). Therefore, it is possible that future data will describe an overall positive response of the estuarine intertidal macrobenthic assemblages after a flooding of low or moderate intensity, in contrast to the negative effects usually expected for these environmental events. Our data may be useful for dam management purposes, especially when the release of water from a dam facility becomes imperative.
ACKNOWLEDGEMENTS
We are grateful to Dr Manuel Aira for his advice in statistics. We are also indebted to Cristina Pita for field and laboratory assistance.
FINANCIAL SUPPORT
The research was funded by the project: ‘Study of environmental conditions in the Guadiana estuary and adjacent coastal area’ — LNEC (subcontractor CCMAR). The first author was also funded (SFRH/BD/48928/2008) by the Portuguese Foundation for Science and Technology.
Synthesis of the recorded species reported as maximum density (ind 0.04 m−2) for every site indicating their taxa (Ann, annelids; Cru, Crustaceans; Mol, Molluscs; Oth, Other), functional group (FG; D, Deposit-feeders; F, Filter-feeders; P, Predators; O, Others), time of occurrence (1, autumn; 2, winter; 3, spring; 4, summer; time of maximum abundance in italics) and their total abundance (Totals). The sites where any species was observed at all sampling times are in bold.



