Implications
Measurement of maintenance energy requirements in cattle uses estimates of fasting heat production made during the third and 4th day of fasting, when a respiratory quotient has fallen to ~0.7. However, this approach can cause stress and produces a severe energy deficit caused by the extended fasting period required. As an alternative to traditional fasting methodologies, a washed rumen technique indicates that heat production no longer reflects the continuing metabolism of the diet and a respiratory quotient decreases to 0.7, minimizing the time required as opposed to traditional fasting methodologies, without causing a severe energy deficit and stress.
Introduction
Fasting metabolism in cattle is normally measured on day 3 or 4 of starvation, when the respiratory quotient (RQ) has fallen to ~0.7 (Blaxter, Reference Blaxter1967). However, results are varied in relation to the length (days) of fasting, as average daily RQ values decrease with longer periods of fasting (Blaxter and Wainman, Reference Blaxter and Wainman1966). These authors reported mean RQ values on the 1st, 2nd, 3rd and 4th days of fasting were 0.82, 0.77, 0.73 and 0.70 in 100 to 200 kg steers, 0.88, 0.75, 0.72 and 0.72 in 200 to 300 kg steers, and 0.96, 0.82, 0.79 and 0.73 in 300 to 400 kg steers, respectively. This approach can give widely different results depending on day of measurement and indicates that at least 4 days or more are needed for accurate estimates of fasting metabolism.
A previous experiment was conducted to evaluate the use of a washed rumen technique for the rapid measurement of fasting heat production (HP) and RQ compared with traditional fasting methodologies (Kim et al., Reference Kim, McLeod, Klotz, Koontz, Foote and Harmon2013). The optimal time for measurement of fasting HP (when RQ approached 0.7) was ~8 h after emptying and washing the rumen. These results suggested that the washed rumen technique provides a more rapid means to predict the energy required for maintenance in cattle. However, because fasting HP and RQ are primarily related to energy intake (Lomax and Baird, Reference Lomax and Baird1983; Lobley et al., Reference Lobley, Connell and Buchan1987), further study is needed to determine how fasting metabolic rate induced by different intakes before using the washed rumen technique affects values obtained for fasting HP. Thus, an objective was proposed to investigate how different energy intakes before fasting affect fasting HP and RQ values measured using the washed rumen technique.
Material and methods
All experimental procedures involving animals were approved by the University of Kentucky Institutional Animal Care and Use Committee.
Animal feeding and management
Six Holstein steers (360±22 kg) each surgically fitted with a ruminal cannula (Bar Diamond Inc., Parma, ID, USA) were used. The steers were housed individually in 2.4×2.4 m pens during the 19 days intake adaptation periods in an environmentally controlled room (21°C) with 16-h light and 8-h dark cycles. Steers were offered free access to water and were fed alfalfa cubes (composition on % dry matter (DM) basis: CP=16.5; ADF=37.2; NDF=51.9; NEm=5.19 MJ/kg) top dressed with a mineral pre-mix (Kentucky Nutrition Service, Lawrenceburg, KY, USA; NaCl=92%; Zn=5500 mg/kg; Fe=9275 mg/kg; Mn=4790 mg/kg; Cu=1835 mg/kg; I=115 mg/kg; Se=18 mg/kg; Co=65 mg/kg) once daily (0700 h) at 1.0, 1.5 and 2.0×NEm (NRC, 2000) based on BW.
Experimental procedure and measurement
Treatments
Six steers were blocked into two groups based on BW and randomly allocated to three treatments within a replicated 3×3 Latin square design experiment with 21-day periods. Steers were fed alfalfa cubes to provide 1.0, 1.5 and 2.0×NEm during the initial 19 days of each experimental period. For gas exchange measurement, steers were placed in individual metabolism stalls fitted with indirect calorimetry head-boxes on day 20 of each experimental period. Steers were fed their normal ration and respiratory gases (O2, CO2 and CH4) were measured for 24 h following the 0700 h feeding (FED steers). This was followed by measurement of respiratory gases at fasting on day 21 (steers were not fed) of each experimental period (WASHED steers=fasting). The contents of the reticulorumen were removed using a wet/dry vacuum, followed by rinsing with 10 l of tap water (39°C) and further rinsed again three times with 10 l of saline (39°C). Ruminal buffer (NaCl=96; NaHCO3=24; KHCO3=30; K2HPO4=2; CaCl2=1.5; MgCl2=1.5 mmol/kg of buffer) was aerated with a mixture of 75% N2 and 25% CO2 before incubation in the rumen (Kristensen and Harmon, Reference Kristensen and Harmon2004). The ruminal buffer (15 kg) was placed in the rumen after completion of the washing, which was completed within 30 min. Collection of respiratory gases began after adding buffer. The contents from the reticulorumen were stored in a plastic barrel covered with straw and warmed (39°C) until reintroduction into the rumen at the end of the gas exchange measurement. After the calorimetry measurements were completed, the ruminal buffer was removed and the ruminal contents were reintroduced into the rumen. Steers were then returned to individual pens and fed.
Gas exchange measurement
The steers had been previously introduced to the head-boxes for adaptation to being restrained and to acclimate them to stand or lie down. Each head-box (90×60×150 cm) was constructed of a stainless steel frame, which is big enough to allow the steer to move its head in a minimally restricted manner; three walls were composed of plexiglass windows, one of which was hinged to allow access for feeding and monitoring of the steer’s condition. The fourth side contained a large opening through which the steer’s head was placed into the chamber and surrounded by a canvas sheath extending from the opening that was placed around the steer’s neck and tied at the base of the neck to minimize air leakage. The canvas sheath and negative air flow within the head-box prevented respiratory gas escape from the chamber. Each head-box was fitted with a waterer, feeder and air-conditioning unit to maintain consistent temperature and relative humidity.
Air flow from the head-boxes was determined by individual mass flow meters (Columbus Instruments; Columbus, OH, USA) and was maintained at 600 l/min during measurement of respiratory gas exchange. Respiratory gases were analyzed for O2 with a magnetic gas analyzer (Paramagnetic Oxygen Sensor; Columbus Instruments) and CO2 (Carbon Dioxide Sensor; Columbus Instruments) and CH4 (Methane Sensor VIA-510; Horiba Ltd, Kyoto, Japan) concentrations with an IR gas analyzer. Inspired and expired gases were collected at 9-min intervals using Oxymax Software (Columbus Instruments). Before the gas exchange measurements, gas analyzers were calibrated with reference gas mixtures (19.88% O2, 0.683% CO2 and 0.065% CH4). The validity and accuracy of the expired CO2 and inspired O2 flows on each head-box were checked by propane combustion (recoveries were 98.0±6.3 and 105.8±1.0 of expected CO2 production and O2 consumption, respectively).
Heart rate (HR) and rectal temperature (RT) measurement
HR was measured using a radio telemetry transmitter (WearLink; Polar Brand, Brooklyn, NY, USA) attached to a heart-girth band. Data were recorded at 1-min intervals throughout 24 h on a data logger (CorTemp; HQ Inc., Palmetto, FL, USA) and transferred to a computer for processing. RT was measured by a digital thermometer (Electro-Therm TM99A; Cooper Instrument Corp., Middlefield, CT, USA) every 4 h for the 24-h gas exchange period.
Blood collection and analysis
Blood samples were taken by venipuncture from the caudal tail vein immediately before feeding and every 4 h during the subsequent 24-h period on days 20 and 21 of each period. Blood was collected in heparinized tubes and centrifuged (2000×g at 4°C for 20 min), to collect plasma then stored (−20°C) until analysis.
The plasma concentrations of insulin and cortisol were analyzed by radioimmunoassay procedure using a double-antibody technique (Coat-A-Count; Siemens Healthcare Diagnostics Inc., Los Angeles, CA, USA). Plasma concentrations of β-hydroxybutyrate (BHBA) was determined using an enzymatic assay (Stanbio Laboratory, Boerne, TX, USA) adapted for use on a Konelab 20XTi Analyzer (Thermo Electron Corp., Vantaa, Finland). Plasma concentrations of glucose were analyzed by a Konelab 20XTi Analyzer using methods based on hexokinase (Thermo Trace Glucose Hexokinase Infinity Reagent; Thermo Electron Corp., Waltham, MA, USA).
Urine collection
Urine was collected on days 20 and 21 of the each period via continuous suction using a rubber funnel system attached to the ventral portion of the abdomen that allowed separation from feces and collection of urine into a plastic collection vessel. The collection vessel contained sufficient H3PO4 to ensure a final pH of 3.0 or less. The acidified urine was stored (−20°C) until analysis. Nitrogen contents of wet urine were analyzed by combustion using a Vario Max CN elemental analyzer (Elementar Analysensysteme GmbH, Hanau, Germany).
Diet analysis
Feed samples were dried in a forced-air oven (at 60°C, 48 h), ground through a 2-mm screen in a Wiley mill (Model 4; Thomas Scientific, Swedesboro, NJ, USA). The dried ground samples were analyzed for DM and CP according to the procedure of Assiciation of Official Analytical Chemists (1990). NDF and ADF were determined according to Van soest et al. (Reference Van Soest, Robertson and Lewis1991) using filter bags (ANKOM Technology Corporation, Fairport, NY, USA). Heat-stable amylase and sodium sulfite were used in the NDF procedure and the results were expressed with residual ash. Metabolizable energy (ME) values were calculated using tabular values and NEm was calculated using equations from NRC (2000).
Calculations
HP was calculated using the equation of Brouwer (Reference Brouwer1965), with O2 consumption, CO2 and CH4 production, and urinary N excretion values obtained on days of gas exchange measurement determined during the FED and WASHED segments. HP was expressed relative to metabolic body size (BW0.75) using weights obtained on day 20 of each experimental period before the morning feeding. The RQ was calculated as the ratio of the volume of CO2 released to the volume of O2 consumed.
The plateau of RQ was estimated using non-linear regression analysis to a one-phase decay equation using GraphPad Prism 5 (GraphPad Software Inc., La Jolla, CA, USA) and the following equation: Y(t)=A×exp −kt +Plateau, in which t is time in hours, Y(t) the RQ value, A the difference between Y value at time zero and at plateau, Plateau the Y value at infinite time and k the rate constant.
HP data for WASHED steers were adjusted to a 24-h (a day) value from 9 to 24 h after rumen washing. RQ, RT, HR and blood data for WASHED steers were averaged across the 16-h measurement from 9 to 24 h after rumen washing.
Statistical analysis
Since the primary aim was not to compare steers in the fed state with fasted, but rather to use data from the fed state to validate the experimental model and the effects of dietary treatment, data for the FED steers (collected the initial 24 h) were analyzed separately from data for WASHED steers that was the final 16 h (Figure 1) of the 48-h measurement period (Kim et al., Reference Kim, McLeod, Klotz, Koontz, Foote and Harmon2013).
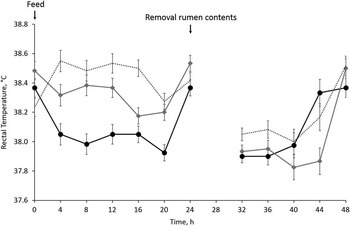
Comparison of rectal temperature patterns between steers with different intakes. The steers were fed alfalfa cubes on the morning of the 1st day (at 0 h) at 1.0 (●), 1.5 (♦) and 2.0 (∙∙∙)×NEm based on BW and the following day (at 24 h) rumen contents were removed, rinsed and incubated with 15 kg of ruminal buffer for 24 h. Error bars are s.e.m. (partly covered by the symbols).

Hourly averages of HR, HP and RQ, which were collected at 15 min intervals for 24-h periods during days 20 and 21, were analyzed as a replicated 3×3 Latin square design using the MIXED procedure of SAS (SAS Inst. Inc., Cary, NC, USA) with individual steer as the experimental unit. The statistical model used for these analysis included square, period, steer, intake, sampling hour and the interaction of intake×sampling hour. Steer, the interaction of steer×intake and the interaction of steer×sampling hour were considered random effects whereas square, period, intake, sampling hour and the interaction of intake×sampling hour were fixed effects. Kenward–Roger’s approximation was used for calculation of the degrees of freedom of the pooled error term. The steer, the interaction of steer×intake and the interaction of steer×sampling hour were used as the error term to test intake and the interaction of intake×sampling hour, which were obtained from Type III mean square. The effect of intake×sampling hour interaction was separated using the PDIFF option with the SLICE option to analyze for effects among intakes. RT, blood metabolites and hormones were analyzed as a replicated 3×3 Latin square design using the MIXED procedure of SAS using the same model as above. Orthogonal contrasts were used to test the linear and quadratic effect of intake for daily data. Results are presented as least squares means±s.e.m., and significance for the effect of intake and intake×sampling hour interaction was declared at P<0.05.
Results
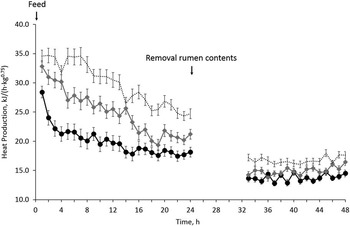
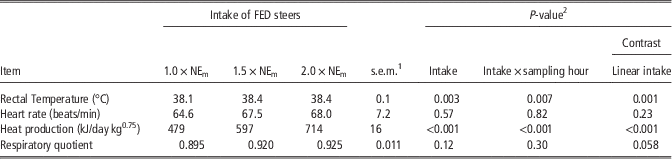
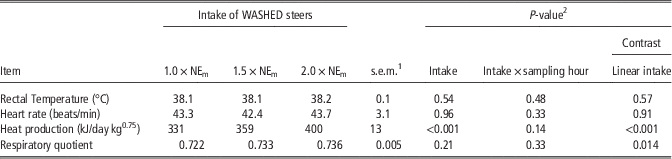
In FED steers RT had an intake×sampling hour interaction (P=0.007; Table 1) as RTs were similar at the beginning and end of the feeding cycle (0 and 24 h; Figure 1). HR was not affected by intake whereas HP and RQ increased linearly (P<0.001 and P<0.058, respectively) with intake; however, HP had an intake×sampling hour interaction (P<0.001; Figure 2) as HP declined post-feeding. RT and HR in WASHED steers were not affected by intake (Table 2) whereas HP and RQ both increased linearly (P<0.001 and P<0.014, respectively) with increasing intake.
Comparison of heat production patterns between steers with different intakes. The steers were fed alfalfa cubes on the morning of the 1st day (at 0 h) at 1.0 (●), 1.5 (♦) and 2.0 (∙∙∙)×NEm based on BW and the following day (at 24 h) rumen contents were removed, rinsed and incubated with 15 kg of ruminal buffer for 24 h. Error bars are s.e.m. (partly covered by the symbols).

Comparison of respiratory measurements among fed steers (FED steers) when they were fed with alfalfa cubes at level of 1.0, 1.5 and 2.0×NEm based on the BW

1 s.e.m., n=6.
2 The interaction of intake×sampling hour was separated using the PDIFF option with the SLICE option to analyze for effects among intakes.
Comparison of respiratory measurements among fasting steers (WASHED steers) when the rumen was emptied

1 s.e.m., n=6 from steers incubated with 15 kg of ruminal buffer from 9 to 24 h on the 2nd day of fasting.
2 The interaction of intake×sampling hour was separated using the PDIFF option with the SLICE option to analyze for effects among intakes.
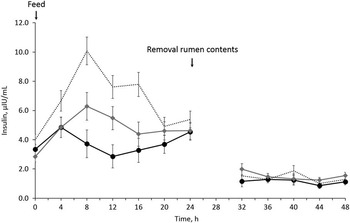
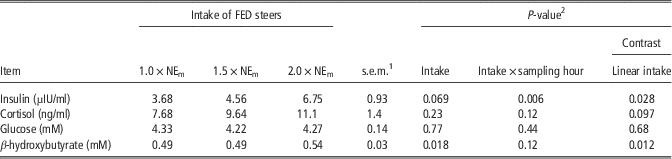
Plasma insulin concentrations had an interaction of intake×sampling hour (P=0.006) in the FED steers (Table 3) as concentrations increased with intake post-feeding but were similar by 20 h after feeding (Figure 3). Plasma cortisol and glucose were unaffected by intake, but cortisol tended (linear, P=0.10) to increase with intake. Differences in plasma BHBA concentrations were small but increased (P=0.012) with increasing intake.
Comparison of plasma insulin between steers with different intakes. The steers were fed alfalfa cubes on the morning of the 1st day (at 0 h) at 1.0 (●), 1.5 (♦) and 2.0 (∙∙∙)×NEm based on BW and the following day (at 24 h) rumen contents were removed, rinsed and incubated with 15 kg of ruminal buffer for 24 h. Error bars are s.e.m. (partly covered by the symbols).

Comparison of plasma hormones and metabolites measurements among fed steers (FED steers) when they were fed with alfalfa cubes at level of 1.0, 1.5 and 2.0×NEm based on the BW

1 s.e.m., n=6.
2 The interaction of intake×sampling hour was separated using the PDIFF option with the SLICE option to analyze for effects among intakes.
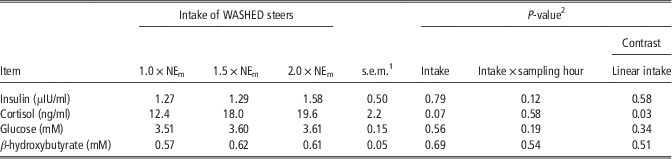
Plasma insulin concentrations were unaffected by intake in the WASHED steers (Table 4), whereas plasma cortisol concentration increased linearly (P=0.03) with increasing intake. Plasma concentrations of glucose and BHBA all were unaffected by intake.
Comparison of plasma hormones and metabolites measurements among fasting steers (WASHED steers) when the rumen was emptied

1 s.e.m., n=6 from steers incubated with 15 kg of ruminal buffer from 9 to 24 h on the 2nd day of fasting.
2 The interaction of intake×sampling hour was separated using the PDIFF option with the SLICE option to analyze for effects among intakes.
Discussion
RT
HP in the rumen creates a heat load that dissipates from the rumen to the body. It was demonstrated that RT tended to follow rumen temperature and increased as metabolic rate increased (Gengler et al., Reference Gengler, Martz, Johnson, Krause and Hahn1970). In addition, Hicks et al. (Reference Hicks, Hicks, Bucklin, Shearer, Bray, Soto and Carvalho2001) found temperatures measured in the rumen were statistically the same as RTs. Therefore, the RT for WASHED steers results from the loss of fermentative heat by removing the rumen contents because the microbial fermentation of feed contributes an important part of the total heat load of ruminants. However, they appear to compensate for this loss as RT was increasing from 40 to 48 h in WASHED steers (Figure 1). It was previously shown that core temperature was increased from 40 to 48 h in WASHED steers as well (Kim et al., Reference Kim, McLeod, Klotz, Koontz, Foote and Harmon2013). It suggests this is a physiological process for energy conservation in response to feed restriction.
HR
HR is increased during eating, which is associated with cardiovascular changes (Osuji, Reference Osuji1974), and portal blood flow is related to the intake of ME in cattle (Lomax and Baird, Reference Lomax and Baird1983). HR is also positively associated with rumination. Lessening of stimulatory properties by emptying and washing the rumen may remove this stimulation. This is supported by results of our previous study where no correlation between HR and HP in the WASHED steers was detected (Kim et al., Reference Kim, McLeod, Klotz, Koontz, Foote and Harmon2013). Derno et al. (Reference Derno, Jentsch, Schweigel, Kuhla, Metges and Matthes2005) also reported that HR, taken after a 17-h feed withdrawal, did not correlate with maintenance energy values. Meanwhile, the lack of change in HR with differing intakes in the FED steers may be owing to large errors related to behavioral components such as standing, moving, lying, etc., also greatly affecting HR (Palestrini et al., Reference Palestrini, Ferrante, Mattiello, Canali and Carenzi1998).
Although HR has been widely used as a means to estimate HP because oxygen used by animals is transported to tissues by the work of the heart, for HP to be predicted from HR measurements it needs to be determined daily over the course of several days because HR during eating can induce large variation (Brockway and Mcewan, Reference Brockway and Mcewan1969). In addition, Turbill et al. (Reference Turbill, Ruf, Mang and Arnold2011) reported that it was impractical to use HR without prior calibration against oxygen consumption because a large range of HR due to reproductive activity, feeding or cold exposure had either no or relatively minor (<5%) effects on the estimated oxygen pulse per heart beat (Brosh, Reference Brosh2007).
HP
There are a number of factors that influence HP of animals. Among these factors, there is a positive relationship between intake and HP (Blaxter, Reference Blaxter1967) because oxygen consumption is closely related to intake, and metabolic rates of body tissues decline as energy intake declines. HP for 1.0, 1.5 and 2.0×NEm intakes was 479, 597 and 714 kJ/daykg0.75 (s.e.m.=15.8), respectively, for FED steers. Fasting HP using the washed rumen technique was achieved at 331, 359 and 400 kJ/daykg0.75 (s.e.m.=13.4) for 1.0, 1.5 and 2.0×NEm intakes before fasting, respectively. These data had no intake×sampling hour interaction (Table 2 and Figure 2). It suggests that the washed rumen model provides a rapid and stable period for estimating HP and that prior nutritional status is reflected in the values obtained. This approach and results are supported by our previous study where there were no differences in RQ and fasting HP (P=0.23 and P=0.81, respectively) between the time segment of 9 to 16 and 17 to 24-h post-rumen washing (Kim et al., Reference Kim, McLeod, Klotz, Koontz, Foote and Harmon2013).
These results also agree with previous research as animals on a higher plane of nutrition before determination of fasting HP had values 25% to 53% greater than those on low planes of nutrition (Konng et al., Reference Koong, Ferrell and Nienaber1985) and estimated ME for maintenance decreased in growing calves when ME intake was reduced (Labussiere et al., Reference Labussiere, van Milgen, de Lange and Noblet2011), which also agrees with this observation. It was shown that weights of metabolically active organs, stomach, small intestine, large intestine, liver and kidney of animals on the higher planes of nutrition were significantly greater (Koong et al., Reference Koong, Ferrell and Nienaber1985) than those on lower planes of nutrition. The washed rumen method may provide better estimates of HP as it better represents these differences in organ weights because of the short fasting period.
Ferrell (Reference Ferrell1988) reported that HP for maintenance functions accounts for 60% to 70% of total HP. In the present study, HP for maintenance functions accounts for 69%, 60% and 56% of total HP on 1.0, 1.5 and 2.0×NEm intakes received before washed rumen, respectively. HP for FED steers increased ~20% for each 0.5×maintenance energy increases in the present study. In contrast, fasting HP increased, proportionately about 10% for each 0.5×maintenance energy increase before fasting. Therefore, the washed rumen model provides a consistent response. In addition, the measurements are stable in the relatively short period following the removal of rumen contents (Figure 2).
RQ
The RQ approaching 0.7 is indicative of a fasting animal (Brody, Reference Brody1945). Previous results using traditional fasting approaches have varied with the length (day) of fasting. Baker et al. (Reference Baker, Buckley, Dickerson and Nienaber1991) reported that 2-day fasted cattle were still digesting some food and metabolizing body protein because the RQ values were ~0.78. Others have reported that the RQ had not declined to ~0.7 in 3-day fasted cattle as the RQ still remained at 0.79 (Blaxter and Wainman, Reference Blaxter and Wainman1966). Yan et al. (Reference Yan, Gordon, Ferris, Agnew, Porter and Patterson1997) reported that fasting HP and methane output did not stabilize until ~3 days after starvation. In contrast, in the present study, steers were adapted by different feeding levels until the day before ruminal washing. We achieved a fasting RQ, which was characterized by a decline in RQ to a value very close to 0.7 in all the WASHED steers and kept a steady state from 9 to 24 h. The plateau RQ was estimated using non-linear regression analysis for a one-phase decay equation, which were 0.717, 0.710 and 0.719 at 1.0, 1.5 and 2.0×NEm intakes for WASHED steers, respectively. A steady state of the RQ value achieved approximately at 6, 11 and 10 h after removing the rumen contents for 1.0, 1.5 and 2.0×NEm, respectively. The equations for WASHED steers are as follows:
 $$\eqalignno{ & {\rm 1}.0{\times}{\rm NE}_{{\rm m}} ,Y=0.0{\rm 743}{\times}{\rm exp}^{{{\minus}0.{\rm 1756}t}} {\plus}0.{\rm 7165}\left( {r^{{\rm 2}} =0.{\rm 415}} \right) \cr & {\rm 1}.{\rm 5}{\times}{\rm NE}_{{\rm m}} ,Y=0.0{\rm 932}{\times}{\rm exp}^{{{\minus}0.0{\rm 928}t}} {\plus}0.{\rm 71}0{\rm 1}\left( {r^{{\rm 2}} =0.{\rm 511}} \right) \cr & {\rm 2}.0{\times}{\rm NE}_{{\rm m}} ,Y=0.0{\rm 866}{\times}{\rm exp}^{{{\minus}0.{\rm 1}0{\rm 77}t}} {\plus}0.{\rm 7192}\left( {r^{{\rm 2}} =0.{\rm 467}} \right) $$
In addition, methane output was not detected in the WASHED steers.
Washing the rumen provides similar results as the traditional starvation technique, but within a shorter time period by removing the main source of energy in minutes. As mentioned above, this is supported by RQ values from 9 to 24 h after washing the rumen as these no longer reflect the continuing metabolism of the diet and there was no intake×sampling hour interaction. Digesta will remain in the lower digestive tract including the omasum and abomasum; however, the influence of this on RQ values appears to be minimal.
Blood profiling
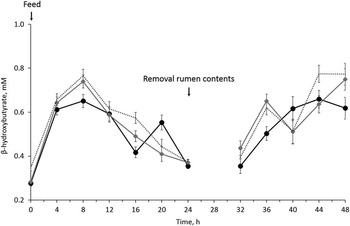
In the fasting state, gluconeogenesis is maintained by elevated levels of glucocorticoids (Trenkle, Reference Trenkle1981). The decreasing concentrations of plasma insulin for WASHED steers could allow the cortisol to express a ketogenic effect; therefore, resulting in the release of non-esterified fatty acid (NEFA) from adipose tissue to blood. The increased NEFA associated with an reduced insulin level during fasting has also been observed by Mills and Jenny (Reference Mills and Jenny1979) and Schwalm and Schultz (Reference Schwalm and Schultz1976). Plasma concentrations of BHBA for WASHED steers in the current study did not exceed 1.4 mM (See Figure 4). This is considered the threshold for subclinical ketosis (Duffield, Reference Duffield2000; Oetzel, Reference Oetzel2004). Serum levels of BHBA in excess of 1.75 mM indicate a severe energy deficit (Whitaker, Reference Whitaker2004). Furthermore, cortisol level is used as an indicator of stress and pain. Blood concentrations above 70 ng/ml indicate stress, and levels exceeding 90 ng/ml is evidence of extreme stress (Grandin, Reference Grandin1997). Ward et al. (Reference Ward, Henricks, Jenkins and Bridges1992) found that fasted cattle have higher serum cortisol concentrations than do fed cattle. Mills and Jenny (Reference Mills and Jenny1979) reported that depriving cattle feed and water for 3 days results in stress where glucocorticoids increased above 70 ng/ml. Cortisol concentrations for WASHED steers did not exceed 20 ng/ml (See Table 4). Therefore, the washed rumen technique is a less stressful means to predict the energy required for maintenance in cattle compared with the traditional fasting method.
Comparison of plasma β-hydroxybutyrate between steers with different intakes. The steers were fed alfalfa cubes on the morning of the 1st day (at 0 h) at 1.0 (●), 1.5 (♦) and 2.0 (∙∙∙)×NEm based on BW and the following day (at 24 h) rumen contents were removed, rinsed and incubated with 15 kg of ruminal buffer for 24 h. Error bars are s.e.m. (partly covered by the symbols).

Prolonged fasting has been reported to increase BHBA and NEFA concentrations (Lomax and Baird, Reference Lomax and Baird1983; Veenhuizen et al., Reference Veenhuizen, Drackley, Richard, Sanderson, Miller and Young1991). During prolonged fasting a large portion of blood NEFA would be directed to ketone body synthesis in the liver. The decreasing concentrations of plasma insulin could allow the glucocorticoids to express a ketogenic effect resulting in the release of NEFA from adipose tissue by fasting, and could increase the rate of amino acid release from muscle for gluconeogenesis. These changes are supported by hormonal changes and may be extended with day of fasting, and the delayed effect with prolonged fasting periods may influence the fasting HP. Results of the current study suggest that the washed rumen technique for determination of the energy required for maintenance may permit these measures within shorter time periods without a severe energy deficit, which can be induced by prolonged fasting periods.
Conclusion
In most previous studies, cattle are adapted by restricted nutrition around maintenance for 3 to 6 weeks before fasting, after which, fasting HP is normally measured for 4 days. However, this approach might lead to an underestimate of fasting HP because a prolonged fasting duration can decrease the basal metabolic rate and induce ketosis. As an alternative to traditional fasting methodologies, a fasting state is achieved using a washed rumen technique and our results indicate that HP no longer reflects the continuing metabolism of the diet, which are the disappearance of CH4 production and a decrease of RQ to 0.7. In addition, the washed rumen technique reflects the nutritional status provided before fasting, which provides a consistent response. Therefore, application of the washed rumen technique for estimation of fasting HP produces a rapid and relatively stable period for estimation of HP that is indicative of mild nutrient restriction and minimal stress. A short duration of fasting using the washed rumen technique may provide an alternative to traditional fasting methodologies, and may be more representative of the producing animal, without a severe energy deficit and stress associated with long-term fasting.
Acknowledgments
Support for this research was provided in part by federal funds from the U.S. Department of Agriculture, Agricultural Research Service and by the Kentucky Agricultural Experiment Station and Publication No. 13-07-108. The authors express gratitude to Susan Hayes of the University of Kentucky for assistance with plasma radioimmunoassay.