Introduction
The development of various ‘-omic’ platforms has greatly enhanced the quantitative measurement of dynamic biological phenomena. Microarray-based assays of gene expression were the first widely applied -omic platform, but recent advances in deep-sequencing and mass spectrometry technologies now allow for more comprehensive and quantitatively sensitive surveys of gene, protein and epigenetic profiles in cells and tissues. It is generally anticipated that this depth of interrogation will underpin a ‘systems’ level appreciation of the biological processes. However, as measurement resolution and sensitivity continue to increase greater attention must be directed at the analysis of the data generated if the full benefit of these technical advances is to be realized.
A particular case in point is the accurate measurement of DNA methylation at specific genomic sites. Although it is already recognized that interpretation of such measurements is confounded by the inherent cellular and physiological heterogeneity that exists within complex tissues,Reference Talens, Boomsma and Tobi1–Reference Gervin, Hammero and Akselsen3 it is also critical to robustly partition the true biological signals from compounding technical measurement errors arising from the increasingly complex assay processes of sample preparation and physical measurement. In a range of technology platforms (see below), measurement errors display frequency distributions with unusual properties, notably strong ‘kurtosis’ (highly peaked with fat tails) and a level of ‘skewness’ arising because empirical methylation measurements are bounded between 0 and 1, which consequentially constrains measurement errors between −1 and +1. Thus, if the mean of the methylation measurement is close to zero, the error distribution is positively skewed, while if close to 1 the error distribution is negatively skewed. These features must be considered when deriving an expression for a probability density function, which accurately accounts for the nature of the methylation error distribution, without which accurate estimation and inference (hypothesis testing) is compromised. The commonly observed distributional characteristics can particularly mislead interpretation when the methylation measurement constitutes either the response variable, or the independent variable within a regression analysis.
Our previous analysis of DNA extracted from human umbilical tissue samples using the Sequenom EpiTyper massARRAY platform (www.sequenom.com/), which measures methylation by comparison of the mass of transcription cleavage products derived from amplified bisulphite-modified DNA by matrix-assisted laser desorption ionization time-of-flight (MALDI-TOF) mass spectrometry,Reference Ehrich, Nelson and Stanssens4 confirms that error frequency distributions are far from normal. When quantifying levels of methylation, the observed variance in methylation measurements across subjects represents the sum of naturally occurring biological variance and the variability inherent within the measurement procedure itself. The issue of errors in Sequenom measurement protocols has received attention previouslyReference Warnecke, Stirzaker and Melki5–Reference Coolen, Statham, Gardiner-Garden and Clark7 and have been linked with a range of variables including the type of, and position within the thermal cycler, logistics of robotic handling and chip batch and positional effects. The importance of minimizing such error effects cannot be understated. We have since extended this interrogation to more fully describe the errors implicit in the process of generating epigenomic data by this platform.Having optimized the chemistry of the Sequenom assay by multifactorial testing of as many variables as we could practically control, we have made a very large number of replicate measures on the same biological sample to evaluate the deviation in measurement due specifically to sample spotting and the stochastic process MALDI-TOF mass spectrometry detection. We have assumed that the heterogeneity caused solely by the physics of the measurement procedure follows a two-dimensional Poisson process with an exponentially distributed Poisson parameter.Reference Gallant and Tauchen8 In which case, the probability that a particular methylation measurement will contain a given level of absolute deviation will similarly follow an exponential distribution (see Appendix 1). Accounting for the fact that deviations may be positive or negative this gives a Laplace distribution as a suitable description for the deviations.Reference Pawitan9 Having empirically estimated the error contribution arising from the assay chemistry and physics of machine measurement, we found that the Laplace distribution required an extension based on Hermite polynomialsReference Buckland10 to properly describe the observed deviations. This extended Laplace distribution allows for more confident inference for Sequenom platform generated data.Reference Hassell-Sweatman, Wake, Pleasants, McLean and Sheppard11
In brief, the bounded probability density we derived is defined thus:
 $$f\left( z \right)={{p^{4} e^{{{\minus}p\left| z \right|}} \left[ {1{\plus}qH_{3} \left( {\left| z \right|} \right)} \right]{\rm }} \over {2\left\{ {p^{3} {\minus}3qp^{2} {\plus}6q{\minus}e^{{{\minus}p}} \left( {3\left( {1{\minus}2q} \right)p^{3} {\plus}6pq{\plus}6q} \right)} \right\}}}$$
where p and q are parameters likely to be population dependent, z is the methylation measurement deviation and H 3(z) is the third-order Hermite polynomial equal to z 3−3z (note the use of the absolute value signs). The variables z i in probability density (equation 1) can be the residuals of a linear (z i=y i−(µ+βx i)), or nonlinear (z i=(y i−f(x iβ))) regression model, for observations y i and parameters μ, β. Because of the presence of the absolute value of the residual in the likelihood, differentiation of the log likelihood presents a technical difficulty. However, the parameters may still be found by maximizing the likelihood using non-gradient methodsReference Freund and Walpole12 (using the equations summarized in Appendix 2) and for the case of the Sequenom platform were estimated to be p=37.21; q=0.0429. Subsequent analyses assume this form of the distribution for methylation error measurement.
Problems also arise in performing tests of inference and in obtaining estimates of the standard errors of the regression coefficients. Using bootstrap estimates provided exceptionally poor estimates of the standard errors. Bootstrap estimates are known to perform poorly when applied to skewed distributions of the type of the methylation measurement error distribution.Reference Porter, Rao, Ku, Poirot and Dakins13 The skewness parameter associated with the third-order Hermite polynomial for this probability density (now defined with absolute values) is defined as 6q,Reference Jondeau, Poon and Rockinger14 that is, the skewness parameter for the Sequenom measurements is 6×0.0429=0.2574, representing a difference from the Laplace distribution. Notably, a similar Laplace probability density has also been reported to fit the frequency distribution of transcriptomics data generated by a microarray platformReference Purdom and Holmes15 suggesting that error distributions across differing -omics platform may have a common character.
By re-examining available measurements in the public data (summarized in Appendix 3), we now demonstrate that the ‘usual’ methods of statistical analysis are unsuitable for a wide range of -omic platform assays and illustrate that our bounded probability density accurately describes the error distributions in all of the measurement platforms considered. By the way of illustration, alignment of the measurement error frequency distributions between maximum-likelihood estimated normal (dashed) and extended Laplace (solid) for meDIP data is shown in Fig. 1a. Close examination of the error frequency distributions for other omics platforms indicates that they too display features indicative of non-normality. Further by re-examining our own published data, we illustrate that our analysis approach, applied when methylation is treated as a response variable, performs better than the currently preferred approach, which uses the forgiving β regression, but is based on the untested assumption that the measurement distributions are in fact related to a β distribution.Reference Seow, Pesatori and Dimont16 Further we illustrate the application of our approach when methylation measurement is the independent variable, in which case data analysis is complicated by an ‘errors-in-variables problem’.Reference Carroll, Ruppert, Stefanski and Crainiceanu17 Finally, using empirical measurements we extend the utility of this function beyond the ‘univariate’ case. The dependency parameter of the ‘bivariate’ distribution we present can be standardized and is shown to provide a better estimate of the relationship between methylation measurements at two CpG sites (i) residing within the same gene target; (ii) within two different gene targets; or (iii) whether temporally linked.
Methods
A range of author processed data was downloaded from the NCBI repository GEO (http://www.ncbi.nlm.nih.gov/gds) for four series (designated as GSE22513, GSE29231, GSE38352, GSE40870) chosen to (i) contain technical replicate data; (ii) for human tissue samples; and (iii) interrogated on different but widely used epigenomic (meDIP and Infinium 450 bead array) and transcriptomic (Illumina HT12 and Affymetrix U133_2) platforms (see Appendix 3). No additional processing was applied to the data before the difference between replicates was calculated for each probe.
Results
The extended Laplace measurement error distribution is generally applicable across -omics platforms
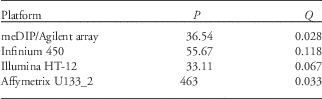
The measurement error frequency distribution was calculated for each data set (Fig. 1) after transformation to the interval [−1,1] by division of the errors by 10, 1, 10 and 10Reference Ehrich, Nelson and Stanssens4 for the meDIP, Infinium 450, Illumina HT12 and Affymetrix U133_2 platforms, respectively. The Normal distribution does not provide a suitable characterization of the error distribution in any of these cases [based on a Lilliefors test (P<0.001), as illustrated by the dashed curve (Fig. 1a), representing the corresponding maximum-likelihood estimated Normal for the meDIP/Agilent array assay protocol. However, the modified-Laplace probability density (equation 1) was found to fit the measurement error distributions for all four measurement platforms, representing the extended Laplace for the meDIP/Agilent array assay protocol. The estimated parameters that characterize the measurement error distributions for each platform are presented in Table 1.
The measurement error frequency distribution for (a) meDIP, (b) Infinium 450, (c) Illumina HT12 and (d) Affymetrix U133_2. Errors were transformed to the interval [−1,1] by dividing the errors by 10, 1, 10 and 10Reference Ehrich, Nelson and Stanssens4 for meDIP/Agilent array, Infinium 450, Illumina HT12 and Affymetrix U133_2 platforms, respectively. Also shown is the corresponding maximum-likelihood estimated Normal (dashed) and extended Laplace (solid) fit to the data. The measurement error distribution is not consistent with the Normal distribution.

Parameter values for each of the major -omics platforms

The estimated parameters that characterize the measurement error distribution was derived by equation 1. Errors were transformed to the interval [−1,1] by dividing the errors by 10, 1, 10, 104 for the meDIP, Infinium 450, Illumina HT12 and Affymetrix U133_2 platforms, respectively.
The extended Laplace regression compares favourably to currently used analytic approaches when methylation represents the response variable (case I)
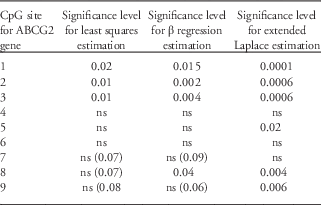
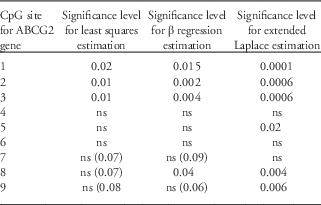
The difficulties of estimation and inference with CpG methylation measurements have been recognized previously. The most recent literature applies β regressionsReference Seow, Pesatori and Dimont16, Reference Ferrari and Cribari-Neto18, Reference Hebestreit, Dugas and Klein19 to deal with the distributional problems of CpG methylated data and demonstrates better performance than the traditional ordinary least squares approach. A comparison of our own algorithm (see equation 1) against both ordinary least squares and β regression using the R package Betareg20 for methylation measurements that we have previously published for the ABCG2 geneReference Babu, Zhang and Moloney21 is shown in Table 2. In this instance, the methylation status of the individual CpGs in the ABCG2 gene was found to vary as the response variable and align to phenotypic outcome, in sheep following experimental exposure to mycotoxin. Generally, the extended Laplace regression yields higher levels of significance (lower P-values) than the other methods, a feature consistent with it being based on a probability density more directly associated with the actual error frequencies, rather than the assumption of Normality or a β distribution for the errors.Reference Freund and Walpole12 Note particularly the result with ABCG2 gene CpG7, which is indeterminate under ordinary least squares and β regression analysis, but not seen to be significant under our algorithm. Further, analysis of the ABCG2 gene CpG9 is inconclusive for the comparison between ‘clinical’ and ‘resistant’ biological phenotypes with ordinary least squares and β regression, but is found to be highly significant (P<0.004) with our algorithm. Using in silico mapping tools we have identified consensus sites for potential transcriptional regulation in the region of CpG9, supporting the notion that this genomic region is indeed significant for the expression of phenotype responses (Zhang et al., unpublished observations).
Inference for the comparison of methylation levels for CpG sites in the ABCG2 gene a disease sheep reported previouslyReference Babu, Zhang and Moloney21
Application of the extended Laplace when estimation of methylation influences phenotype; the errors-in-variables problem (case II)
It is well known that errors in the independent variables of a regression analysis produce estimators that are biased and inconsistent.Reference Carroll, Ruppert, Stefanski and Crainiceanu17 A number of general methods have been developed for dealing with errors in the independent variables of a regression, employing simulation where representative samples are drawn from a probability distribution of the errors in the independent variables. Although observed errors in methylation measurements appear to be particularly prone to these problems, here we show that the extended Laplace probability density (equation 1) readily forms a basis for an ‘errors-in-variables’ or model II regression analysis. Specifically, we have considered the instance in which the degree of methylation at a genomic CpG site early in the life course is thought to have an influence on later phenotypic outcome, by re-analyzing data previously reported that describes a relationship between methylation of the RXRA gene in umbilical cord tissue at birth and the body mass index (BMI) of children at ages 4 and 6 years.Reference Godfrey, Sheppard and Gluckman22 We have applied the scoring method described by Carroll et al.,Reference Carroll, Ruppert, Stefanski and Crainiceanu17 to this re-analysis, with random samples drawn from the methylation measurement probability density (equation 1).
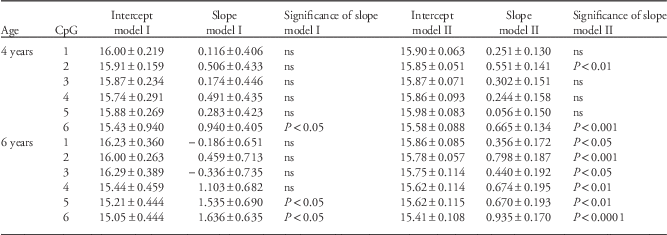
The correlations between degrees of methylation of each of the six adjacent CpG sites in this analysis was high, so it would be expected that the relationships with children’s BMI would be similar for each CpG site. Compared with the ‘traditional’ least squares estimates (model I) calculated from the same data set (Table 3), there are two essential points of importance to be recognized. First, the errors-in-variables regression coefficients that incorporate the error probability density (equation 1) are much more consistent with each other. Note, the least squares estimates do not show this relationship (and two estimators (CpG 1 and 3 in the 6-year data show reversed slopes) in keeping with the known lack of consistency of least squares estimators in this situation.Reference Carroll, Ruppert, Stefanski and Crainiceanu17 Second, the standard error of the errors-in-variables estimators is considerably lower, and the significant levels are better identified with the error distribution based on equation 1.
The model II regression of BMI on the level of methylation at each of the measured CpG sites in the RXRA gene
BMI=body mass index.
This analysis removes the outlier. The model I (i.e. standard least squares) regression estimates are included for comparison. Intercepts and slopes are reported±standard errors.
Extension to a bivariate methylation measurement error distribution
Of particular biological interest is determining the potential relationship between methylation measurements made at different CpG sites, either (a) within a given gene, (b) at CpG sites in different genes, (c) at the same CpG site in a gene but at different time points and (d) at the same CpG site in a gene but in different tissues. The usual statistic for this purpose is to calculate the correlation between variables. However, the high frequency of significance deviations that characterize methylation measurements may be misleading for the usual correlation calculation, either parametric or non-parametric, because these calculations do not allow for the probabilities or expected frequencies of large measurement deviations. Fortunately, there are a number of ways that the univariate methylation measurement probability density (equation 1) could be extended to two dimensions to accommodate these questions. The simplest approach adopted here is to build on conditional densities using the identity
 $$P\left[ {z,y} \right]=P\left[ {z\!\mid\!y} \right]P\left[ y \right]$$
where z, y denote methylation levels. A suitable construction must be found for the conditional probability density P[z|y], which is the probability that methylation z will be measured on CpG1 given that methylation y has already been observed on CpG2. There are a variety of ways that this might be done, and the usefulness of any construction must be judged in application. The simplest modification adopted here is to assume a linear relationship between the CpG measurements. Thus,
 $$P\left[ {z,y} \right]=Qp^{2} e^{{{\minus}p\left( {\left| z \right|{\plus}\left| y \right|{\plus}{\rm \theta }zy} \right)}} \left[ {1{\plus}q\left( {H_{3} \left( {\left| z \right|} \right){\plus}H_{3} \left( {\left| y \right|} \right)} \right)} \right] $$
where Q is the normalizing constant and the cross-product in the Hermite polynomials is ignored as being of order q 2. Note that the products of the two methylation measurements in the exponential of probability density (equation 2) are not taken as absolute values. The dependency parameter in the bivariate probability density (equation 2) is θ.
The normalizing constant Q is given by
 $$Q^{{{\minus}1}} =\mathop{\int}\nolimits_{{\minus}1}^1 {\mathop{\int}\nolimits_{{\minus}1}^1 {p^{2} } e^{{{\minus}p\left( {\left| z \right|{\plus}\left| y \right|{\plus}{\rm \theta }zy} \right)}} } \left[ {1{\plus}q\left( {H_{3} \left( {\left| z \right|} \right){\plus}H_{3} \left( {\left| y \right|} \right)} \right)} \right]{\rm dz dy} $$
This double integral cannot be evaluated explicitly and must be solved numerically, although this equation (equation 3) may be manipulated so that only a single integral must be performed numerically to calculate Q. These calculations are given in Appendix 4. The log likelihood based on the bivariate probability density (equation 2) can be maximized for the parameter θ using numerical optimization methods.
To interpret the dependency parameter as a measure of the relationship between the methylation of two CpG sites, the value needs to be standardizd, much as the product moment correlation coefficient is a standardized covariance. In this case, the standardization is carried out by estimating the dependency parameter for each set of methylation measurements linked with itself, and then dividing the bivariate dependency parameter by the maximum of these two estimates. That is, find the maximum θ estimate from calculations of P[z, z] or P[y, y], then divide the dependency parameter calculated for P[z, y] by this maximum parameter. The necessity of calculating the relationship between the methylations of two CpG sites in this way can be seen in a comparison of multiple methylation measurements made on the same CpG site. Because of the discrepancies induced by the measurement procedure there is a notable frequency of high errors in the multiple measurements. To illustrate this, we present a comparison of methylation values at the RXR gene promoter CpG sites (Table 4), in umbilical cordReference Godfrey, Sheppard and Gluckman22 and subject matched postnatal buccal swab tissue (unpublished data). Note, for example, the product moment correlation of these multiple tissue measurements for CpG1 is 0.03 (low). However, the standardized dependency parameter for this CpG calculated from the bivariate probability density (equation 2) is –0.43 with 95% confidence interval (−0.28 to −0.64) showing that, as would be expected the multiple measurements are actually relatively strongly related. This improvement in detecting relationships among the methylation status of the CpG sites is because the bivariate probability density (equation 2) takes into account the frequency of large errors expected in duplicate measurements. In this instance, comparison of multiple measurements at the same CpG sites suggests the following biological behaviour through the early life of the organism, which informs a discussion about the comparative impact of foetal programming and postnatal modification on epigenomic profiles. Specifically, at all of the measured CpG sites in RXR estimated methylation is higher in the cord at birth than in postnatal buccal samples. Further, the order of decrease in estimated methylation between subjects was preserved for most CpGs, with the specific exception of CpG4.
The scaled dependency coefficient and its statistical significance for cord and buccal methylation measurements in the RXRA gene

Discussion
Statistical procedures based on the Normal probability density are widely used in biology. At the level of the organism, the characteristics of interest are generally affected by the combination of many processes and the central limit theorem means that the frequency of these characteristics tends towards a Normal distribution, although the rate of this convergence can be slow. However, at the molecular level nonlinear processes may dominate, and become a factor especially if small amounts of biological material are being measured. Under these circumstances of nonlinear relationships, the central limit theorem may not apply and the basic probability distributions of the molecular measurements may not be Normal, or even close to Normal.Reference Freund and Walpole12 In these circumstances, basing estimation and inference on statistical procedures that assume the error distribution is Normal may be misleading, as we have sought to illustrate. Notably, important aspects of the biology of these processes may be overlooked, lost within the observation errors and not uncovered because the nature of the errors is not accounted for correctly.
These problems appear to manifest in the measurement of both epigenomicsReference Talens, Boomsma and Tobi1–Reference Gervin, Hammero and Akselsen3 and transcriptomicsReference Purdom and Holmes15 data generated by widely used and diverse technology platforms. The extended Laplace approach based on a detailed empirical knowledge of the error frequency distributions inherent in the measurements represents a first attempt to deal with these issues. Although not necessarily optimal, the current study provides a generic approach for investigating and formulating suitable statistical methods for estimation and inference when the assumption of Normal errors fails.
The suggested steps are shown below:
∙ Perform a factorial experiment (changing the protocols under the control of the experimenter) to optimize sample preparation and make measurements in a designed way. Analyse these data to partition the sources of experimental variation and use this analysis to define a protocol that minimizes variation in the measurements due to experimental procedure.
∙ With this optimized assay, perform a number of repeated measures of the same sample to obtain a measurement error frequency distribution. Assess whether this distribution satisfies requirements to be Gaussian or another known frequency distribution. In particular, consider the impact of other factors (e.g. the requirement that the error distribution be bounded) on the chosen representation for this distribution.
∙ If the error frequency distribution does not satisfy the criteria for known families of probability distributions, construct a suitable representation (e.g. using Edgeworth expansions or Gram–Charlier seriesReference Kolassa23).
∙ When a suitable representation of the error distribution is found derive methods of estimation and inference based on, for example, maximum-likelihood methodology.Reference Pawitan9 Test the efficacy of these methods using simulated data to quantify the improvement in estimation and inference. If these tests are satisfactory then analyse the data accordingly.
The most dramatic improvements in the application of the derived methylation measurement probability density have been in the errors-in-variables case, or model II regressions. When the CpG site methylation affects some phenotypic outcome the derived methylation measurement probability density can be used with errors-in-variables methods such as the scoring algorithm to considerably improve both estimation and inference. The clarity brought to hypothesis testing using this methodology is notable. Our data suggests that this issue is not restricted either to epigenetic analysis or to the methodologies of epigenetic analysis but is likely to be a broadly based issue in systems biology.
Acknowledgements
The authors extend their gratitude to Prof. Terry Speed (WEHI Melbourne, Australia) and members of the Developmental Epigenetics Group (Liggins Institute, University of Auckland) for critical reading and valuable feedback on the manuscript.
Financial Suppoort
This work was funded by New Zealand Government contract UOAX0808 and Gravida National Centre for Growth and Development, NZ.
Conflicts of Interest
None.
Appendix 1
The theory summarized here is taken from Hassell Sweatman et al.,Reference Hassell-Sweatman, Wake, Pleasants, McLean and Sheppard11 applicable to our case in which methylation proportion is treated as the response variable and multiple explanatory variables are considered. A linear model is assumed. Specifically, let  $$y\in R^{n} $$
be a vector of response variables, let X be a real-valued n×m matrix, where
 $$x_{{i1}} =1$$
, i=1, … ,n. In practice, we usually have n, the number of data points, much larger than m the number of coefficients. Let β
 $$ \in R^{m} $$
be a vector of coefficients for our linear model and assume that E(y)=X β. The goal is to estimate the components of β by ML principles, and to determine their standard errors, given y, X and the response variable distribution (1). Let z=y−X β be the error vector. We assume that the errors are independent. The response variable distribution is modelled by (1). Then the log likelihood (disregarding the constant term) is
 $$l\left( {\rm \beta } \right)=\ln (f\left( {z({\rm \beta })} \right))=\mathop{\sum}\nolimits_{i=1}^n {\left[ {{\minus}p\left| {z_{i} } \right|{\plus}{\rm ln}\left[ {1{\plus}q\left( {\left| {z_{i} } \right|^{3} {\minus}3\left| {z_{i} } \right|} \right)} \right]} \right]} $$
The inclusion of the modulus (absolute value) function in the perturbed Laplace probability density function (equation 1) is the cause of abrupt changes in the gradient of the log-likelihood function. Although gradient-based methods of ML parameter estimation fail, such estimation may be done by non-gradient methods such as the simplex method or simulated annealing.
The abrupt changes in gradient must be taken into account when calculating the standard errors of the parameters. The fact that l(β) is not differentiable in the classical sense at a local maximum means that the assumptions made in the derivation of the usual classical formulae for the information matrix, the expected value of the Hessian of the log-likelihood function and the variance–covariance matrix for the model coefficients βi, j=1, …, m, are not met. For C 2 probability density functions, these formulae are derived using Taylor series. In section 4 in Hassell Sweatman et al. Reference Hassell-Sweatman, Wake, Pleasants, McLean and Sheppard11 using generalized functions, alternative expressions for these quantities are found, assuming truncated and/or perturbed Laplace response functions which are C 3 where the modulus function is non-zero. In section 5 in Hassell Sweatman et al.,Reference Hassell-Sweatman, Wake, Pleasants, McLean and Sheppard11 these expressions are used to prove the asymptotic convergence of our MLE to a random variable with a normal distribution.
To derive these expressions, generalized functions have been used:
 $${\rm sgn}\left( x \right)=\left\{\!\!\!\!\!\!\!\!\! {\matrix{ { \ \,\,\,\,\,\,\,\,\,1 , \quad \!\!\!\!x\,\,\gt\, 0 } \cr { \quad \,\,\,\,\,0,\quad \!\!\!x=\!0} \cr \,\,\,\,\,\,{{\minus}1, \quad \!\!\!\!x\,\lt\, 0} \cr } } \right.$$
and δ(x), which is the δ function that is zero except at one point x=0 and where  $$\mathop \int \nolimits_{{\minus}\infty}^\infty {\rm \delta }\left( x \right)dx=1$$
. These expressions and the modulus function are connected by
 $$\eqalignno{ & {d \over {dx}}\left| x \right|={\rm sgn}\left( x \right) \cr & {d \over {dx}}{\rm sgn}\left( x \right)=2{\rm \delta }\left( x \right)$$
where the differentiation is taken in a generalized sense.
With respect to the model parameters, let E(H) denote the expected value of the generalized Hessian of the log-likelihood function, let J denote the information matrix and let V denote the variance–covariance matrix. It is provedReference Hassell-Sweatman, Wake, Pleasants, McLean and Sheppard11 that
 $$\eqalignno{ & E\left( H \right)={\rm \varsigma }X^{T} X \cr & \ \,\ \quad J=vX^{T} X$$
and
 $$V^{{{\minus}1}} ={{{\rm \varsigma }^{2} } \over \nu } X^{T} X$$
where  $${\rm \varsigma }=E\left( {{{\partial ^{2} l} \over {\partial z_{i} ^{2} }}} \right)$$
and
 $$\nu =E\left( {{{\partial l} \over {\partial z_{i} }}} \right)^{2} $$
(these quantities do not depend on the index i) and we assume that X has full rank m. It is shown that the usual classical relation for smooth log-likelihood functions, namely V=J −1=[−E(H)]−1 does not hold, although it is a good approximation for large p and small q. For example, when q=0 it turns out that v=p 2 and
 $${\rm \varsigma }= {\minus}{{p^{2} } \over {1{\minus}e^{{{\minus}p}} }}$$
. To compare a model with M coefficients to a lesser model with P coefficients, let
 $${\rm \lambda }={{L({\rm \beta }_{1} ,\,\ldots\,{\rm \beta }_{{M }} )} \over {L({\rm \beta }_{1} ,\,\ldots\,{\rm \beta }_{{P }} )}} $$
be the likelihood ratio. The generalized log-likelihood ratio statistic is
 $$D_{{{\rm gen}}} = {\minus}2{{\rm \varsigma } \over \nu }\ln {\rm \lambda },$$
distributed approximately as x 2(M−P) if the lesser model gives a good description of the data.For example, for the case m=2 corresponding to one explanatory variable, the log likelihood (disregarding the constant term) is
 $$l\left( {{\rm \beta }_{1} ,{\rm \beta }_{2} } \right)=\mathop{\sum}\nolimits_{i=1}^n {\left[ {{\minus}p\left| {z_{i} } \right|{\plus}{\rm ln}\left[ {1{\plus}q\left( {\left| {z_{i} } \right|^{3} {\minus}3\left| {z_{i} } \right|} \right)} \right]} \right]} $$
where setting x i=x i2
 $$z_{i} =y_{i} {\minus}\left( {{\rm \beta }_{1} {\plus}{\rm \beta }_{2} x_{i} } \right)$$
Since the log-likelihood function l(β1,β2) in (1a) involves the modulus of the deviations zi then l(β1,β2) is not differentiable with respect to its parameters when any z i=0. The nature of the maximization means that the maximum occurs on a ridge in (β1, β2, l) space, defined by some z i=0. Assuming that not all the x i are equal (so that X has full rank 2), a maximum will occur at the intersection of two distinct ridges defined by z i=zj=0, for some i≠j.
Generalized differentiation yields
 $${{\partial l} \over {\partial z_{i} }}={\minus}p \ {\rm sgn}\left( {z_{i} } \right){\plus}{{\left( {3q\left| {z_{i} } \right|^{2} {\minus}3q} \right).{\rm sgn}(z_{i} )} \over {1{\plus}q\left| {z_{i} } \right|^{3} {\minus}3q\left| {z_{i} } \right|}}$$
and
 $$ {{\partial ^{2} l} \over {\partial z_{i} ^{2} }}= {\rm \delta }\left( {z_{i} } \right)\left( {{\minus}2p{\minus}6q} \right){\plus}{{({\minus}3q)\left( {q\left| {z_{i} } \right|^{4} {\minus}2\left| {z_{i} } \right|{\plus}3q} \right)\left( {{\rm sgn}\left( {z_{i} } \right)} \right)^{2} } \over {\left( {1{\plus}q\left| {z_{i} } \right|^{3}\, {\minus}\,3\left| {z_{i} } \right|} \right)^{2} }}. $$
Integrating over the error space [−1,1]n with respect to (1) yields expected values.
Appendix 2
The log likelihood (disregarding the constant term) is
 $$f\left( {{\rm \alpha },{\rm \beta }} \right)=\mathop{\sum}\nolimits_{i=1}^n {\left[ {{\minus}p\left| {z_{i} } \right|{\plus}{\rm ln}\left[ {1{\plus}q\left( {\left| {z_{i} } \right|^{3} {\minus}3\left| {z_{i} } \right|} \right)} \right]} \right]} $$
where
 $$z_{i} =y_{i} {\minus}\left( {{\rm \alpha }{\plus}{\rm \beta }x_{i} } \right)$$
Since the log-likelihood function f(α, β) in equation 2a involves the modulus of the deviations z i then f(α, β) is not differentiable with respect to the parameters α and β when z i=0. The nature of the maximization means that this is very likely to occur for some zi and we have found that this often occurs in practice. That is, the maximum will occur at the intersection of two ridges in the (α, β, f) space at which z i=z j=0. Accordingly, maximization based on derivative-free methods is necessary, for example, simplex optimization or simulated annealing.
Notwithstanding this difficulty, the first and second derivatives of the log-likelihood f(α, β) with respect to the parameters α and β, needed for calculation of the standard errors, can be determined using generalized function theory:
 $${{\partial f} \over {\partial {\rm \alpha }}}=p\mathop \sum\limits_{i=1}^n {\rm sgn}\left( {z_{i} } \right){\plus}\mathop \sum\limits_{i=1}^n {{\left( {3q\left| {z_{i} } \right|^{2} {\minus}3q} \right).{\rm sgn}(z_{i} )} \over {1{\plus}q\left| {z_{i} } \right|^{3} {\minus}3q\left| {z_{i} } \right|}}$$
 $${{\partial f} \over {\partial {\rm \beta }}}=p\mathop \sum\limits_{i=1}^n x_{i} \ {\rm sgn}\left( {z_{i} } \right){\plus}\mathop \sum\limits_{i=1}^n {{x_{i} \left( {3q\left| {z_{i} } \right|^{2} {\minus}3q} \right).{\rm sgn}\left( {z_{i} } \right)} \over {1{\plus}q\left| {z_{i} } \right|^{3} {\minus}3q\left| {z_{i} } \right|}} $$
The standard errors are given by the inverse of the variance–covariance matrix:
 $$V={\minus}\left[ {\matrix{ {{{\partial ^{2} f} \over {\partial {\rm \alpha }^{2} }}} & {{{\partial ^{2} f} \over {\partial {\rm \alpha }\partial {\rm \beta }}}} \cr {{{\partial ^{2} f} \over {\partial {\rm \alpha }\partial {\rm \beta }}}} & {{{\partial ^{2} f} \over {\partial {\rm \beta }^{2} }}} \cr } } \right]^{{{\minus}1}} $$
 $$\eqalignno{ &{{\partial ^{2} f} \over {\partial {\rm \alpha }^{2} }}=3pq\mathop \sum\limits_{i=1}^n {{\left( {q\left| {z_{i} } \right|^{4} {\minus}2\left| {z_{i} } \right|{\plus}3q} \right)\left( {{\rm sgn}\left( {z_{i} } \right)} \right)^{2} } \over {\left( {1{\plus}q\left| {z_{i} } \right|^{3} {\minus}3\left| {z_{i} } \right|} \right)^{2} }}\cr &\qquad \quad {\minus}\left( {2p{\plus}3q} \right)\mathop \sum\limits_{i=1}^n {\rm \delta }\left( {z_{i} } \right)$$
 $$\eqalignno{ & {{\partial ^{2} f} \over {\partial {\rm \alpha }\partial {\rm \beta }}}=3pq\mathop \sum\limits_{i=1}^n {{x_{i} \left( {q\left| {z_{i} } \right|^{4} {\minus}2\left| {z_{i} } \right|{\plus}3q} \right)\left( {{\rm sgn}\left( {z_{i} } \right)} \right)^{2} } \over {\left( {1{\plus}q\left| {z_{i} } \right|^{3} {\minus}3\left| {z_{i} } \right|} \right)^{2} }}\cr &\qquad \, \, \, \quad {\minus} \left( {2p{\plus}3q} \right)\mathop \sum\limits_{i=1}^n z_{i} {\rm \delta }\left( {z_{i} } \right)$$
 $$\eqalignno{ & {{\partial ^{2} f} \over {\partial {\rm \beta }^{2} }}=3pq\mathop \sum\limits_{i=1}^n {{z_{i}^{2} \left( {q\left| {z_{i} } \right|^{4} {\minus}2\left| {z_{i} } \right|{\plus}3q} \right)\left( {{\mathop{\rm sgn}} \left( {z_{i} } \right)} \right)^{2} } \over {\left( {1{\plus}q\left| {z_{i} } \right|^{3} {\minus}3\left| {z_{i} } \right|} \right)^{2} }} \cr & \quad\quad \quad {\minus}\left( {2p{\plus}3q} \right)\mathop \sum\limits_{i=1}^n z_{i}^{2} {\rm \delta }\left( {z_{i} } \right)$$
To derive these formulae generalized functions have been used:
 $${\rm sgn}\left( x \right)=\left\{\!\!\!\!\!\!\!\!\! {\matrix{ { \ \,\,\,\,\,\,\,\,\,1 , \quad \!\!\!\!x\,\,\gt\, 0 } \cr { \quad \,\,\,\,\,0,\quad \!\!\!x=\!0} \cr \,\,\,\,\,\,{{\minus}1, \quad \!\!\!\!x\,\lt\, 0} \cr } } \right.$$
and δ(x) which is the δ function that is zero except at one point x=0 and where  $$\mathop{\int}\nolimits_{{\minus}\infty}^\infty {{\rm \delta }\left( x \right)dx=1} $$
. These expressions and the modulus function are connected by
 $$\eqalignno{ & {d \over {dx}}\left| x \right|={\rm sgn}\left( x \right)\cr &{d \over {dx}}{\rm sgn}\left( x \right)=2{\rm \delta }\left( x \right)$$
where the differentiation is taken in a generalized sense.
Since sgn(0)=0 and δ(z i)=0 for z i≠0 only one (but not both) of the terms on the RHS of equation (3a) is non-zero for each z i. Thus, the calculation of the information matrix V for the standard errors has to be made in the generalized sense if one of the z is is zero, as it generally appears to be in practice. Suppose that this happens at the k thz i. Then
 $$V={\minus}\left[ {\matrix{ {{{\partial ^{2} f} \over {\partial {\rm \alpha }^{2} }}} & {{{\partial ^{2} f} \over {\partial {\rm \alpha }\partial \beta }}} \cr {{{\partial ^{2} f} \over {\partial {\rm \alpha }\partial {\rm \beta }}}} & {{{\partial ^{2} f} \over {\partial {\rm \beta }^{2} }}} \cr } } \right]^{{{\minus}1}} $$
The matrix below is a term in V when z k=0,
 $${\minus}\left( {2p{\plus}3q} \right)\left[ {\matrix{ 1 & {z_{k} } \cr {z_{k} } & {z_{k}^{2} } \cr } } \right]{\rm \delta }\left( {z_{k} } \right)=\left( {2p{\plus}3q} \right)\left[ {\matrix{ 1 & 0 \cr 0 & 0 \cr } } \right]\delta \left( {z_{k} } \right)$$
where we have used xδ(x)=0, x 2δ(x)=0. This enables calculation of the information matrix V.
Appendix 3
A summary of the features of the author processed data downloaded from the NCBI repository GEO (http://www.ncbi.nlm.nih.gov/gds).
Appendix 4
Consider the bivariate methylation measurement probability density:
 $$P\left[ {z,y} \right]=Qp^{2} e^{{{\minus}p\left( {\left| z \right|{\plus}\left| y \right|{\plus}{\rm \theta }zy} \right)}} \left[ {1{\plus}q\left( {H_{3} \left( {\left| z \right|} \right){\plus}H_{3} \left( {\left| y \right|} \right)} \right)} \right]$$
where Q is a normalizing constant and H 3 represents the third-order Hermite polynomial. The cross-product in the Hermite polynomials is ignored as being of order q 2<<1. The dependency parameter in the bivariate probability densityis θ.
The normalizing constant Q is given by
 $$Q^{{{\minus}1}} =\mathop \int \limits_{{\minus}1}^1 \mathop{\int}\nolimits_{{\minus}1}^1 {p^{2} e^{{{\minus}p\left( {\left| z \right|{\plus}\left| y \right|{\plus}{\rm \theta }zy} \right)}} \left[ {1{\plus}q\left( {H_{3} \left( {\left| z \right|} \right){\plus}H_{3} \left( {\left| y \right|} \right)} \right)} \right]dz{\rm }dy} $$
Noting that the integral (4a) over the quadrant (z=0 1, y=0 1) equals the integral (4a) over the quadrant (z=−1 0, y=−1 0), and similarly the integral (4a) over the quadrant (z=−1 0, y=0 1) equals the integral (4a) over the quadrant (z=0 1, y=−1 0), then
 $$\eqalignno{ & Q^{{{\minus}1}} ={2 \over {p^{4} }}\mathop{\int}\nolimits_0^1 {{{e^{{{\minus}py}} } \over {\left( {1{\plus}\vartheta y} \right)^{4} }}\left[ {S_{1} \left( y \right){\minus}e^{{{\minus}p\left( {1{\plus}{\rm \theta }y} \right)}} S_{2} \left( y \right)} \right]dy } \cr & \quad \quad \quad {\plus} {2 \over {p^{4} }} \mathop {\int}\nolimits_0^1 {{{e^{{{\minus}py}} } \over {\left( {1{\minus}\vartheta y} \right)^{4} }}\left[ {S_{3} \left( y \right){\minus}e^{{{\minus}p\left( {1{\minus}{\rm \theta }y} \right)}} S_{4} \left( y \right)} \right]dy} $$
where
 $$\eqalignno{ & S_{1} \left( y \right)=\left( {1{\plus}{\rm \theta }y} \right)^{3} \left[ {p^{3} \left( {1{\plus}q\left( {y^{2} {\minus}3y} \right)} \right)} \right]{\minus}3qp^{2} \cr & \left( {1{\plus}{\rm \theta }y} \right)^{2} {\plus}6q $$
 $$\eqalignno{ & S_{2} \left( y \right)=p^{3} \left( {1{\plus}{\rm \theta }y} \right)^{3} \left( {1{\minus}2q} \right){\plus}6pq\left( {1{\plus}{\rm \theta }y} \right){\plus}6q{\plus}p^{3} q \cr & \left( {1{\plus}{\rm \theta }y} \right)^{3} \left( {y^{3} {\minus}2y} \right) $$
 $$\eqalignno{ & S_{3} \left( y \right)=S_{1} \left( y \right) \ {\rm with}\ {\rm \theta }\to{\minus}{\rm \theta } \cr & S_{4} \left( y \right)=S_{2} \left( y \right) \ {\rm with \ \theta }\to {\minus}{\rm \theta }$$
The bivariate probability density (eqn 2) with the normalizing constant given by equation (4b) can be formulated as a log likelihood for the parameter θ, and estimation of this parameter along with a likelihood surface can be calculated for a bivariate set of methylation data (z i, y i):
 $$\eqalignno{ & {\rm Log}\;{\rm likelihood}\left( {P\left[ {z,y} \right]} \right)=2n\ln \left( p \right){\plus}n\ln \left( {Q\left( {\rm \theta } \right)} \right){\plus}\mathop{\sum}\nolimits_{i=1}^n {\minus} \cr & p\left( {\left| {z_{i} } \right|{\plus}\left| {y_{i} } \right|{\plus}{\rm \theta }z_{i} y_{i} } \right){\plus}\ln \left[ {1{\plus}q\left( {H_{3} \left( {\left| {z_{i} } \right|} \right){\plus}H_{3} \left( {\left| {y_{i} } \right|} \right)} \right)} \right] $$
Note that the normalizing factor Q is now a function of the dependency parameter θ. The log likelihood (4c) can be maximized for θ numerically using non-gradient methods.