Introduction
Selenium (Se) is an essential trace element for both animals and humans. In farm animals, where the recommended dietary Se concentration is 0.3 mg/kg dry matter (DM) (National Research Council, 2001), its deficiency is associated with impaired growth, fertility and health in farm livestock (Schwarz and Foltz, Reference Schwarz and Foltz1957; Weiss et al., Reference Weiss, Todhunter, Hagan and Smith1990). However, in humans Se deficiency can, in extreme cases, cause severe cardiomyopathy (Kashan disease) and joint abnormalities (Kaschin-Beck disease). Additionally, Se supplements of 200 μg/day have shown reduced risks in the incidences of lung, prostate and colo-rectal cancers in humans (Combs, Reference Combs2001a). Rayman (Reference Rayman2000 and Reference Rayman2004) reported that between 1975 and 1995 Se intakes within the UK decreased from around 60 to 34 μg per person/day, which is approximately 50% of the recommended daily intake (Givens et al., Reference Givens, Allison, Cottrill and Blake2004).
While meeting the dietary Se requirements is important for livestock health, and has been associated with a reduction in somatic cell counts and the incidence of mastitis (Weiss et al., Reference Weiss, Todhunter, Hagan and Smith1990), Se supplementation of livestock diets may also enhance the nutritional quality of livestock products. Selenium supplements are in two principal forms, inorganic mineral salts such as sodium selenite (SS; Na2SeO3) or selenate (Na2SeO4), or organic forms such as Se-enriched yeasts (SY), in which selenomethionine (SeMet) is the predominant form of Se (Korhola et al., Reference Korhola, Vainio and Edelmann1986). In the European Union, both inorganic and organic Se sources are now approved for use and both have a maximum permitted dose rate of 0.568 mg Se/kg DM (Official Journal of the European Union, 2004 and 2006). This is higher than the limit of 0.3 mg Se/kg DM recommended in the USA (National Research Council, 2001) where both inorganic and organic sources of Se are also approved for use.
Numerous studies have now shown that when compared with SS, the use of SY increased the Se concentration in bovine milk (Knowles et al., Reference Knowles, Grace, Wurms and Lee1999; Ortman and Pehrson, Reference Ortman and Pehrson1999; Weiss, 2005; Juniper et al., Reference Juniper, Phipps, Jones and Bertin2006; Heard et al., Reference Heard, Stockdale, Walker, Leddin, Dunshea, McIntosh, Shields, McKenna, Young and Doyle2007) and caprine milk and cheese (Caja et al., Reference Caja, Flores, Salama, Salado and Bertin2007), and has been suggested as one potential route for increasing Se intake in humans in areas where it is below optimum.
Under normal dietary conditions, the majority of endogenous Se is present in body tissues and fluids as either selenocysteine (SeCys), which forms the functional core of selenoproteins, or SeMet, which can be incorporated non-specifically into general body proteins and act as a biological pool for Se (Suzuki and Ogra, Reference Suzuki and Ogra2002), which can be utilised during periods of suboptimal Se intake. Selenium absorption occurs in the small intestine and while SeMet is absorbed via the methionine transporter system, the absorption of inorganic Se such as SS is less efficient and occurs mainly by passive diffusion (Weiss, Reference Weiss2003). Irrespective of source, Se must undergo a metabolic transformation to selenide prior to its assimilation into SeCys and subsequent incorporation into selenoproteins via the UGA codon (Suzuki and Ogra, Reference Suzuki and Ogra2002). However, no such intermediate step is necessary for the incorporation of SeMet into general proteins.
Although improvements in analytical methodology have provided the opportunity to determine the contribution of specific Se fractions to total Se in livestock products, very little information has been published in this area. While preliminary work by Juniper et al. (Reference Juniper, Phipps, Jones and Bertin2006) reported that the use of SY markedly increased the concentration of SeMet in both whole blood and milk, when compared with SS, there are no reports in the literature on the effects that SY has on the SeCys content of whole blood and milk or in manufactured products such as cheese.
Whilst the current study was designed to provide further evidence on the effect of SY (Saccharomyces cerevisiae CNCM I-3060) and SS, and dose rate of SY on milk production, blood chemistry and haematology, the primary objective was to determine their effects on total Se, and the proportion of total Se comprised as SeMet and SeCys in whole blood, milk and cheese from high-yielding Holstein dairy cows and subsequent effects on the keeping quality and manufacturing properties of milk.
Material and methods
Cows, experimental design and diets
The work was conducted under the authority of the UK Animals (Scientific Procedures) Act 1986 (Home Office, 1986) and undertaken by staff holding appropriate licenses under the Act. All cows were housed in cubicle yards with sawdust for bedding and with ad libitum access to potable water.
After a 2-week covariate period, 40 multiparous Holstein cows (days in milk: 54 ± 8.5, BW: 647 ± 76 kg and milk yield: 38.1 ± 2.8 kg/day) were allocated on the basis of milk yield, parity and BW to one of four treatments for a 16-week continuous design study. A pre-designed blocking matrix was used to determine the treatment to which animals were assigned. For animals to be accepted within a block, they had to have calved within 28 days of each other, have milk yields and body weights within 3 kg/day and 50 kg, respectively, and be of the same parity.
All cows were offered a total mixed ration (TMR), which varied only in either source or concentration of dietary Se. The TMR contained maize silage, grass silage, cracked wheat, soyabean meal, rapeseed meal, sugar beet feed and minerals, which formed 375 and 125, 190, 100, 100, 95 and 15 g/kg of total dietary DM, respectively. The cracked wheat, soyabean meal, rapeseed meal and sugar beet feed were blended to produce a concentrate supplement, which was added as a single component to the TMR.
The mineral supplements (Dairy Direct International, Ashford, Kent, UK) used were based on a commercially available product and contained on a DM basis 270 g/kg calcium, 40 g/kg phosphorus, 60 g/kg magnesium, 40 g/kg sodium, 50 mg/kg cobalt carbonate, 500 mg/kg calcium iodate, 4000 mg/kg manganese oxide, 5000 mg/kg zinc oxide, 1500 mg/kg cupric sulphate, and 500 000IU/kg of vitamin A, 100 000IU/kg of vitamin D3 and 1000 IU/kg of vitamin E. All diets contained on average 7.5 and 4.7 g/kg of calcium and phosphorus, respectively. The mineral supplements used were produced as a single consignment. Samples (200 g/sample) were taken weekly and subsequently bulked on a monthly basis and analysed for total Se. The Se content of the mineral mixes was determined by treatment designation.
No additional Se was added to the mineral mix of T1, which acted as a negative control, providing a background dietary Se concentration of 0.16 mg/kg DM. In the case of T2 and T3, supplementary Se was provided in the form of SS and SY, respectively, to produce a total dietary Se concentration of 0.3 mg/kg DM, allowing a comparison of Se sources. A fourth treatment (T4) was included in which total Se dietary concentration was increased to 0.45 mg/kg DM by the further addition of SY (Sel-Plex®:Alltech, Nicholasville, KY, USA). Treatment 4 was included in the study in order to allow regression analyses to compare the dose response to increasing dietary Se in the form of SY (T1, T3 and T4), as there is only limited information for a dose response to increasing dietary Se in the form of SY.
Sampling procedures and measurements
Feed analyses
Grass and maize samples (250 g/sample) were taken twice weekly and frozen (−20°C). At the end of the study, these samples were bulked on a 14-day basis and analysed for nutritional and fermentation characteristics (Natural Resources Managements, Bracknell, UK). Oven-dried (60°C until static weight) silage samples were analysed for DM, CP, NDF, starch, water-soluble carbohydrates (WSC), using near infrared spectroscopy (Foss 5000 NIR Systems, York, UK). The metabolisable energy (ME) concentrations for grass silage, maize silage and concentrate supplement were estimated according to Offer et al. (1996) and Givens et al. (Reference Givens, Cottyn, Dewey and Steg1995). Gas chromatography (Agilent 6890 Series GC System, West Lothian, UK) was used to determine silage fermentation characteristics.
Concentrate blends were sampled once per week (250 g), and subsequently bulked on a monthly basis and analysed for DM, CP, NDF, starch, WSC, oil and ME content (Direct Laboratories, Wolverhampton, UK) using wet chemistry methods (Ministry of Agriculture Fisheries and Food, 1993). Samples of the four concentrate blends and the TMR for T1 were taken daily and bulked on a monthly basis and then sent to UT2A laboratories (Pau, France) for Se analysis. The results of the feed analyses were used to calculate the nutritional value of the TMR offered during the experimental period.
Feed intake
Fresh TMR were prepared daily and offered on an individual cow basis at 0900 h through an electronic feeding gate system (American Calan, Northwood, NH, USA). In order to ensure that cows had ad libitum access to the TMR, the amount offered to individual cows was assessed on a daily basis with the aim of producing a 5% to 10% refusal. Refusals were removed (0700 h) and measured three times a week (Monday, Wednesday and Friday). Individual mean daily feed intakes were calculated on a weekly basis by subtracting the refusals measured during that week from the total fresh TMR offered that week.
Milk yield and composition
Cows were milked twice daily through a 50-point Dairymaster Rotary milking parlour (Dairymaster, Causeway, Co. Kerry, Ireland). Individual milk yields were recorded automatically for all cows at each milking (0500 and 1500 h), and milk samples from all cows were taken weekly at two consecutive milkings (Tuesday p.m. and Wednesday a.m.) and analysed for fat, protein (total nitrogen × 6.38) and lactose concentration using an infrared milk analyser (Foss Electric, York, UK). These data were combined with the corresponding milk yields to produce mean weekly milk composition data. The yields of milk constituents were calculated using average weekly a.m. and p.m. milk yield and milk composition data.
Keeping qualities of milk and cheese manufacture
Seven cows were selected at random from each treatment. During the pre-treatment period and subsequently at 42, 70, 91 and 112 days of the experimental feeding period, a 100 ml milk sample was taken from each cow at the Wednesday a.m. milking. These samples were analysed for a range of physico-chemical properties and keeping quality parameters. The analyses included pH, titratable acidity, aroma, clots on boiling, ethanol stability and lactoperoxidase activity (Fweja et al., Reference Fweja, Lewis and Grandison2007). In addition, a bulked milk sample was prepared from the individual samples, for each of the four treatments, and these were then analysed for rennet clotting time (Storry et al., Reference Storry, Grandison, Millard, Owen and Ford1983) and total viable count (Marks et al., Reference Marks, Grandison and Lewis2001).
At day 112, approximately 100 kg of milk produced by cows receiving T1, T2 and T3 were used to produce a Caerphilly cheese as described by Jones et al. (Reference Jones, Shingfield, Kohen, Jones, Lupoli, Grandison, Beever, Williams, Calder and Yaqoob2005).
Blood chemistry and haematology
Blood samples were taken at the start of the study and at 14-day intervals thereafter via venepuncture of the tail vein. The samples taken at the start and end of the study period were used to provide a biochemical and haematological profile. The parameters measured included alanine transferase, glutamate dehydrogenase, albumin, globulin, urea, total protein, inorganic phosphate, creatinine phosphokinase, alkaline phosphatase, lactic dehydrogenase, aspartate aminotransferase (AST), gamma-glutamyl transferase, glucose and glutathione peroxidase (GSH-Px), while the haematological parameters included erythrocyte count, haemoglobin content, mean corpuscular volume, packed cell volume, mean corpuscular haemoglobin, thrombocytes, total leucocytes, segmented neutrophils, banded neutrophils, lymphocytes, monocytes, eosinophils and basophils. Standard analytical techniques were used for these analyses (Veterinary Laboratory Agency (VLA), Shrewsbury, UK).
Selenium analyses
Total Se concentration in TMR, whole blood and cheese samples was determined by mineralising 1 g of each sample in 4 ml of 16 M HNO3 and 2 ml of 9.8 M H2O2 within a closed-vessel heating block system. The solution was further diluted with water, and Se was subsequently determined using inductively coupled plasma mass spectrometry (ICP-MS) (Perkin Elmer Elan 6100 ICPMS, Massachusetts, USA).
Selenium speciation was determined using the method described by Bierla et al. (Reference Bierla, Vacchina, Szpunar, Bertían and Lobinski2008a and Reference Bierla, Dernovics, Vacchina, Szpunar, Bertían and Lobinski2008b). Samples were initially incubated for 5 h with dl-dithiothreitol and iodoacetamide to reduce and alkylate SeCys and then spiked with SeMet77 and subsequently incubated for 24 h at 37°C with a mixture of protease and lipase maintained at a pH of 7.5. Following incubation, the mixture was centrifuged and the supernatant separated and purified by cell exclusion liquid chromatography. Aliquots of the supernatant were analysed by reversed-phase HPLC-ICP-MS using an ICP-MS equipped with a collision cell (Perkin Elmer Elan 6100 ICPMS).
Feed samples prepared for routine analysis, as described above, were used to determine total dietary Se concentration. While whole blood and milk Se concentrations were determined for all cows at the start of the study and at 14-day intervals thereafter, SeMet and SeCys values for whole blood and milk were determined on bulked treatment samples at the start, middle and end (0, 56 and 112 days, respectively) of the study.
Statistical analysis
The experiment was a randomised block design with four dietary treatments and 10 early lactation cows/treatment, and lasted for 16 weeks. Cows were blocked on the basis of milk yield, parity and BW. These data were analysed using a general linear modelling procedure for a randomised block design, with repeated measures for some variates, using the statistical package Genstat 7 (Lawes Agricultural Trust, Rothamsted Experimental Station, UK, 2003). Pre-experimental data were used for adjustment by covariance if appropriate. The 5% level of significance was considered for the tests of significance. A comparison was made between treatments SS (T2) and SY (T3) using the Student’s t-test, as they had similar levels but different sources of Se. The dose response to the level of SY in the diet was considered for treatments T1, T3 and T4.
Results and discussion
Feed analyses
Based on the inclusion rates and monthly compositional analyses of the forages, concentrate and mineral supplements, the mean (±s.e.) DM, CP, ash, starch, WSC, NDF, oil and ME content of the TMR were 442 ± 15 g/kg, 179 ± 4, 81 ± 10, 246 ± 17, 44 ± 3, 303 ± 7 and 30 ± 1 g/kg DM, and 11.7 ± 0.2 MJ ME/kg DM, respectively. Prior to the start of the study, four samples of the SY (Sel-Plex®: Alltech; batch number SEK-168) used in this study were analysed and contained a total Se concentration of 2154 ± 46 mg Se/g DM. Analysis of a bulked sample of SY showed that 99% of the total Se content was in an organic form with 63% as SeMet and 36% as other organic Se components.
Feed intake and milk production
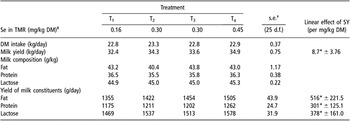
The results showed that the Se source did not significantly affect either DM intake or milk production (Table 1). Although these results confirm earlier studies by numerous workers including Givens et al. (Reference Givens, Allison, Cottrill and Blake2004), Juniper et al. (Reference Juniper, Phipps, Jones and Bertin2006) and Heard et al. (Reference Heard, Stockdale, Walker, Leddin, Dunshea, McIntosh, Shields, McKenna, Young and Doyle2007), milk yield responses to Se supplementation have been noted in New Zealand from cows grazing low-Se pastures (Grace et al., Reference Grace, Lee, Mills and Death1997). However, in the current study there was a significant (P < 0.05) positive linear effect of increasing Se supplied in the form of SY. This response is consistent with the results noted by Grace et al. (Reference Grace, Lee, Mills and Death1997) such that milk yields were markedly lower in the animals that received no Se supplementation.
Mean values for DM intake and milk production for animals receiving either no selenium supplementation (Treatment 1; T1) or sodium selenite (Treatment 2; T2) or increasing rates of selenised yeast (SY) in treatments 3 and 4 (T3 and T4) were determined in the 16 week study period

DM = dry matter; TMR = total mixed ration.
*P < 0.05.
†Standard error of mean of 10 cows.
‡Based on Se analyses of individual feed ingredients used in the TMR.
Qualities and physico-chemical properties of milk
Although there were a small number of differences, the keeping quality of milk produced by cows on all four treatments at each of the sampling dates was considered to be in the normal range (data not shown) and any differences were considered to have little biological significance. Data for rennet clotting time and alcohol stability showed no biologically significant treatment effects (data not shown), and indicated that all treatments produced milk with normal stability and processing properties.
Blood chemistry and haematology
As in an earlier study at Reading (Juniper et al., Reference Juniper, Phipps, Jones and Bertin2006), treatment effects on blood chemistry and haematology were small and considered to have limited biological importance as they were generally within the expected normal ranges (data not presented). However, it was noted that there was a significant positive linear effect (P < 0.05) of SY on AST activity (88.6 ± 38.39 U/l). Whilst an elevated level of AST, above normal range (45 to 110 U/l: Boyd, Reference Boyd1984), is an indicator of possible tissue damage in the liver and heart, AST is also indirectly involved in Se metabolism, as it converts alpha-ketoglutarate to glutamate during the metabolism of SeCys to selenide (Yasumoto et al., Reference Yasumoto, Iwami and Yoshida1979). Further work is needed to explore these relationships but the increase in the level of AST noted in the current paper is within the normal biological range and tissue damage is not expected.
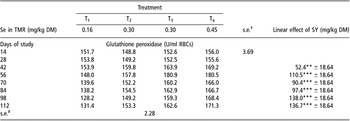
The activity of the selenoenzyme, GSH-Px, is often used as a measure of Se status. Table 2 shows that at each sampling point the values recorded for the cows receiving SS were all lower, when compared with a comparable dose of SY. The differences were significantly lower from day 56 of the study period. In addition, from day 42 there were positive linear effects (P < 0.01) of increasing Se supplied in the form of SY, on GSH-Px activity. These results would support the review by Weiss (Reference Weiss2003) in which 9 out of 11 studies noted higher GSH-Px activity in cows receiving SY compared with those receiving SS.
Mean values for glutathione peroxidase in blood for animals receiving either no selenium supplementation (Treatment 1; T1) or sodium selenite (Treatment 2; T2) or increasing rates of selenised yeast (SY) in treatments 3 and 4 (T3 and T4) were determined at 14 days intervals during the 16 week study period. Values adjusted by covariance on pre-experimental values

TMR = total mixed ration; DM = dry matter; RBC = red blood cell.
**P < 0.01; ***P < 0.001.
†Standard error of mean for comparison between two treatment means of 10 cows at a given time.
‡Standard error of mean for comparison between two time means of 10 cows on the same treatment.
Total selenium concentration in whole blood and milk
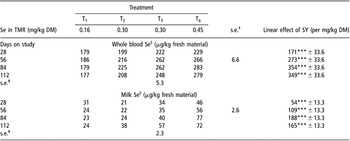
The total Se concentration measured at days 28, 56, 84 and 112 in whole blood and milk and the linear effects of increasing Se supplied in the form of SY are shown in Table 3. For both whole blood and milk, the lowest Se concentrations were recorded in T1, the negative control with no added Se supplement. Although the whole-blood Se content for the negative control (T1) remained relatively constant during the study period, the milk Se content declined from 31 to 24 μg/kg (−23%). This decline over time is probably a reflection of the fact that the dietary Se content for this treatment was markedly lower than the recommended level of 0.3 mg/kg (National Research Council (2001)).
Mean values for selenium (Se) in whole blood and milk were determined at 28 days intervals during the 16 week study period for animals receiving either no selenium supplementation (Treatment 1; T1) or sodium selenite (Treatment 2; T2) or increasing rates of selenised yeast (SY) in treatments 3 and 4 (T3 and T4)

TMR = total mixed ration; DM = dry matter.
***P < 0.001.
†Standard error of mean for comparison between two treatment means of 10 cows at a given time.
‡Standard error of mean for comparison between two time means of 10 cows on the same treatment.
§Values adjusted by covariance on pre-experiment values.
At each sampling point, Se source (T2v. T3) had a marked effect (P < 0.05) on total blood and milk Se concentrations with higher values recorded for cows receiving the diet containing SY. At day 112, concentrations of Se in the whole blood and milk of animals supplemented with SY (T3) were, respectively, 19% and 50% higher when compared with SS (T2). These results indicate that the use of SY improved Se uptake and subsequent assimilation, when compared with SS, and support earlier published studies for cows (Knowles et al., Reference Knowles, Grace, Wurms and Lee1999; Ortman and Pehrson, Reference Ortman and Pehrson1999; Givens et al., Reference Givens, Allison, Cottrill and Blake2004; Juniper et al., Reference Juniper, Phipps, Jones and Bertin2006) and goats (Caja et al., Reference Caja, Flores, Salama, Salado and Bertin2007). In addition, Table 3 shows that not only were the values for T3 significantly higher than T1 but also that increasing total dietary Se concentration through the use of SY resulted in positive linear effects (P < 0.001) on total Se content in whole blood and milk, at each sample date.
While changing Se source from SS (T2: 0.3 mg Se/kg DM) to SY (T3: 0.3 mg Se/kg DM), increased total milk Se content from 38 to 57 μg/kg milk at day 112 further increases in dietary Se in the form of SY (T4: 0.45 mg Se/kg DM) further increased milk Se concentration to 72 μg/kg milk. Thus, changing the Se source and increasing the Se inclusion rate (T2v. T4) produced an 89% increase in milk Se content.
Selenium speciation in blood, milk and cheese
Due to financial constraints, Se speciation analysis on blood, milk and cheese was undertaken only on bulked samples and therefore these data could not be statistically analysed. However, the results presented show a number of important trends that have not been reported previously.
Blood
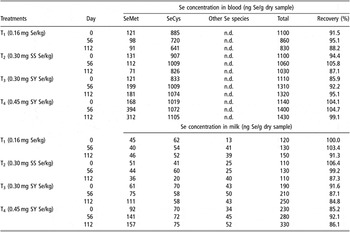
Table 4 shows that SeCys was the predominant selenised amino acid in all treatments at each sampling point. In T1, which received no Se supplementation, and T2, which received SS, the concentration of SeMet declined during the sampling period from 121 to 91 (−25%) and from 131 to 71 (−46%) ng Se/g while SeCys declined from 885 to 641 (−28%) and from 907 to 826 (−9%) ng Se/g, respectively. However, although both the SeMet and SeCys concentrations in T1 and T2 declined during the study, the proportions of SeMet and SeCys remained relatively similar, representing approximately 12% and 80% of the total Se concentration in whole blood.
The concentration of total selenium (Se) as selenomethionine (SeMet), selenocysteine (SeCys) and other Se species for bulked freeze dried blood and milk at days 0, 56 and 112 of the study from animals receiving either no selenium supplementation (Treatment 1; T1) or sodium selenite (Treatment 2; T2) or increasing rates of selenised yeast (SY) in treatments 3 and 4 (T3 and T4) were determined

n.d. = not determined.
In contrast, when comparing the Se source (T2: SS v. T3: SY), the values for SeMet and SeCys in whole blood were markedly higher for SY and increased during the sampling period from 121 to 181 ng Se/g (+33%) and from 833 to 1074 ng Se/g (+33%), respectively. As in the case of T1 and T2, the proportion of SeMet and SeCys in T3 remained relatively similar, representing about 13% and 80%, respectively, of the total Se concentration in whole blood.
Further increases were noted when the inclusion rate of SY was increased from 0.3 mg Se/kg DM in T3 to 0.45 mg Se/kg DM (T4). During the sampling period the whole-blood SeMet values in T4 increased from 168 to 312 ng Se/g (+72%), while the corresponding increase for SeCys was from 1019 to 1105 ng Se/g (+9%). When SeMet is expressed as a proportion of total Se, it had increased from approximately 12% in T1, T2 and T3 to 22%, while the proportion of SeCys remained similar to other treatments at approximately 80% of total Se. These results support the initial trends recently reported by Juniper et al. (Reference Juniper, Phipps, Jones and Bertin2006) and clearly reflect the fact that 63% of the Se in SY was in the form of SeMet. Other Se-containing species were not determined in whole blood.
Milk
In addition to the concentration of SeMet and SeCys, values for other Se species are presented for milk.
In T1, which received no Se supplementation, and T2, which received SS, the concentration of SeMet during the sampling period remained the same (45 to 46 (0%) ng Se/g) or declined from 51 to 36 (−30%) ng Se/g, respectively, while SeCys declined in T1 and T2 from 62 to 52 (−16%) ng Se/g and from 41 to 20 (−50%) ng Se/g dried sample, respectively. In contrast to the data presented above for whole blood, the proportion of SeMet and SeCys declined, during the sampling period, by between 7% and 20%; however, there was a compensatory increase in about 15% in the proportion of other Se species.
When comparing T2 and T3, the results showed that Se source had a marked effect on SeMet concentration. During the sampling period, the SeMet concentration in T3 increased from 61 to 111 (+82%) ng Se/g, which is in contrast to the decline reported above for T2. Thus at day 121, the SeMet concentration of milk produced by T3 was approximately three times higher (36 v. 111 ng Se/g) than T2 (SS). Unlike T2, where the proportion of SeMet decreased during the experimental period, the proportion of SeMet in total Se in milk produced by T3 increased from 32% to 44%. In contrast to these large increases in SeMet, the concentration of SeCys and the proportion of SeCys of total Se in T3 declined by 48% and 18%, respectively. While forming a significant proportion of total Se, the values for other Se species showed only modest changes in T3.
The highest inclusion rate of SY (T4) resulted in the SeMet concentration increasing during the sampling period from 92 to 157 ng Se/g (+71%) with a modest increase of 7% for SeCys but a substantial increase of other Se species (53%). As with T3, the proportion of total Se present as SeMet increased by 8% while there was a corresponding decline of 7% for SeCys.
The data presented on Se speciation in blood and milk in this paper are some of the most complete analyses conducted to date and show how the levels of the two selenised amino acids and other unidentified Se fractions were affected by both Se source and the inclusion rate of Se in the form of SY and how they vary between whole blood and milk. The authors recognise that while the SeMet content is approximately 63% of the total selenium in SY, it is noted that SeCys is the major component of selenised amino acid in whole blood. It might be assumed that the greater SeCys content of blood is indicative of selenoprotein activity as SeCys forms the functional core of selenoenzymes. However, as SeMet is not associated with selenoenzymes, it may cross the capillary endothelium through active transporter mechanisms and be subsequently incorporated into body proteins. As suggested by Pehrson (Reference Pehrson1993), the increased Se concentration in milk derived from diets containing SY is likely due to the preferential mammary gland uptake of SeMet, which is readily incorporated into milk protein. The results presented also show that in milk, between 15% and 36% of total Se was in the form of other Se species. The exact nature and function of these compounds are unknown at present, and further work is needed to identify the structure and functions of these Se fractions.
Cheese
Table 5 shows the Se speciation of Caerphilly cheese made from milk produced from T1, T2 and T3 at the end of the study. The results showed that there was little difference between T1 and T2 with the SeMet, SeCys and other Se species representing 27% to 31%, 24% to 29% and 28% to 31% of total Se concentration, respectively. However, replacing SS in T2 with SY in T3 increased SeMet, SeCys, other Se species and total Se concentration from 57 to 153 (+168%), 52 to 92 (+76%), 50 to 63 (+26%) and 180 to 340 (+88%) ng Se/g, respectively. The change from using SS to SY also resulted in SeMet representing a markedly higher proportion of total Se compared with SS (45 v. 32%). The behaviour of milk from the three different treatments during the cheese-making process was normal in all cases. Similar increases in Se concentrations in fresh cheese manufactured from caprine milk in response to dietary SY were reported by Caja et al. (Reference Caja, Flores, Salama, Salado and Bertin2007).
The concentration of total selenium (Se) as selenomethionine (SeMet), selenocysteine (SeCys) and other Se species for cheese produced at day 112 from milk produced from cows receiving either no selenium supplementation (Treatment 1; T1) or sodium selenite (SS) (Treatment 2; T2) or selenised yeast (SY) in treatments 3 (T3) were determined

DM = dry matter.
Potential increase in Se intake for humans
The most recent data from the UK National Diet and Nutrition Survey (Henderson et al., Reference Henderson, Gregory and Swan2002) show that the average adult aged between 19 and 64 years consumed 48, 126 and 31 g/day of whole milk, semi-skimmed milk and skimmed milk, respectively. When applying the Se content of milk produced in the current study to adult daily milk consumed, replacing SS (T2) with the highest inclusion rate of SY (T4) increased the human Se intake from 8.3 to 15.6 μg/day. This increase of 7.3 μg/day associated with consuming milk produced by cows receiving the highest dose of SY represents approximately a 20% increase in the estimated human daily consumption of 34 μg/day (Rayman Reference Rayman2000), and further increases would also occur if Se-enriched cheese was consumed.
The results of the current study and recent work by Juniper et al. (Reference Juniper, Phipps, Ramos-Morales and Bertin2008) showed that the use of SY increased the concentration and proportion of SeMet in muscle, milk and cheese, indicating its accumulation in the general protein pool when compared with SS. The greater proportion of total Se comprised as SeMet is attributed to the fact that over 63% of the SY supplement comprises SeMet and to the fact that it is readily absorbed from the gastro-intestinal tract via the Methionine-active transporter system. It has been suggested (Spears and Hansen Reference Spears and Hansen2008) that at least a proportion of the SeMet in non-specific proteins are released during normal protein turnover and can be used in the synthesis of GSH-Px. Thus the increased concentration of SeMet derived through the use of SY may provide a continuing supply of Se during periods of suboptimal intake and may contribute to improved health.
It is suggested that this is a possible route to increase Se intake in humans, which has been estimated to be low in several countries (Combs, Reference Combs2001b). Recent work by Heard et al. (Reference Heard, Stockdale, Walker, Leddin, Dunshea, McIntosh, Shields, McKenna, Young and Doyle2007) emphasised that if the objective was to produce high-Se products for human consumption then it was important that they are produced in a consistent and predictable manner. While their work showed a very rapid increase in milk Se concentration, which peaked after 7 to 15 days of Se supplementation, the current study in which Se analyses started only after 28 days of supplementation showed that milk Se concentration peaked much later, between 84 and 112 days after treatment initiation. The reason for the difference in these results in not clear but further work is required to provide information on the predictability of product quality.
Conclusions
While the Se source did not significantly affect milk production, increasing the inclusion rate of Se in the form of SY produced a significant positive linear effect on milk yield. Blood chemistry and haematology showed few significant treatment effects. When compared with SS, at a comparable Se inclusion rate, the use of SY significantly increased the total Se concentration in blood, milk and cheese and indicated improved bioavailability of the Se derived from SY. Selenium speciation showed that while the concentration of SeCys was higher than SeMet in blood, the reverse was true for milk, and that when the dietary inclusion rate was increased from 0.3 to 0.45 mg Se/kg DM by the use of SY, the concentration of SeMet was markedly increased, 111 v. 157 ng Se/g. Other Se species constituted between 16% and 36% of the total Se, but little is known of their structure and functionality. The significant increase in milk and cheese total Se concentration associated with replacing SS with SY could help to meet the deficit in Se intake that currently exists in a number of European countries.
Acknowledgements
The authors thank Alltech (EU Regulatory Affairs Department) for financial support to conduct the study and Ms Sarah Potterton and Mr Jon Siviter for technical help in conducting the study and to Mrs Rosemary Elliott for the statistical analyses. The authors would also like to give special thanks to Ryszard Lobinski (UT2A laboratories) for performing the selenium analyses.