Introduction
Teachers are essential actors in education, but the history of education has largely concerned educational institutions over the actors. Although Sohn (Reference Sohn2012, Reference Sohn2013, forthcoming) recently paid more attention to them, relatively little attention has been paid to teachers in the history. Thus, it is not surprising that a systematic attempt to understand their migration patterns is lacking. Recently, a shared understanding has emerged concerning these patterns. That is, migrant teachers preferred urban to rural areas; if teachers migrated, their destinations were located mainly in the Midwest. Further, migrant teachers generally came from the Northeast. However, the evidence is scattered in the literature and largely qualitative.
The aim of this paper is to provide a unifying understanding of their migration patterns based on quantitative and nationally representative data. It is important to know about migrant teachers because they brought educational tools and institutions with them. In turn, they influenced the quality and quantity of education at their destinations. Some examples include pedagogy, texts, feminization, and salary levels. They also brought noneducational institutions; religion is a well-known example, but other examples include lifestyles and medical knowledge, which also influenced culture and living standards at the destinations. Understanding their migration patterns helps us appreciate the transmission of educational and noneducational tools and institutions.
This paper draws on the US census, 1860–80, to describe the migration patterns of young, white, female teachers. When feasible, linked samples of the census for 1870–80 are also employed for checking robustness. The time frame selected reflects the patterns before the Civil War, during Reconstruction, and immediately after Reconstruction. The period is of interest for the following reasons. First, it was characterized by mass migration to the West, and teachers have been reported as following migrants. Second, the migration of teachers to the South after the Civil War has been documented widely, so it is of interest to examine the prevalence of the Southern movement and changes in their migration patterns during the period. Although this paper deals primarily with young, white, female teachers, the attention does not mean that older, white, female teachers, white male teachers, and black teachers did not play important roles in education. A simple reason for the selection is that white female teachers constituted the majority of teaching staff during the period. A thematically more important reason is that historiography pays special attention to them, a characteristic driven partly by feminism (e.g., Prentice and Theobald Reference Prentice, Theobald, Prentice and Theobald1991). However, some light is shed on other teacher groups before this paper is concluded.
At the outset, three points are worth noting. First, the power of this paper lies in the description of the general patterns of teachers’ migration across the country over time in a consistent manner. In research of this type, it is inevitable that depth is traded for breadth; consequently, some details are omitted and some numerical estimates may be erroneous. However, much effort has been made to avoid substantive omissions and errors. This paper should be seen from this perspective; thus, patterns rather than numerical points are highlighted. As the analysis proceeds, patterns emerge that make sense. Second, migration in this paper does not refer only to permanent migration. This reference is too narrow, particularly for female teachers during the period because their relatively short careers made transient migration common. Third, although this paper elucidates the migration of teachers, emphasis is placed on migration rather than on teachers. Discussing both equally would lengthen this paper inordinately, and the data do not provide enough information about each teacher to warrant such discussions. Thus, detailed descriptions of teachers before and after migration are left for future research.
Our quantitative findings are largely consistent with the understanding in the literature. This paper finds that, although teachers as a whole were found more often in rural areas than nonteachers, migrant teachers were located more in urban areas than nonmigrant teachers. Another finding is that the Southern movement was never popular. Most teachers migrated to the Midwest. In addition, teachers born in the Northeast migrated more than others, and among them, teachers born in Massachusetts were the most mobile; even when compared with a similar group, they were more than twice as likely to migrate.
Literature Review
Direct research on the migration patterns of female teachers in the United States for the period 1860–80 is lacking, to the best of our knowledge. It is only possible to reach a shared understanding by gleaning qualitative and rare quantitative pieces of evidence scattered in the literature, along with inferences from institutional developments in education. This section is not intended to cover all relevant studies but to illustrate how evidence must be interpreted to gain the current perspective.
Kaufman (Reference Kaufman1984: xviii, 226) provided a good example of qualitative research on the issue. She reconstructed the lives of single women who were sent west as teachers by the National Board of Popular Education and its Boston affiliate in the decade following 1846. She vividly described their lives based on letters, diaries, and missionary reports, but for our purposes, her appendix is helpful. She identified the home states of 203 of the nearly 600 women. Vermont accounted for the largest proportion with 29 percent, closely followed by New York with 25 percent and Massachusetts with 20 percent. If the National Board reflected the general migration patterns of female teachers, it can be inferred that they generally came from the Northeast and migrated to the Midwest. Perlmann and Margo (Reference Perlmann and Margo2001: ch. 3) devoted an entire chapter to migration in their book, and their study is of some interest because they employed the US census instead of qualitative sources. Migration described in the chapter, however, does not directly concern the migration of teachers; it concerns the migration of settlers and its relationship with the feminization of teaching at their destinations. If female teachers followed settlers, however, this study also implies that they migrated mainly to the Midwest because the direction of mass migration was generally west, not south.
In addition, there is much evidence that urban educational systems originating in the Northeast started to spread to the Midwest and eventually across the entire states (e.g., Jeynes Reference Jeynes2007; Tyack Reference Tyack1974). This evidence suggests that the Northeast probably played an important role in sending teachers west. Moreover, urban wages were higher for teachers than rural wages (Coffman Reference Coffman1911: 39), and urban schools provided better teaching environments. In addition, urban life was probably more enjoyable for single women. These better characteristics of cities and schools in urban areas imply that teachers preferred to migrate to urban over rural areas.
Butchart (Reference Butchart2010: 20) provided a thought-provoking case in the context of migration. He collected information about a large number of teachers of freed people in the South for the period 1861–76. With regard to their origins, he only identified whether a teacher came from the North or the South; among white teachers whose race was known, 66.2 percent came from the North. The dichotomization was appropriate for his purposes, but it is too crude for our purposes. Also, because teachers of the freed people constituted a small special group, it is difficult to generalize their experiences.
More studies can be cited, but the conclusion would be the same: it is necessary to provide a unifying understanding of the migration of female teachers during the period, based on quantitative and nationally representative data. At the same time, it would be of some interest to systematically check whether such quantitative data support evidence that has been accumulated qualitatively and intermittently.
Feminization of Teaching
Because the focus of this paper is female teachers, a discussion of the feminization of teaching during (and after) the period places this issue in a broader historical context. The underlying context is the consideration of women as the weaker sex. This consideration has persisted in human history, and it remains a major issue even today. A more specific application of this context to teaching in the nineteenth century was manifested in the crowding of women into teaching. While more women became educated, few remunerative opportunities besides teaching were available to them. When they crowded into teaching, wages were driven down (Carter Reference Carter1986). As a result, women were readily available as cheaper replacements for men as teachers, once opportunities availed themselves. Before the Civil War, the maintenance of order in classrooms was a main duty of teachers, but the prejudice prevailed that women could not discharge the duty for older boys. Thus, they generally taught small children during the summer, while men taught older children during the winter. However, the Civil War provided an influential and widespread opportunity to tap into the pool of educated women. Many male teachers left teaching to fight, and they did not return to teaching; thus, the demand for female teachers inevitably grew (Jeynes Reference Jeynes2007: 158–59; Perlmann and Margo Reference Perlmann and Margo2001: 106–7).
The war shifted the gender balance in teaching from men to women, but influential educational reformers also provided a supportive social environment for hiring women over men. The most famous reformer was Horace Mann, then secretary of the Massachusetts Board of Education. One of his rhetorical questions represents his attitude toward hiring women for teaching: “Has not the Author of nature preadapted her, by constitution, and faculty, and temperament for this noble work [teaching]?” (cited from Hoffman Reference Hoffman2003: 4). In addition, Henry Barnard justified hiring women for a financial reason—two women could be hired for the price of one male teacher (MacDonald Reference MacDonald1999: 433). Not only men but women reformers also favored hiring women. For example, Catherine Beecher wrote voluminously on women as “true” or “born” teachers (e.g., Hoffman Reference Hoffman2003: 66–78). The war affected the entire country, as did educational reformers who laid the foundation for American public education. Vacancies in teaching caused by the war and demands for women supported by reformers provided potential and existing teachers with the opportunity for migration. The results in the following text need to be understood in this context.
Data
One percent samples of the US census for 1860 and 1870 and a 100 percent sample for 1880 constitute the main data for this paper. Note that the 1880 sample is not a sample because it includes the entire population. Because of the naming convention, however, it is referred to as a sample here. The three samples are representative of the entire country. The variables have been adjusted to be as consistent as possible over time. Unlike qualitative sources, these characteristics of the census provide a systematic view of migration patterns. Panel data are more suitable for migration studies, and linked samples were constructed for the census. For brevity, explanations on the linked samples have been deferred.
A teacher in this paper is defined as a worker whose occupation is classified as a “teacher (n.e.c.)” according to the 1950 Census Bureau occupational classification system (OCC1950). Further restrictions are as follows: her industry being “educational services” according to the 1950 Census Bureau industrial classification system (IND1950), residing in noninstitutions, and participating in the labor force.Footnote 1 Because few teachers were bound by the additional restrictions, the restrictions do not change the substance of the results.Footnote 2
One concern about the definition of a teacher is that the occupational classification may not be applied consistently over time in spite of the harmonized occupational coding. Changes in universe and coding regarding the collection of occupational information may result in biases in comparisons. However, changes that took place were immaterial for this paper. For example, the universe concerned free persons aged 15 and above in 1860, but it changed to all persons in 1870 and to persons aged 10 and above and others with a regular occupation in 1880. Because this paper concerns only the white race, the exclusion of slaves is inconsequential. In addition, education requirements for teaching increased the average age of novice teachers, so the age restriction might have been minimally binding. Moreover, it is difficult to understand how such a well-known occupation could be misclassified except for random errors.
A more relevant concern is that during the period, it was not uncommon for teachers to engage in other occupations such as farming, bell ringing, and grave digging. However, the focus on a primary occupation, which is provided by the occupation variable in the census, would not lead to any significant bias in the results. Moreover, it is unlikely that a second job would affect such an important decision as migration, especially for women who did not have many occupational opportunities. A further concern is that a person was listed as a teacher in one source but something other than a teacher in another source. For example, Weiler (Reference Weiler1998: 109) found that 51 teachers were listed in the 1880 census for Tulare and Kings counties, but 81 teachers were listed in school records. In addition to the total number of teachers, the sex ratio could be biased because of omissions from the census of this occupation of women. In this case, female teachers would be underrepresented; if the omission was not random, the migration patterns could be biased. For example, if omitted teachers were more likely to migrate, the degree of migration would be biased downward. Weiler (Reference Weiler1998: 110) recognized that the Tulare County school records included 107 women and 37 men, whereas the corresponding figures in the 1900 census were 74 and 32. The inconsistency, however, does not suggest necessarily that the census data are incorrect. It is equally likely that other sources are incorrect. It is also possible that all sources are correct, especially for short-term work such as teaching. For example, even if a school record identified a woman as a teacher for a given year, she might not have considered herself a teacher, if she did not teach during the year. School records might also be outdated. In a sense, the census may reflect reality better because the woman or another who knew her well reported her occupation to the enumerator.
A potential migrant is defined in this paper as an unmarried woman who lived with nonrelatives or in group quarters, and this definition closely follows the description of migrant teachers in qualitative sources within the scope of the census.Footnote 3 Of course, some married women migrated, leaving their families behind, but our definition would misclassify them as nonmigrants. As far as white female teachers are concerned, however, the restriction of nonmarriage is trivial because the marriage bar prevented a married woman from becoming or remaining a teacher. For example, in the 1880 sample, only 3.5 percent of young, white, female teachers were household heads or spouses. Alternatively, suppose that a certain unmarried woman moved away from her parents to a nearby place with nonrelatives. In this case, she would have been misclassified as a migrant. Yet this should not distort the patterns of long-distance migration, which is the focus of this paper.
In this paper, three types of migration are identified depending on the distance covered, and it is assumed implicitly that migration is related to the occupation. If the birth state and the residence state of a potential migrant born in the United States differ, it is defined that an interstate migration took place. Similarly, if the birth region and the residence region of a potential migrant born in the United States differ, it is defined that an interregion migration took place. Finally, if a potential migrant is born abroad, it is defined that an intercountry migration took place. It is admitted that the definitions are imperfect, and the imperfections can be attributed primarily to the cross-sectional nature of the data. Suppose that a woman followed her parents to another state, region, or country as a child, but continued to reside there. Similarly, it is possible that a woman followed her husband to another state, region, or country, where she became a widow and acquired a job. Both migrations were unrelated to the occupation, and occupation-related migrations were mixed with nonoccupation-related migrations. Furthermore, it is unknown whether an interregion migration was made as a one-step migration or a series of interstate migrations. Finding satisfactory solutions is difficult, but the last two concerns are addressed to some extent by restricting the sample to young women. Therefore, caution is suggested when one interprets the results. It needs to be stressed, however, that the data allow us to investigate the migration patterns in greater breadth than in previous studies.
Results
Sample Selection
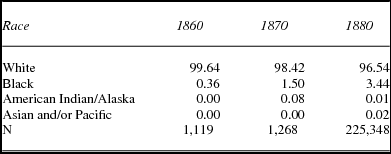
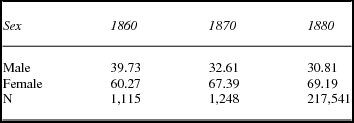
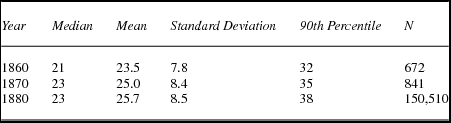
This paper concerns white female teachers aged 15 through 35 for the period 1860–80. They have garnered substantial attention in the history of US teachers during the period partly because of the feminist perspective of researchers in the field and because of available historical sources. These women, who constituted a large group of teachers, left a substantial number of letters, diaries, memoirs, and missionary reports. Table 1 shows that almost all teachers were white. Statistics for 1860 may be ignored because OCC1950 concerns only free persons, but 98.4 percent of teachers were white in 1870; in 1880, 96.5 percent were white. When white teachers are identified by gender (table 2), the percentage of women grew from 60.3 percent in 1860 to 69.2 percent by 1880, reflecting the increasing feminization of teaching. Further, table 3 demonstrates that most white female teachers were young: their median age in 1860 was 21, increasing only to 23 in 1870 and 1880. Hence, the cutoff age of 35 reduces some concerns mentioned in the preceding text, while maintaining the main body of teachers.
The racial composition of teachers

Source: US Census.
Notes: Samples consist of 1 percent samples for 1860 and 1870 and a 100 percent sample for 1880. The sample is restricted to teachers in the labor force residing in noninstitutions.
The gender composition of white teachers

Source: US Census.
Notes: Samples consist of 1 percent samples for 1860 and 1870 and a 100 percent sample for 1880. The sample is restricted to white teachers in the labor force residing in noninstitutions.
The age statistics of white female teachers

Source: US Census.
Notes: Samples consist of 1 percent samples for 1860 and 1870 and a 100 percent sample for 1880. The sample is restricted to white female teachers in the labor force residing in noninstitutions.
One may wonder how the migration patterns of teachers differed from those of a comparison group. If the patterns of both groups are similar, the conclusion would simply be that teachers behaved just as the comparison group. If the patterns differ, a search for the reasons would be in order. Comparison groups can vary depending on the purposes at hand. This paper addresses differences in migration patterns for teachers and women in similar situations, so the comparison group consisted of white women in the labor force aged 15 through 35 who resided in noninstitutions. Teachers were excluded from the comparison group.
Migration Patterns by Urban and Rural Areas: Cross-Section Samples
Evidence suggests that female teachers, migrants or not, taught mainly in rural areas (Jeynes Reference Jeynes2007; Perlmann and Margo Reference Perlmann and Margo2001). They were in the majority particularly compared to male teachers in rural areas, mainly because wages were lower there. Although Coffman (Reference Coffman1911: 39) was not directly concerned with the period of interest for this paper, he provided comprehensive information on wage differences between rural and urban areas in a survey in 1910: the median salary of women in rural schools was $366, whereas the figure for women in city schools was $591. Lower wages in rural areas made teaching there unattractive to men, who had more remunerative options outside schools. By contrast, women did not have many career choices, so they taught in rural areas for lower wages (Perlmann and Margo Reference Perlmann and Margo2001: ch. 4). Even considering higher costs of living in urban areas, the wage gap must have been large because teachers were said to use assignments in rural areas as stepping-stones for teaching jobs in urban areas (Carter and Savoca Reference Carter and Savoca1992).
When migrant teachers are compared with nonmigrant teachers, however, the former were more likely than the latter to teach in urban areas. Because migration was costly, compensation at the destination had to cover the related costs. On top of that, compensation had to exceed migration costs. If the compensation was barely enough to cover expenses, there was no incentive to move in the first place. Other forms of compensation in urban areas included longer school terms, better facilities, better support systems, freedom from the necessity to “board around,” independence, job stability, and better teaching supplies. Given higher wages and other forms of compensation in urban areas, it is not surprising that migrant teachers would choose urban over rural areas. Moreover, the longer the distance to cover, the more appealing urban areas would be.Footnote 4
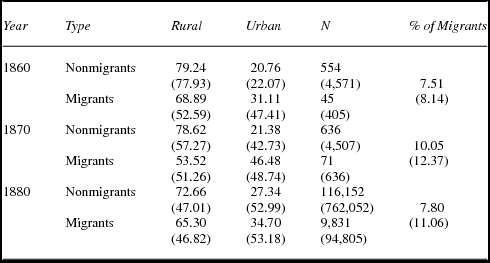
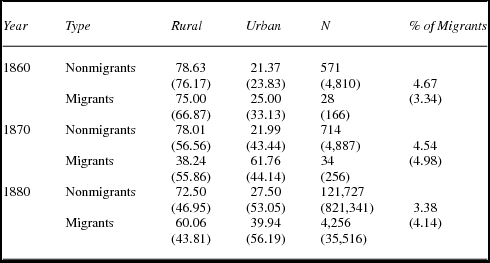
Table 4 describes the interstate migration patterns by urban and rural areas. Three points stand out. First, more migrant teachers were located in urban areas than nonmigrant teachers. Even if figures for 1860 and 1870 are put aside because of the small sample sizes, figures for 1880 indicate that 34.7 percent of migrant teachers worked in urban areas as opposed to 27.3 percent of nonmigrant teachers. Second, teachers were less likely to migrate than the women in the comparison group (see figures in parentheses in table 5). The difference was modest in 1860, but it had grown by more than three percentage points by 1880. Although the differences for 1860 and 1870 are not definitive because of the small sample sizes, the sample size is large enough for 1880 to make the difference plausible. Third, the teacher group was more oriented to rural areas than the comparison group. For example, about three-fourths of the teachers worked in rural areas in 1880, whereas slightly less than half of the comparison group did. These points agree with the literature and support the conjecture that teachers would not move unless they expected better prospects.
The patterns of interstate migration of white female teachers

Source: US Census.
Notes: Samples for the table consist of 1 percent samples for 1860 and 1870 and a 100 percent sample for 1880. The sample is restricted to native-born white female teachers in the labor force aged 15 through 35, residing in noninstitutions. Numbers in parentheses refer to the comparison group; the comparison group consists of native-born white women in the labor force aged 15 through 35, residing in noninstitutions. Teachers are excluded from the comparison group.
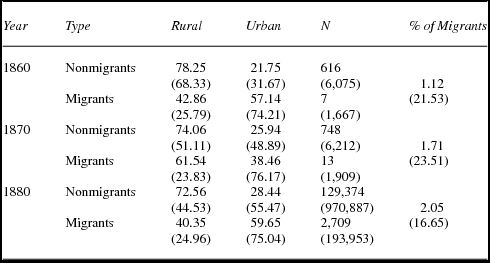
Longer-distance migrations are considered in table 5, yet the general patterns remain the same. One important point is that the urban orientation of migrant teachers is greater. For example, 39.9 percent of migrant teachers worked in urban areas in 1880, whereas only 27.5 percent of nonmigrant teachers did. Recall that the figures for interstate migration are 34.7 percent and 27.3 percent, respectively. It seems that when teachers migrated over longer distances, they were more likely to settle in urban areas. This finding is consistent with the preceding conjecture. Other things being equal, the costs of migrating over a long distance would be prohibitive unless a woman was assured of offsetting compensation. More pay in urban areas was probably an important compensatory attribute.
The patterns of interregion migration of white female teachers

Source: US Census.
Notes: Same as the notes of table 4.
The patterns of intercountry migration presented in table 6 reinforce this argument. Because only seven teachers in the 1860 sample and 13 teachers in the 1870 sample are migrants in this sense, figures for both years are unreliable. When attention is turned to the 1880 sample, one can immediately recognize that the urban orientation of migrant teachers is more pronounced: 59.7 percent of migrant teachers worked in urban areas, whereas only 28.4 percent of nonmigrant teachers did. One interesting point is that few women crossed the national borders to teach. This point is consistent with the fact that immigrants during the period had low levels of education (Daniels Reference Daniels2002: part II).
The patterns of intercountry migration of white female teachers

Source: US Census.
Notes: Same as the notes of table 4, except that the samples of both teacher and comparison groups include foreign-born workers.
Higher wages and other forms of compensation in urban areas have been suggested as explanations for the preference of migrant teachers for urban areas. Of course, these are not the only reasons, but they are convincing ones. It could be argued that when rural areas were more closed to outsiders than urban areas, migrant teachers as outsiders would prefer urban areas. Alternatively, as is explained in the following text, most migratory teachers came from the Northeast in general and Massachusetts in particular, both of which were characterized by advanced urbanization. Hence, teachers might have been just attracted to areas similar to sending areas. Both arguments may explain why migrant teachers chose urban areas more often than nonmigrant teachers but may not explain why the choice of urban areas was stronger, when the distance covered was longer. If rural areas were closed to outsiders, the exclusion must have affected everyone outside the small areas. In this case, whether teachers migrated from different states, regions, or countries, they would have been excluded equally from these destinations. Similarly, if an urban affinity typically led migrant teachers to urban destinations, they would have equally preferred urban areas, whether they crossed state, region, or national boundaries. Thus, these alternative explanations cannot explain the positive relationship between the distance covered and the urban preference, leaving the story of higher compensation in urban areas plausible.
Migration Patterns by Urbanity: Linked Samples
Panel data are useful for understanding migration patterns. Forty years ago, Thernstrom (Reference Thernstrom1973) used panel data to estimate frequencies of migration in Boston. Recently, the 100 percent sample for 1880 has been linked to 1 percent samples for 1850–1930, so the samples are useful for our purposes. At first glance, the linked samples seemed methodologically superior to the cross-section samples. That may not be the case, however. One source of bias is that women who married at some point between the sample year and 1880 were omitted from the samples. Therefore, some teachers are excluded. A more serious concern is that the linked samples allow us to understand migrations that took place only between 1860 and 1880 or between 1870 and 1880; migrations from some prior date until 1860 or 1870 are undocumented. In addition, women who immigrated or emigrated at some point between the sample year and 1880 are omitted from the samples. Biases arising from omissions are important because the period under review is characterized by mass immigration, and immigrants were not distributed randomly.Footnote 5 Consequently, the omissions rule out charting the patterns of intercountry migrations, and teachers in the linked samples cannot be compared directly to those in the cross-section samples. Because the shortest time window is 10 years and because few women taught more than 10 years, concerns raised for the cross-section samples apply similarly to the linked samples.Footnote 6 For example, teachers who migrated but quit before 1880 are excluded. Similarly, women who migrated for nonteaching reasons but who were teachers in 1880 are counted as migrant teachers. More important, the sample sizes are too small for our purposes. Even without the age restriction, the teacher sample size is only 904 (all whites), thus preventing us from performing detailed analyses. Nevertheless, for robustness checks, the linked samples are used for the migration patterns of teachers by urban and rural areas. If these checks are to yield results similar to those from the cross-section samples, then more confidence can be placed in the latter.
To minimize possible biases, the shortest time window that the linked samples allow is examined: 1870–80. The samples are restricted as before, but some definitions are modified slightly. First, the definition of a potential migrant from the data section is ignored, and an interstate migration is said to have taken place when the residence state in 1870 differed from that in 1880 (i.e., simple definition of an interstate migration). Interregion migration is defined similarly. The main advantage of this definition is its simplicity. Recall that when the cross-section samples are used, only native-born individuals are considered for interstate and interregion migrations because the definitions of both are related to nativity. With use of the linked samples, however, the definitions are free of nativity, and its restriction is not applicable.
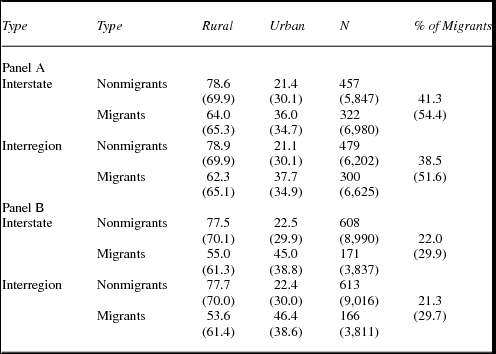
Panel A of table 7 shows that the proportion of migrant teachers in urban areas is higher than that of nonmigrant teachers. Some differences are acknowledged. That is, the proportion of migrant teachers in urban areas is higher than that of the comparison group, regardless of interstate or interregion migrations. In addition, the proportion of migrants in the linked samples is much higher than that found in the cross-section samples, whether they are teachers or not.
The patterns of migration of white female teachers in 1880: Linked samples

Source: US Census.
Notes: The linked samples of the census for 1870–80 are used. The samples are restricted as explained in the notes of table 4. The only difference is that the samples of both teacher and comparison groups include foreign-born workers. For panel A, the definition of a potential migrant made in the data section is ignored, and interstate migration is said to take place, when the residence state in 1870 differed from that in 1880. Interregion migration is defined similarly. For panel B, the definition of a potential migrant is applied. Numbers in parentheses refer to the comparison group.
The differences result partly from the fact that the definition of a potential migrant is not applicable. Among teachers who completed interstate migrations according to the simple definition, 34.8 percent lived in nuclear families and 9.0 percent lived with relatives in 1880. The figures are similar for teachers who made interregion migrations according to the simple definition. It is difficult to imagine that household heads or relatives migrated, following their daughters or female relatives. It is possible that teachers migrated to live with their relatives, but it is rare to find this situation in the literature. In any case, they were numerically unimportant. To be more consistent with the literature and the data sections, the definition of a potential migrant is applied for panel B.
Compared with the results in panel A, panel B demonstrates that the preference of migrant teachers for urban areas is stronger regardless of the distance covered. Because the definition of a migrant is tighter, it is logical that the proportion of migrants is just about half of that for panel A, but the proportions are still higher than those found in the cross-section samples. Panel B suggests that the migration patterns examined in the cross-section samples do not distort reality considerably. Because the linked samples have their own sources of bias, however, the size of distortion is not known.
Bilateral Interregion Migration Patterns
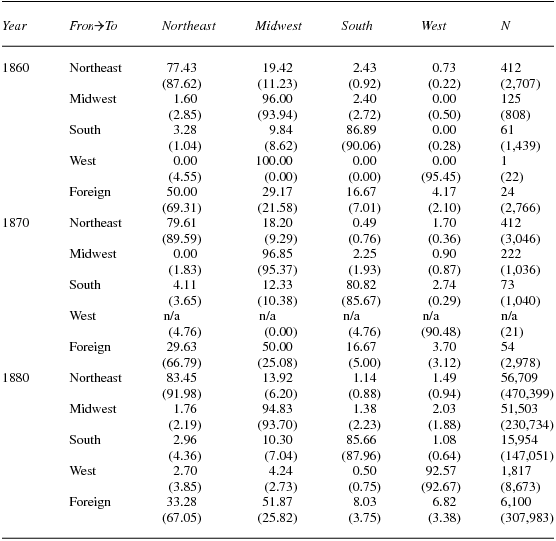
The previous two subsections focused on whether teachers tended to migrate to urban or rural areas, but migration extends beyond urban preference to the originating location of the migrant. The small sample sizes prevent detailed matrices of migration such as a state-by-state matrix, so table 8 provides a region-by-region matrix. For all years, teachers born in the Northeast led in migrations, and the absolute majority went to the Midwest. Only 77.4 percent of teachers born in the Northeast were found in the same region in 1860. More interesting, the absolute majority went to the Midwest: 19.4 percent of teachers born in the Northeast, or 86.0 percent of migrant teachers born in the region. Even when compared with the comparison group, teachers born in the Northeast were more mobile: up to 87.6 percent of the comparison group was found in the same region. The high mobility of teachers born in the Northeast might have contributed to the coinage of “Yankee schoolmarm.” One twist here is that the phenomenon of Yankee schoolmarms was more relevant to the Midwest rather than to the South. Even during Reconstruction, for which much has been discussed about Yankee schoolmarms in the South (Jones Reference Jones1980; Morris Reference Morris2010; Swint Reference Swint1967), the Midwest still attracted the majority of teachers from the Northeast; the South was less, not more, favored even compared with the comparison group. The small sample sizes for both years do not seem to distort the general patterns. Despite differences in specific numbers, the same patterns are observed for 1880.
The patterns of bilateral interregion migration of white female teachers

Source: US Census.
Notes: Same as the notes of table 4.
By contrast, the least migratory group included teachers born in the Midwest, and their patterns closely followed those of the comparison group. The small sample sizes for 1860 and 1870 prevent a meaningful analysis of teachers born in the South and the West. In 1880, the migration patterns of teachers born in both regions closely followed those of the comparison group. In contrast, the patterns of teachers born abroad deviated considerably from those of the comparison group. More foreign-born teachers went to the Midwest than to the Northeast, contrasting with the comparison group: 51.9 percent of foreign-born teachers moved to the Midwest in 1880, whereas only 25.8 percent of the comparison group did. However, the corresponding figures for the Northeast are 33.3 and 67.1 percent. It is unclear what pulled or pushed foreign-born teachers to the Midwest. Had the reason been associated with the general labor market, the patterns of both teacher and comparison groups would have been similar. A possible reason is the rapid expansion of the public school system in the Midwest during the period (Lindert Reference Lindert2004: ch. 5), which is consistent with our findings that almost all migrant teachers born in the Northeast migrated to the Midwest; teachers born in the Midwest migrated the least; and the majority of foreign-born teachers moved to the Midwest.
Ranks of Sending States in the Northeast
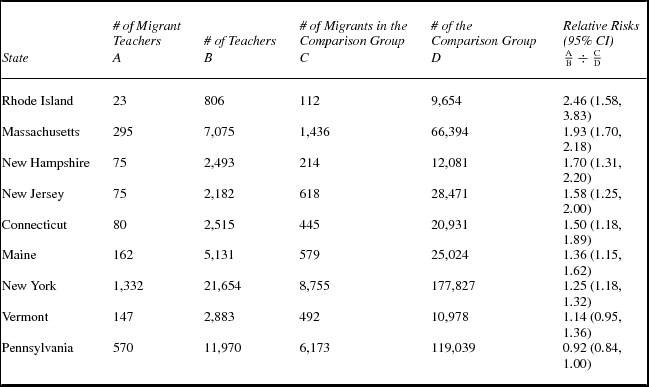
The previous subsection shows that teachers born in the Northeast were represented the most in the migratory group. The next task is to identify the state in the region that exhibited the highest migration rate. One simple yardstick would be a ratio of migrant teachers to all teachers:
 $\frac{{\rm A}}{{\rm B}}$
following the column headings in table 9. However, this measure does not reflect the migratory tendency of workers born in the state. For example, if some circumstances unrelated to teaching caused workers born in Massachusetts to become more mobile, this measure exaggerates mobility of teachers in the state. A relative risk controls for state-specific migratory tendency, calculated by
 $\frac{{\rm A}}{{\rm B}} \div \frac{{\rm C}}{{\rm D}}$
following the column headings in table 9. A relative risk of larger than one indicates that the teacher group born in the state is more migratory than the comparison group, and a relative risk of smaller than one has the opposite interpretation.
Relative risks of teacher migration by birth state in 1880

Source: US Census.
Notes: Same as the notes of table 4, except that only the 100 percent sample for 1880 is used. CI refers to confidence interval.
Rankings shown in table 9 are based on the relative risks of teacher migration in 1880; 95 percent confidence intervals are estimated as suggested by Morris and Gardner (Reference Morris and Gardner1988). Rhode Island exhibited the highest relative ratio. However, this ratio is unreliable because of the small number of migrant teachers born in the state; the 95 percent confidence interval indicates that the ratio could be any number between 1.58 and 3.83 with the level of confidence. Another indicator of its unreliability is that when the 10 percent sample for 1880 is examined (not shown), there is only one migrant teacher born in the state, which makes the state rank last. Massachusetts ranks second among Northeast states for sending teachers, and its relative ratio (1.93) suggests that teachers born there were twice as likely to migrate as those in the comparison group. Furthermore, in the 10 percent sample (not shown), Massachusetts ranks first. Because of its large sample size, the confidence interval is narrow: 1.70–2.18. Other small states follow Massachusetts, but the small numbers of migrant teachers make the rankings unreliable. Even when relatively large states such as New York and Pennsylvania are considered, however, Massachusetts is far ahead of them; its relative ratio is statistically significantly different from those of the two states.
A lack of relevant variables in the census makes it difficult to understand why Massachusetts stood out among states in the Northeast. Its early, intense emphasis on education could be an important reason. First in the United States, the Massachusetts Law of 1642 ordered that all children should be taught to read. Again, first in the United States, Massachusetts Law of 1647 mandated the establishment of elementary schools for children in all towns and secondary schools for youth in larger towns. The state's status as a leader in the advancement of education continued for many years beyond the beginning of public education in the United States. One can easily cite some of the major education reforms under Horace Mann's guidance when he served on the state's Board of Education between 1837 and 1848 (e.g., Tyack Reference Tyack1974; Vinovskis Reference Vinovskis1972).
At the same time, Massachusetts enacted the first child labor law in 1842 and the first compulsory school attendance law in 1852. One may suspect that the laws were not strongly enforced, but whether strictly enforced or not, the enactments demonstrated the early interest of Massachusetts in education. Even without considering the laws, the outcomes of mass education in the state were superior. One measure is high school attendance rate; it is more accurate than the high school enrollment rate because it was common for enrolled students to not show up at schools. The first public high school in the United States opened in Boston in 1821; even in the antebellum period, the rate of high school attendance in Massachusetts was much higher than in other states. Vinovskis (Reference Vinovskis1988) estimated that 19 percent of all children in Essex County, Massachusetts, in 1860 ever attended public or private high schools. Further, nearly one out of every six children of unskilled fathers attended high school at least in a medium-sized city—Newburyport, Massachusetts. The proportion was much higher in small towns with high schools. Both findings are surprising because, during the period, high school attendance was considered rare and reserved typically for children from affluent families; high school attendance rates were no more than 4 percent in nineteenth-century San Francisco and less than 1 percent in antebellum Philadelphia.
Massachusetts also led the state normal school movement (Wright Reference Wright1930).Footnote 7 James G. Carter of Lancaster attempted to secure seminaries for teachers in 1824. After 15 years of his ceaseless efforts, Lexington Academy, the first state-funded normal school in the United States, was established in Lexington in 1839. Immediately afterward, two more state normal schools opened in Barre and Bridgewater. Some years later, another state normal school was founded in Salem in 1854. Almost the same time, however, state normal schools opened in other states in Albany, New York in 1845; Philadelphia, Pennsylvania in 1848; New Britain, Connecticut in 1849; and Ypsilanti, Michigan in 1849. Furthermore, it was the exception rather than the rule to find teachers who graduated from normal schools at the time. For example, Bernard and Vinovskis (Reference Bernard and Vinovskis1977) estimated that graduates from normal schools in antebellum Massachusetts accounted for only 6.3 percent of the state's teachers, or 16.4 percent of its annual number of new teachers entering the classroom.
Of course, the leading position of Massachusetts in the normal school movement, instead of the number of normal schools per se, is evidence of the state's advanced system of teacher training. The early emphasis on education and teacher training explains why there were many teachers in the state, but it does not clarify why teachers born in the state were more mobile. It is still possible that the emphasis on education led to the oversupply of teachers in Massachusetts and that some of the teachers migrated to the Midwest, where more teachers were sought. This argument would be convincing if the migration patterns had been temporary. However, the direction of teachers’ migration from the Northeast to the Midwest persisted throughout the period of interest. If people had anticipated the oversupply of teachers, the pattern would not have lasted more than 20 years, especially because of the effectiveness of teacher labor markets during the period. Carter (Reference Carter1986) showed that the large number of female students in 1860 led to lower wages for female teachers in 1870, and lower wages led to smaller class sizes. Finally, smaller class sizes led to improved school attendance. Beadie (Reference Beadie2008) argued that markets for private education functioned well even during the early national and antebellum periods. Now, the burden is explaining why the labor market for teachers in Massachusetts did not clear itself. Searching for the answer is beyond the scope of this paper. Despite the reservations, however, given the early development of the education system and the high rate of high school attendance in Massachusetts, the oversupply of teachers in Massachusetts seems to be a convincing explanation at present.
Related to the oversupply, Massachusetts might have specialized in “exporting” teachers. In fact, there were organizations in Boston that sent teachers to other regions. One notable example is the Ladies’ Society for the Promotion of Education at the West in Boston, which merged with the National Board of Popular Education in 1852. Yet, the location of the organization did not guarantee that teachers born in that state migrated more than others. Recall that teachers born in Vermont migrated more than other teachers sent by the National Board of Popular Education. Organizations dispatching teachers also existed in other states. For example, the American Missionary Association in New York contributed to the educational progress in the South by founding more than 500 schools and colleges for freedmen during and after the Civil War, but New York fell far behind Massachusetts in the rankings (Drake Reference Drake1957: 198). Even if the locations of teacher-sending organizations had been important, it is doubtful that teachers sent by these organizations accounted for a large proportion of the nation's teaching staff. Hence, it is uncertain why teachers born in Massachusetts migrated the most. More mundane factors such as supply of and demand for teachers in both sending and receiving states might have been causes. However, data for confirming the hypothesis have not been found, and the absence is likely to persist for some time.
Other Female Teachers
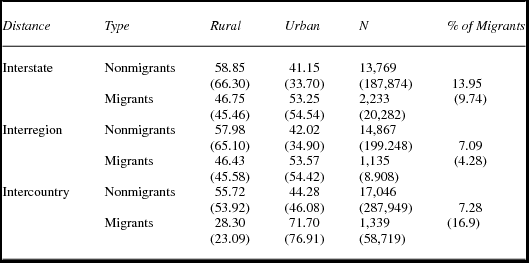
At the beginning, this paper explains why young, white, female teachers are of primary interest. However, as urbanization progressed, white female teachers of advanced ages (defined as aged 36 and older in this study) remained in teaching and constituted an important group. For example, organized activities for equal pay for equal work were based mainly in cities; at the turn of the twentieth century, famous organizers included Margaret Haley in Chicago and Kate Hogan in New York. Table 2 shows that the 90th-percentile age of white female teachers in 1880 was 38 (i.e., six years older than in 1860). However, this age group was a minority even in 1880. The 1860 and 1870 samples do not provide insight into their migration patterns, but some understanding can be obtained from the 1880 sample. In addition, as opposed to the younger group, some of the concerns raised about the definitions of migration cannot be addressed easily for this group. Longitudinal surveys could help identify their characteristics, but unfortunately, the linked samples do not contain information about length of tenure in teaching. One way of gaining insight into the issue is to analyze the 100 percent sample for 1880, assuming that age reflects the length of tenure in teaching. With the same definitions of migration and a similarly defined comparison group for young, white, female teachers, table 10 lists their migration patterns by urban and rural areas; this distinction is at the center because this group is usually considered along with urbanization. Compared with young, white, female teachers (tables 4–6), the most significant feature of this group is their conspicuous presence in urban areas. Recall that the young teacher group worked more in rural areas than the comparison group. By contrast, the older teacher group worked in urban areas as much as their comparison group, regardless of the migration distance covered. Naturally, the older teacher group migrated to cities more than the younger group. For example, regarding interstate migration, 53.3 percent of the former moved to cities, whereas only 34.7 percent of the latter did. Therefore, despite some concerns regarding the sample, the results are consistent with the literature that urban female teachers enjoyed long tenures (MacDonald Reference MacDonald1999).
The migration patterns of white female teachers aged more than 36 in 1880

Source: US Census.
Notes: Same as the notes of table 4, except that ages range 35 and higher and only the 100 percent sample for 1880 is used.
As time passed, the proportion of black teachers increased. Table 1 shows that although their proportion relative to the number of white teachers remained meager, it increased from 0.36 percent in 1860 to 3.44 percent in 1880. Among teachers who taught black students during Reconstruction, they constituted about half (Butchart Reference Butchart2010: 180). Their importance can be seen not only from their numbers but also from their teaching environments. Under the Jim Crow laws, their teaching environments deteriorated severely. For example, the ratio of black to white per-pupil expenditures on instruction started at 1.01 in North Carolina circa 1890 but dropped to 0.54 in about 20 years. In Florida, the ratio was already miserable at 0.49 circa 1890, and it plummeted to 0.28 over 20 years (Margo Reference Margo1990: ch. 2). In a sense, black teachers were heroes who contributed to the educational progress of blacks under adverse circumstances (Anderson Reference Anderson1988). In the context of migration, Butchart (Reference Butchart2010: 180) provided surprising and interesting figures; black teachers accounted for 18.6 percent of northern teachers whose races were identified. The proportion was much higher than that of the general population. Unfortunately, the sample for 1860 does not include black teachers, and that for 1870 does not have a sufficient number of black teachers. Even with all ages considered, the sample size for 1880 is small: 3,167. In addition to the small sample size, the same concerns raised for older, white, female teachers apply to this black group because female black teachers of all ages are considered.
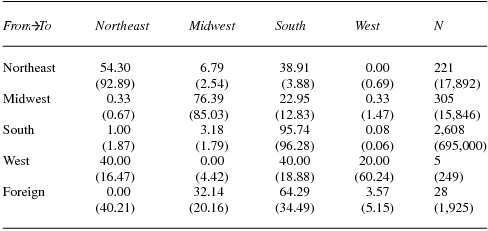
Nevertheless, it is of interest to understand their migration patterns. The interest of their migrations relates more to interregion features than to urban-rural orientations; table 11 charts their interregion migration patterns. The definitions of migration are the same as for young, white, female teachers, and their comparison group is defined similarly. One obvious point is that almost all of them were born and taught in the South. Another interesting point is that like young, white, female teachers, black female teachers born in the Northeast were the most mobile: only 54.3 percent born in the Northeast remained in the same region. More important, black female teachers born in other regions also migrated to the South. For example, 38.9 percent of those born in the Northeast migrated to the South. The figure for the Midwest (23.0 percent) is slightly smaller but substantial. Their movement to the South is peculiar compared with the comparison group. Note that only 3.9 percent of Northern-born black workers moved to the South. The behavior of the comparison group is reasonable given the inhumane treatment that they would face in the South. This finding is surprising, but it is difficult to explain the distinct pattern of black female teachers.
The patterns of bilateral interregion migration of black female teachers of all ages in 1880

Source: US Census.
Notes: Same as the notes of table 4, except that ages are unrestricted; race is black; and only the 100 percent sample for 1880 is used.
Conclusions
Migrations of teachers in the past have important implications for the evolution of the education system because they brought educational tools and institutions with them. Despite their importance, few attempts have been made to understand their migration patterns systematically. The general picture emerges only when inferences are made from evidence that is scattered in the literature and largely qualitative. This paper provides a unifying understanding of their migration patterns based on the US census of 1860–80, and the findings are consistent with the literature to a large extent. First, when teachers migrated, they moved to urban over rural areas; more pay and other forms of compensation in urban areas are considered to be the main reason. Second, teachers born in the Northeast migrated more than those from other states, with most of them going to the Midwest; the Southern movement was never widespread even during Reconstruction. Third, teachers born in Massachusetts migrated the most among teachers born in the Northeast; teachers born in New York were more mobile than their comparison group, but much less mobile than teachers born in Massachusetts. The oversupply of teachers in the state seems the main thrust, but reservations have been noted.
This paper initiates quantitative research on the history of teacher migration in the United States. Like most initial studies, there are limitations, and the findings in this paper are tentative. Attempts have been made to minimize biases inherent in the sample selection as far as the data allow, and justifications have been offered for each phase of the sample selection. Admittedly, definitions for teacher, potential migrant, and types of migration are not ideal. Most of the concerns associated with this study result from the cross-sectional, long-interval nature of the data. Longitudinal research is rare in the history of education and even more so for the history of teacher migration. Granted, it would be an enormous contribution to the literature if historical sources—qualitative or quantitative, or local, regional, or national—are uncovered to check our findings.