1 Introduction
Health-care financing reforms have received considerable attention in recent years in developing countries, including Africa (Leighton, Reference Leighton1995, Reference Leighton1996; Liu and Mills, Reference Liu and Mills2002; Gilson et al., Reference Gilson, Doherty, Lake, McIntyre, Mwikisa and Thomas2003). The issues involved include sustainability, efficiency, equity, political influence and the role of different actors. Although many developing countries still struggle to achieve a better system of health financing (Leighton, Reference Leighton1996), out-of-pocket (OOP) payments which are then not reimbursed by any prepayment scheme remain substantial (Daniels et al., Reference Daniels, Bryant, Castano, Dantes, Khan and Pannarunothai2000; Falkingham, Reference Falkingham2004). Some of the widely recognized obstacles to health financing reforms include political instability, policy conflicts, weak institutional capacity, poor economic conditions, actors’ buy-in, incomplete health sector development and information constraints (Leighton, Reference Leighton1996; Gilson et al., Reference Gilson, Doherty, Lake, McIntyre, Mwikisa and Thomas2003). Recently, given the reliance of developing countries on foreign aid, the current global financial meltdown has prompted intense debate about the impact on the poor in developing countries (Mooney and Ataguba, Reference Mooney and Ataguba2009). A learning process is however underway in Africa in the light of what countries such as Ghana and Rwanda have achieved through health financing reforms. Particularly, crucial in any reform is the question of addressing the huge financial burden some financing systems place on the poor and vulnerable.
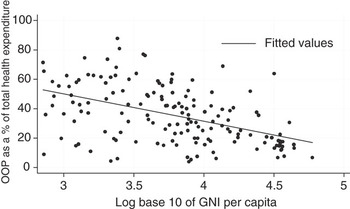
The link between poverty and ill-health (Wagstaff, Reference Wagstaff2002) is often exacerbated by the health-care payments faced by the poor. OOP payments as a proportion of total health-care financing are generally higher the poorer the country (see Figure 1). In many countries as shown in Figure 1, OOP payments exceed 40% of total health-care expenditure and can be as much as 90% (WHO, 2008). Within countries OOP payments are often regressive.
Relationship between out-of-pocket payments and gross national products of countries, 2005.

This raises the issue of ‘catastrophic’ health-care payments which has been much discussed in the literature (Kawabata et al., Reference Kawabata, Xu and Carrin2002; Ranson, Reference Ranson2002; Wagstaff, Reference Wagstaff2002; Wagstaff and van Doorslaer, Reference Wagstaff and van Doorslaer2003; Xu et al., Reference Xu, Evans, Kawabata, Zeramdini, Klavus and Murray2003; McIntyre et al., Reference McIntyre, Thiede, Dahlgren and Whitehead2006; van Doorslaer et al., Reference van Doorslaer, O'Donnell, Rannan-Eliya, Somanathan, Adhikari, Garg, Harbianto, Herrin, Huq and Ibragimova2007; Lu et al., Reference Lu, Chin, Lic and Murray2009). The focus on such payments originated in the United States, with various States implementing ‘catastrophic’ health insurance plans in the 1970s and 1980s (Pediatrics, 1987). These were drawn up to ease the financial problems for households incurring ‘catastrophic costs’. A household was eligible for publicly financed catastrophic health insurance benefits when the family spent about 10% or more of its annual income on health care (Pediatrics, 1987). A paper by Wyszewianski usefully distinguished between financially catastrophic and high-cost health-care expenditures, with the former having the added dimension of being large relative to the ability to pay – with a threshold set at 15% of annual family income (Wyszewianski, Reference Wyszewianski1986). Subsequent consideration of this issue used panel data sets to monitor trends over time but this research still tended to use rather ill-defined thresholds (Feenberg and Skinner, Reference Feenberg and Skinner1994).
Later, work in the United States defined a threshold for categorizing catastrophic costs as that level of household OOP payments that is high enough to lower a family's living standard ‘significantly’, for example, by 10% of household income (Prescott and Pradhan, Reference Prescott and Pradhan1999; Wagstaff and van Doorslaer, Reference Wagstaff and van Doorslaer2003) or 40% of household non-food expenditure (Wagstaff and van Doorslaer, Reference Wagstaff and van Doorslaer2003) or 40% of household capacity to pay (by the WHO; see Kawabata et al., Reference Kawabata, Xu and Carrin2002). Recently too the question of which items legitimately make up OOP payments to assess catastrophe has been addressed (Lu et al., Reference Lu, Chin, Lic and Murray2009). These authors note that the measurement of catastrophic payments can be sensitive to both the number of items involved and the recall periods for collecting OOP payments as reported by individuals. This paper however does not probe into that issue.
Thus in defining catastrophic health-care payments, there remains a lack of a consensus as to what the appropriate threshold proportion of incomeFootnote 1 should be. Ranson (Reference Ranson2002: 615) defined costs as catastrophic ‘when they consume >10% of the person's annual household income’. The World Health Organization defined catastrophe in relation to impoverishment noting that ‘[f]amilies that spend 50% or more of their non-food expenditure on health are likely to be impoverished as a result’. The WHO also recognized that the ‘high potential for financial catastrophe has much to do with how the health system is financed, and not only with the overall level of spending or the income of the country’ (WHO, 2000: 36 [emphasis added]). In general, the WHO argues that health-care expenditure is catastrophic when it exceeds 40% of the capacity to pay (see Kawabata et al., Reference Kawabata, Xu and Carrin2002).
It is perhaps inevitable that the poor and lower income groups (Kawabata et al., Reference Kawabata, Xu and Carrin2002; Wagstaff and van Doorslaer, Reference Wagstaff and van Doorslaer2003) are more likely to suffer serious financial hurt as a result of OOP payments. On this issue, Su et al. (Reference Su, Kouyaté and Flessa2006: 21) note that ‘[e]ven relatively small expenditures on health can be financially disastrous for poor households. This is because almost all their available resources are used for basic needs and they are thus less able to cope with even very low health expenditures compared to richer households’. Further, WHO consider that ‘[o]ut-of-pocket payment is usually the most regressive way to pay for health, and the way that most exposes people to catastrophic financial risk’ (WHO, 2000: 113). While sometimes, to take account of the impact on the poor, catastrophe may be computed based on, for instance, household non-food expenditure, this approach is not followed through to address how it might be translated into a workable policy by explicitly assessing catastrophe. To do this clearly requires that the assessment of catastrophe involves some greater distinction being made between poor and non-poor individuals (Su et al., Reference Su, Kouyaté and Flessa2006). Policy measures thus need to be devised to help to protect those on the lower rungs of the society. This requires therefore that, in devising such policies, there is first adequate quantification of the incidence of catastrophic payments.
This paper argues therefore that ‘fair’ indices of catastrophic payment require explicit recognition of diminishing marginal utility of income and should incorporate a vertical equity (VE) principle. Defining catastrophe as a fixed proportion of income or expenditure, irrespective of the level of income, is thus deemed inadequate. Previous studies have attempted to develop general indices for catastrophe (e.g. Wagstaff and van Doorslaer, Reference Wagstaff and van Doorslaer2003), and those which reflect catastrophic costs for the poor in such a way as to ‘capture the degree to which catastrophic health spending is concentrated among the poor’ (Wagstaff and van Doorslaer, Reference Wagstaff and van Doorslaer2003: 922). However, the indices reflecting the concentration of catastrophic costs among the poor are based on weighting those categorized as making catastrophic payments. They ignore those, particularly the poor, who are faced with but then do not make such payments. This paper aims to examine such indices and how best to assess them.
Ideally to address this issue satisfactorily what are required are normative weights based on informed citizens’ preferences which reflect their degree of concern about inequity (see e.g. Mooney, Reference Mooney2009). These would depend on how compassionate the society is. An alternative is to present sets of statistical weights to decision makers who would then exercise their judgment on behalf of society to determine which set of weights to use. Included in these statistical weights and a possible choice for the normative weights would be current conventional fixed percentage thresholds. But the likelihood that the fixed percentage thresholds would be chosen in either case seems unlikely.
In this paper, we use statistical weights to generate different thresholds for different levels of income. These are then applied to a data set from Nigeria – one of the developing countries with high OOP payments.
The next section of the paper briefly discusses the need for consideration of VE in assessing catastrophic payments. Section 3 shows the derivation of the proposed rank-dependent weights to be applied. Section 4 introduces the modified measures of catastrophic payment based on a rank-dependent threshold. In Section 5, the proposed measures are applied to data from Nigeria. The conclusion follows thereafter.
2 Why VE in catastrophic health-care payments?
Assessing a health-care financing system, like a tax system, rests on the two fundamental principles of efficiency and equity (Kutzin, Reference Kutzin2001; Duclos and Araar, Reference Duclos and Araar2006). While in its simplest sense, efficiency is related to value for money or the allocation of resources according to the likelihood of success, equity in health-care financing focuses on how health is financed according to the ability to pay (Wagstaff and van Doorslaer, Reference Wagstaff and van Doorslaer2000). Health economists have often argued for equity to take center stage in health care (Mooney, Reference Mooney1996; Wagstaff and van Doorslaer, Reference Wagstaff and van Doorslaer2000). In this regard, Mooney (Reference Mooney1996: 99) notes that ‘[o]ne would hope that a greater proportion of health economists’ efforts might go in the direction of research on equity in the next decade’. Equity can be divided into VE and horizontal equity (HE). The VE principle involves unequal but equitable treatment of unequals or reducing welfare gaps between unequal individuals (Mooney, Reference Mooney1996). In health-care financing, this requires that individuals with different abilities to pay (or income) pay appropriately different amounts for health care. The HE principle requires that individuals or groups with the same ability to pay (or who share the same level of welfare before any health-care payments) make the same contribution to health care (Culyer and Wagstaff, Reference Culyer and Wagstaff1993; Wagstaff and van Doorslaer, Reference Wagstaff and van Doorslaer2000; Cissé et al., Reference Cissé, Luchini and Moatti2007).
The operation of the HE principle is rarely questioned but policy analysts disagree on the degree to which the VE principle could and should be implemented and how great any differential payments would be that would constitute VE (Mooney, Reference Mooney1996: 101). Decisions on this are likely to vary from society to society depending, for example, on how compassionate a society is. It can be argued that the HE principle hinges on the moral idea that all human beings are worth the same. This is what drives the equal sacrifice theory of taxation (Duclos and Araar, Reference Duclos and Araar2006).
Depending on how equity is defined, progressivity and the redistributive effects of health-care financing system will vary. While progressivity is normally related to the VE principle, redistribution can also occur under the HE principle (Wagstaff and van Doorslaer, Reference Wagstaff and van Doorslaer2000). A health-care financing system (or indeed any financing mechanismFootnote 2) is said to be progressive if any payment as a proportion of an individual's income rises with income or some other measure of living standard (Cissé et al., Reference Cissé, Luchini and Moatti2007). A progressive health-care financing system, therefore, makes the distribution of post-payment incomes ‘more equal’ than the distribution of prepayment incomes. The greater the progressivity, the more ‘inequality-reducing’ it will be. Another way to express this is to argue that any ethical measure of what might be termed ‘hurt’ arising from health-care payments will focus on the vertical ethical principle and recognize that ‘hurt’ – or in extremis catastrophe – will vary by income.
Note that hurt here is conceived to be higher for the poor than for the rich for any given percentage share of income paid for utilizing health services. The distinction provided by Wyszewianski (Reference Wyszewianski1986) and noted above is important here. Some costs can be high but not catastrophic. It is the psychological hurt – the damaging impact of a particular amount of costs – that costs impose that is the issue.
It is thus proposed that, from an ethical perspective, ‘catastrophic health-care payments’ should incorporate the notion of VE in health finance. We start from the definition provided by Wagstaff and van Doorslaer (Reference Wagstaff and van Doorslaer2003) that catastrophic health-care payments result when a household spends, above a specified threshold, z% of their income or y% of total non-food expenditure on OOP payments. The idea of some threshold or other is not questioned in this paper. What is questioned is the assumption that the percentage be constant across all households or individuals, an assumption which is equivalent to a condition of proportionality. This point is of particular interest, given that Wagstaff (Reference Wagstaff2001) had noted the inappropriateness of such proportionality in the WHO proposed FFC (fairness of financial contribution) index.
This paper suggests an alternative paradigm for assessing catastrophic health-care payments and one which embraces what amounts to an ethical concern for the poor: OOP payments are catastrophic if they exceed z% of household income (or resources) but with z increasing with income, that is, it is a rank-dependent threshold so that catastrophe is a function of where the individual, household or group sits in the income distribution range. Those at the upper end of the distribution face a greater proportion (threshold). The paper proposes to use statistical weights, which increase as income (or ability to pay) rises, that is, the system is progressive.
3 Deriving percentile- or rank-dependent weights
The above discussion suggests that we need a class of weights that will vary across the entire distribution, increasing as the value of p (the percentile or rank in which the individual is located) increases. One such class of weights which has been used in the inequality literature is the ‘single ethical parameter’ weight (Donaldson and Weymark, Reference Donaldson and Weymark1980, Reference Donaldson and Weymark1983).
One of the commonly used specifications for this single parameter weight is:

This depends on a single ‘ethical’ parameter γ which has been called an aversion parameter (Donaldson and Weymark, Reference Donaldson and Weymark1980). For the function in equation (1) to be everywhere positive, we must have that γ > 1. If we use this to weight a fixed threshold, decreasing the value of γ increases the weight on those at the upper end of the income distribution. Given that this is our intent, we seek a decreasing value for γ. However, additionally we want to choose γ such that ∂ψ(p;γ)/∂p > 0 and ψ(p;γ) > 0. If γ∈(1,2), we have that ∂ψ(p;γ)/∂p > 0 and when γ∈(0,1) or γ∈(2,∞), ∂ψ(p;γ)/∂p < 0. This means that the likely candidate for the parameter is γ∈(1,2). This also means that the larger the value of γ within the range γ∈(1,2), the larger the value of ψ(p;γ).
We can then vary the ethical concern across the percentiles simply by varying the value of the single parameter – γ. In addition, we need a function such that the area bounded by the function and the horizontal line across the entire percentile is unity. The function presented in equation (1) does not satisfy this requirement but its area does.
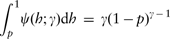
Let ω(p;γ) be the result of the integral such that we may write:

The function ω(p;γ) is such that 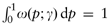 for any value of γ. In addition, ∂ω(p;γ)/∂p > 0 only when γ∈(0,1) and ∂ω(p;γ)/∂p < 0 when γ∈(1,∞). Interestingly, ∂ω(p;γ)/∂p = 0 when γ = 1. Therefore, we use γ∈(0,1] as a range of values for γ in empirical implementation.
We can interpret ω(p;γ) as the density of the lowest income rank in a sample of γ randomly selected individualsFootnote 3 (Duclos and Araar, Reference Duclos and Araar2006). In this case, the density increases with increasing income, which ensures that the threshold for those at the lower end of the income distribution is lower than for those at the higher end. We can understand ω(p;γ) in this case as the weighting scalar.
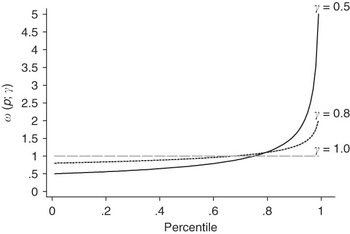
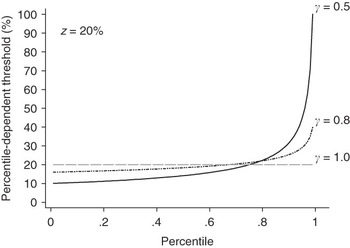
To illustrate the income dependent weights, consider Figure 2 in which the shape of the weights function for selected values of the parameter is presented. The case of γ = 1 is equivalent to having a constant across the entire distribution. This is the special case where all catastrophic indices are the same as those obtained using Wagstaff and van Doorslaer (Reference Wagstaff and van Doorslaer2003). If we define the weighted threshold as z′cat = ω(p;γ) × zcat where zcat is the initial threshold, when the value of the parameter γ = 0.8, for example, those at the upper end face almost double the original threshold; those at the lower end about three-quarter of the original threshold. This is illustrated in Figure 3. While originally a constant threshold value of 20% was used, this now varies from about 16% to about 40%. The rise in the threshold value is relatively steady up until about the 92nd percentile when it rises dramatically. This helps to capture the relatively few individuals with very large incomes or expenditures.
Illustrating the use of percentile-dependent ‘ethical’ weights.

Percentile varying catastrophic threshold for z = 20%.

4 A modified measure of incidence and intensity of catastrophic health-care cost
It is argued (following Wagstaff and van Doorslaer, Reference Wagstaff and van Doorslaer2003) that no one ought to spend more than a given fraction of his/her annual income on health care. However, as argued earlier, this fraction need not be the same for all individuals. It is in this latter regard that the paper departs from the methods of Wagstaff and van Doorslaer (Reference Wagstaff and van Doorslaer2003) and seeks to capture the VE principle (Culyer and Wagstaff, Reference Culyer and Wagstaff1993; Mooney, Reference Mooney1996; Wagstaff, Reference Wagstaff2001; Cissé et al., Reference Cissé, Luchini and Moatti2007).
Let Ti denote the annual amount spent OOP by a typical household for health care, and xi as the annual household income.Footnote 4 Let us define a rank-dependent threshold z′cat that will be used to categorize individuals as making catastrophic health-care payment or not.
We define z′cat = ω(p;γ) × zcat and zcat is the uniform catastrophic threshold and ω(p;γ) = γ(1 − p)γ − 1 for γ∈(0,1] as derived in equation (3).
Interestingly, as shown in Figure 3, if we let zcat = K, and z′cat = ω(p;γ)K, it can be shown that:
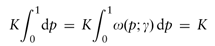
for any value of γ. That implies that the area is the same for the fixed threshold as it is for any choice of the parameter γ∈(0,1).
Note here that when γ = 1, we have the special case where z′cat = zcat (i.e. the catastrophic threshold becomes a constant and is, therefore, the same as that used in Wagstaff and van Doorslaer).
Let Oi′ represent the percentile-dependent catastrophic ‘overshoot’ and define it appropriately with the focus on those making catastrophic payments as:

Consequently, we define Ei′ = 1(Oi′ > 0) as a measure indicating whether the household or individual exceeds the rank-dependent threshold.
The rank-dependent catastrophic headcount measures the proportion of households in the population or sample that make catastrophic payment. This is defined analogously as:
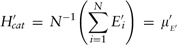
Where  is the mean of Ei′, and N is the total sample size.
In the same way as in Wagstaff and van Doorslaer, the rank-dependent catastrophic payment gap captures deviations from the catastrophic threshold. This is:
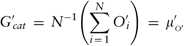
Where  is the mean of Oi′.
Given that equation (7) averages across all the observations, we may be interested in the mean gap of the positive ‘rank-dependent overshoots’ excluding the zeros. We define the mean positive rank-dependent gap as:
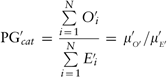
The measures presented, based on vertical ethical principles, allow the threshold to vary across the entire distribution. These are likely to produce higher estimates especially when catastrophic payments occur more among the poor.
As noted by Wagstaff and van Doorslaer (Reference Wagstaff and van Doorslaer2003), the initial measures of headcount and gap do not account for the concentration of the catastrophic incidence across the entire distribution and, more especially, among those at the lower end of the income distribution. The method proposed here weights the poor heavily as their rank-dependent threshold is small compared to those at the upper-end of the distribution. This is because ω(p;γ) represent the density of income percentiles of individuals in the income distribution (Duclos and Araar, Reference Duclos and Araar2006). In this regard, we do not need to use the concentration index proposed in Wagstaff and van Doorslaer to weight the catastrophic headcount measure to account for where the incidence or gap is concentrated. However, to allow comparison of our results with those based on the constant threshold weighted by the concentration index, we present results for both the concentration indices and the weighted measures.Footnote 5
5 Empirical illustration
In Nigeria, over 70% and 90% of total and private health spending, respectively, is OOP spending. In that country, this form of payment is unaffordable for the poor and predominantly rural population (Ichoku and Fonta, Reference Ichoku and Fonta2006; Ataguba et al., Reference Ataguba, Ichoku and Fonta2008), thereby reducing access to quality health care. Such payments can also drive households into poverty or deepen the poverty of those already poor (Culyer and Wagstaff, Reference Culyer and Wagstaff1993) particularly as the poor are more prone to disease and ill-health (Wagstaff, Reference Wagstaff2002; Marmot, Reference Marmot2005).
In some instances, poor households face medical bills that exceed their earnings. They may then change their consumption patterns or borrow to finance health-care costs (Ataguba et al., Reference Ataguba, Ichoku and Fonta2008). In Nigeria, data show that about 0.2% of the households spend more than their total household financial resources to pay for health care and about 78% of these households are in the poorest per capita expenditure quintile (FOS, 2004). This is a major source of concern not only for Nigeria but also for other similar low- and middle-income countries (LMICs).
The analysis uses the Nigerian National Living Standard Survey (NLSS) measurement 2003/2004 data from the Federal Office of Statistics in Nigeria.Footnote 6 Sampling involved first, clustering housing units called Enumeration Areas (EA) followed by the random selection of housing units. In total, 120 EAs were selected in each of the 36 states and 60 EAs from the Federal Capital Territory. After data cleaning to exclude those with a less than fully completed questionnaires,Footnote 7 the sample size is 19,518 housing units (FOS, 2004).
Household total expenditure and total non-food expenditure gross of OOP health-care payments were used. OOP payments exclude transportation costs but include direct costs faced by households in using health services. The unit of analysis is the household. The full national sample was used in the estimation process.
The choice of Nigeria to illustrate the relevance of a varying threshold to define catastrophic payment is useful because it is one of the developing countries where OOP payments still dominate health-care financing and, thus, catastrophic spending is likely.
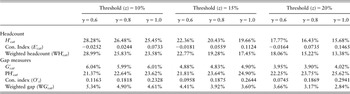
In Table 1, the results are presented for the situation where catastrophic indices are computed using total household consumption expenditure as the measure of ability to pay. We considered various initial thresholds of 10%, 15% and 20%. For each of the thresholds, the rank-dependent catastrophic headcount (H′cat) of course increases with the value of the parameter. When the value of the parameter is 0.6 for instance, the concentration indices are negative, suggesting that catastrophic payments are concentrated among the poor. Increasing the value of the parameter increases the headcount concentration indices for all thresholds signifying that when less emphasis is placed on the poor, the concentration of catastrophic payments is less among the poor. For example, when the 10% threshold was used, the headcount (headcount concentration index) decreased (increased) from about 28% (−0.03) to 25% (0.07) when the parameter was increased from 0.6 to 1. When the rank-dependent headcount is weighted using a function of the concentration index, as shown in Table 1, the value decreases with increasing parameter value. For instance, if the original threshold were 15%, the weighted headcount (WH′cat) decreases from 22.8% (for γ = 0.6) to 17.5% (for γ = 1).
Catastrophic out-of-pocket health-care payment (total expenditure) indices, Nigeria 2003/2004

Note: These are based on total household expenditure; all estimations are appropriately weighted to be nationally representative.
Source: Author's calculations.
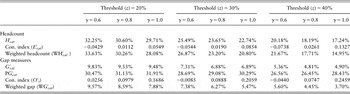
The picture for the rank-dependent catastrophic gaps is mixed. For an initial threshold of 10% for instance, the mean gap (G′cat) decreased from 6.04% (for γ = 0.6) to 5.99% (for γ = 0.8) but increased slightly to 6.01% (for γ = 1). As the same picture is true for all the initial thresholds considered, the mean positive gaps (PG′cat) consistently increased as the value of the parameter for each threshold increased. Note that with an initial threshold of 20%, there is a higher concentration of the catastrophic gap among the poor (0.0745) when the parameter for γ = 0.6 than it is (0.2941)Footnote 8 when the parameter γ = 1. The weighted gap (WG′cat) decreased with increasing parameter values for all initial thresholds considered here.
The position across thresholds is consistent with a priori reasoning. This is because, as expected, the rank-dependent headcount and weighted headcount decreased for higher thresholds. This is consistent for all parameter values. For example, in Table 1, for the value of the parameter γ = 0.6, the headcount index decreased from 28.3% (z = 10%) to 22.4% (z = 15%) and to 17.8% (z = 20%). Similarly, the corresponding weighted headcount decreased from 29% (z = 10%) to 22.8% (z = 15%) and to 18.1% (z = 20%). For the gap measures, the picture shows that the rank-dependent catastrophic gap and the weighted catastrophic gap decrease as the initial thresholds increase, while the positive gaps increase with increasing initial threshold levels. For instance, the catastrophic gap decreases from 5.99% (z = 10%) to 4.83% (z = 15%) and to 3.9% (z = 20%) for parameter value γ = 0.8, while the corresponding positive gaps increases from 22.6% (z = 10%) to 23.6% (z = 15%) and to 23.8% (z = 20%).
The results when the ‘ability-to-pay’ measure (i.e. total non-food expenditure) is used show a similar pattern to those using total household expenditure. This is illustrated in Table 2. Here we considered initial thresholds of 20%, 30% and 40%. The major differences in the results between those presented in Table 1 and those in Table 2 is that while in the former, the rank-dependent mean positive catastrophic gap increases with increasing initial threshold values, the latter shows the opposite which is consistent with those reported by Wagstaff and van Doorslaer (Reference Wagstaff and van Doorslaer2003).
Catastrophic out-of-pocket health-care payment (non-food expenditure) indices, Nigeria 2003/2004

Note: These are based on total household non-food expenditure; all estimations are appropriately weighted to be nationally representative.
Source: Author's calculations.
As noted earlier, the results presented for when γ = 1 are the same as those using a uniform threshold across all the population. It is interesting to see that the catastrophic headcount is lower for higher thresholds. For instance in Table 1, the headcount decreased from 25.45% (z = 10%) to 19.66% (z = 15%) and to 15.68% (z = 20%). The same scenario is true for the weighted catastrophic headcount, the catastrophic gap and the weighted gap except for the mean positive catastrophic gap. In Table 2, however, all these indices declined with increasing initial threshold.
Comparing the results obtained using a rank-dependent threshold with those based on the fixed threshold used in Wagstaff and van Doorslaer (Reference Wagstaff and van Doorslaer2003), for a typical threshold of say 10% (see Table 1) for total household expenditure and 40% (see Table 2) for total household non-food expenditure, the catastrophic payment headcount decreased with increasing values of the parameter while the concentration of the catastrophic headcount increases among the rich and decreases among the poor. For the catastrophic payment gaps, there was no clear order of increase or decrease. As shown in Table 1, for an initial threshold of z = 10%, while the catastrophic gap decreased, for example, from 6.04% when γ = 0.6 to 5.99% when γ = 0.8, it increased to 6.01% when γ = 1 but the concentration indices however increased with increasing parameter values. In Table 2, the gaps generally seem to decrease with increasing parameter values. For an initial threshold of 20%, for instance, the catastrophic gap decreased from 9.83% (γ = 0.6) to 9.48% (γ = 1). For the estimates weighted by the concentration index, a similar pattern is observed. It is worth noting that in this case as can be seen from Tables 1 and 2, the weighted catastrophic headcount, when γ = 1, is always lower than those obtained as the rank-dependent headcount. For instance in Table 1, for an initial threshold of 15%, the weighted headcount when γ = 1 is given as 23.6% while the rank-dependent catastrophic headcount for γ = 0.8 is 26.5%. Similarly, the weighted catastrophic gaps are lower than the rank-dependent catastrophic gaps.
From the foregoing, setting a fixed threshold value will likely lead to lower catastrophic headcounts compared with a threshold which varies across the entire distribution by reducing the thresholds for the poor. This is especially the case when those making catastrophic payments are the poor. Even after accounting for the concentration of the catastrophic headcount among the poor (i.e. considering the weighted headcount), there is still a lower headcount as the results have shown.
6 Conclusion
With increasing emphasis on health financing reforms to help to protect the poor and the very real ethical concerns in societies for the poor, with respect to both their poverty and their ill-health, there is a desire to reflect these feelings in how first to define catastrophic payments and second to address problems arising from catastrophic payments. This paper is critical of many of the efforts to date on both these fronts. It suggests instead that basing the notion of catastrophe on the principle of VE is useful. On ethical grounds, catastrophic health-care payments might then be based on a concept of catastrophe which took account of the notion of progressivity in health-care finance. That would mean we would have to depart from the use of a fixed percentage threshold for categorizing catastrophic health-care payments across different income groups. This paper further argues that there is no ‘correct’ nor universally agreed way to decide on how progressive progressivity should be. In the event, this will depend on how compassionate each society is with respect to its concern for the poor.
It is suggested that reflecting such compassion ideally requires normative weights based on informed citizens’ preferences, which reflect their degree of concern about inequity. The paper advocates these but does not pursue them here. An alternative is presented based on statistical weights, with decision makers being left to exercise their judgment as to which set of weights to use.
In this paper, we used statistical weights to generate different thresholds for different levels of income. These were then applied to a data set from Nigeria – one of the developing countries with high OOP payments.
The paper extends the measurement of catastrophe under the ‘equity lens’ to incorporate greater concern for the poor. In doing so, it departs from the use of a uniform threshold. The paper advocates varying the percentage threshold across the entire income distribution ladder.
We acknowledge an earlier attempt to consider and account for the distribution and concentration of catastrophic payments among the poor (Wagstaff and van Doorslaer, Reference Wagstaff and van Doorslaer2003). However, that paper simply weighted the measures of catastrophic incidence and intensity obtained using a constant threshold, by a measure of concentration of payments. The key problem with that attempt is that it only weighted those who were categorized as having made catastrophic payments; it ignored those who did not make these payments but were faced with making them.
The method proposed in this paper applies a weighting system that results in the thresholds increasing with income (or consumption). Applying that method in Nigeria showed that the numbers defined as paying catastrophic payments using a fixed threshold (whether or not it is weighted by the concentration index) are lower than when a rank-dependent threshold is used. Therefore, adopting the principles of VE as proposed here, it emerged that using the fixed threshold approach is likely to lead to under-reporting of the number of cases of catastrophic payments. This will be especially true in countries where income inequality is high. In addition, the concentration of the amount paid among those at the upper end of the distribution increases with higher values of the parameter (i.e. increasing the thresholds of the poor while simultaneously decreasing those of the rich).
Finally, it is important to note that while the method proposed here improves on the work of previous researchers, the choice of an initial threshold remains arbitrary. In this regard, but also with respect to what concept of equity is to be used in considering catastrophic payments, the paper seeks to further debate for future research in defining and measuring catastrophic health-care payments.
Acknowledgments
The author is grateful for the comments received from staff members at the Health Economics Unit, University of Cape Town when an earlier version of the paper was discussed. The author wishes to thank particularly Gavin Mooney, Di McIntyre and Okore Okorafor for their comments during the preparation of the manuscript. A version of the paper was presented at the International Health Economics Association (iHEA) World Congress in 2009. The insights provided by researchers during the iHEA 2009 conference are also acknowledged. In addition, the comments by the anonymous reviewers were very helpful. The usual disclaimer applies.