Implications
The C sequestration potential by grasslands and rangelands could be used to partly mitigate the greenhouse gas (GHG) emissions of the livestock sector. This will require avoiding land use changes that reduce ecosystem soil C stocks (e.g. deforestation, ploughing up long-term grasslands) and a cautious management of pastures, aiming at preserving and restoring soils and their soil organic matter content. Combined with other mitigation measures, such as a reduction in the use of N fertilisers, of fossil-fuel energy and of N-rich feedstuffs by farms, this may lead to substantial reductions in GHG emissions per unit land area and per unit animal product.
Introduction
Grasslands cover about one-quarter of the earth’s land surface (Ojima et al., Reference Ojima, Parton, Schimel, Scurlock and Kittel1993) and span a range of climate conditions from arid to humid. Grasslands are the natural climax vegetation in areas (e.g. the Steppes of central Asia and the prairies of North America) where the rainfall is low enough to prevent the growth of forests. In other areas, where rainfall is normally higher, grasslands do not form the climax vegetation (e.g. north-western and central Europe) and are more productive. Rangelands are characterised by low-stature vegetation, owing to temperature and moisture restrictions, and found on every continent. Grasslands contribute to the livelihoods of over 800 million people, including many poor smallholders (Reynolds et al., Reference Reynolds, Batello, Baas and Mack2005) and provide a variety of goods and services to support flora, fauna, and human populations worldwide. On a global scale, livestock use 3.4 billion hectares of grazing land (i.e. grasslands and rangelands), in addition to animal feed produced on about a quarter of the land under crops. By 2020, this agricultural sub-sector will produce about 30% of the value of global agricultural output (Delgado, Reference Delgado2005).
Agriculture accounted for an estimated emission of 5.1 to 6.1 Gigaton (Gt) CO2 equivalents per year in 2005 (10% to 12% of total global anthropogenic emissions of greenhouse gases (GHGs) (Intergovernmental Panel on Climate Change (IPCC), 2007) and for ca. 60% of N2O emissions and 50% of CH4 emissions). Between 1990 and 2005, the direct emissions of the agriculture sector have increased by 17% and this increase has mostly occurred in developing countries (IPCC, 2007). The GHG inventory methodology used by IPCC (IPCC, 1996 and 2006) only includes, however, farm emissions in the agriculture sector. Indirect GHG emissions generated by farm activity through the use of farm inputs (e.g. fertilisers, feed, pesticides) do not belong to the agriculture sector, but are covered by other sectors such as industry (e.g. for the synthesis and packaging of inorganic N fertilisers and of organic pesticides) and transport (e.g. transport of fertilisers and feed). Emissions from electricity and fuel use are covered in the buildings and transport sector, respectively (IPCC, 2006).
Although the sectoral approach used by IPCC is appropriate for national and regional GHG inventories, it does not reflect emissions generated directly or indirectly by marketed products. Lifecycle analyses include indirect emissions generated by farm inputs and pre-chain activities. With this approach, it was estimated that livestock production systems, from feeding import to marketed animal products, generate directly and indirectly 18% of global GHG emissions as measured in CO2 equivalents (Food and Agriculture Organisation (FAO), 2006). Livestock production induces 9% of global anthropogenic CO2 emissions. The largest share (i.e. 7%) of this derives from land-use changes – especially deforestation – caused by expansion of pastures and arable land for feed crops. Livestock production systems also emit 37% of anthropogenic methane (see Martin et al., Reference Martin, Morgavi and Doreau2009) most of that from enteric fermentation by ruminants. Furthermore, it induces 65% of anthropogenic nitrous oxide emissions, the great majority from manure (FAO, 2006).
Agricultural ecosystems hold large C reserves (IPCC, 2001), mostly in soil organic matter. Historically, these systems have lost more than 50 Gt C (Paustian et al., Reference Paustian, Cole, Sauerbeck and Sampson1998; Lal, Reference Lal1999 and Reference Lal2004). Agricultural lands generate very large CO2 fluxes, both to and from the atmosphere (IPCC, 2001), but the net flux would be small (United States-Environmental Protection Agency (US-EPA), 2006). Nevertheless, soil C sequestration (enhanced sinks) is the mechanism responsible for most of the mitigation potential in the agriculture sector, with an estimated 89% contribution to the technical potential (IPCC, 2007), excluding, however, the potential for fossil energy substitution through non-agricultural use of biomass. Worldwide the soil organic carbon (SOC) sequestration potential is estimated to be 0.01 to 0.3 Gt C/year on 3.7 billion ha of permanent pasture (Lal, Reference Lal2004). Thus SOC sequestration by the world’s permanent pastures could potentially offset up to 4% of the global GHG emissions.
Here, we review the C sequestration potential of temperate managed grasslands, focusing on Europe, and its role for mitigating the GHG balance of livestock production systems. We address the following issues: (i) carbon and GHG balance of managed grasslands, (ii) vulnerability of grassland C stocks to climate change and to biodiversity loss and (iii) the role of C sequestration for the GHG balance of ruminant production systems.
The carbon balance of managed grasslands
Organic carbon cycling in grasslands
The nature, frequency and intensity of disturbance play a key role in the C balance of grasslands. In a cutting regime, a large part of the primary production is exported from the plot as hay or silage, but part of these C exports may be compensated for by organic C imports through farm manure and slurry application.
Under intensive grazing, up to 60% of the above-ground dry-matter production is ingested by domestic herbivores (Lemaire and Chapman, Reference Lemaire and Chapman1996). However, this percentage can be much lower under extensive grazing. The largest part of the ingested C is digestible and, hence, is respired shortly after intake. The non-digestible C (25% to 40% of the intake according to the digestibility of the grazed herbage) is returned to the pasture in excreta (mainly as faeces). In most productive husbandry systems, the herbage digestibility tends to be maximised by agricultural practices such as frequent grazing and use of highly digestible forage cultivars. Consequently, in these systems the primary factor which modifies the C flux returned to the soil by excreta is the grazing pressure, which varies with the annual stocking rate (mean number of livestock units per unit area) (Soussana et al., Reference Soussana, Loiseau, Vuichard, Ceschia, Balesdent, Chevallier and Arrouays2004). Secondary effects of grazing on the C cycle of a pasture include: (i) the role of excretal returns which, at a moderate rate of grazing intensity, could favour nutrient cycling and increase primary production, especially in nutrient-poor grasslands (De Mazancourt et al., Reference De Mazancourt, Loreau and Abbadie1998); (ii) the role of defoliation intensity and frequency, and of treading by animals, which both reduce the leaf area and then the atmospheric CO2 capture.
Only a small fraction of the ingested grassland C is accumulated by ruminants in meat production systems (e.g. 0.6% of C intake with heifers under continuous upland grazing; Allard et al., Reference Allard, Soussana, Falcimagne, Berbigier, Bonnefond, Ceschia, D’hour, Hénault, Laville, Martin and Pinarès-Patino2007), but this fraction becomes much higher in intensive dairy production systems (e.g. 19% to 20% of C intake; Faverdin et al., Reference Faverdin, Maxin, Chardon, Brunschwig and Vermorel2007). Additional C losses (ca. 3% to 5% of the digestible C) occur through methane emissions from the enteric fermentation (IPCC, 2006; see Martin et al., Reference Martin, Morgavi and Doreau2009).
Processes controlling soil organic carbon accumulation
Carbon accumulation in grassland ecosystems occurs mostly below ground. Grassland soils are typically rich in SOC, partly owing to active rhizodeposition (Jones and Donnelly, Reference Jones and Donnelly2004) and partly to the activity of earthworms that promote macro-aggregate formation in which micro-aggregates form that stabilise SOC for extended periods (Six et al., Reference Six, Callewaert, Lenders, De Gryze, Morris, Gregorich, Paul and Paustian2002; Bossuyt et al., Reference Bossuyt, Six and Hendrix2005). Rhizodeposition favours C storage (Balesdent and Balabane, Reference Balesdent and Balabane1996), because direct incorporation into the soil matrix allows a high degree of physical stabilisation of the soil organic matter. Root litter transformation is also an important determinant of the C cycle in grassland ecosystems, which is affected both by the root litter quality and by the rhizosphere activity (Personeni and Loiseau, Reference Personeni and Loiseau2004 and Reference Personeni and Loiseau2005).
Below-ground C generally has slower turnover rates than above-ground C, as most of the organic C in soils (humic substances) is produced by the transformation of plant litter into more persistent organic compounds (Jones and Donnelly, Reference Jones and Donnelly2004). Coarse soil organic matter fractions (above 0.2 mm) have a fast turnover in soils, and the mean residence time of C in these fractions is reduced by intensive compared to extensive management (Klumpp et al., Reference Klumpp, Soussana and Falcimagne2007). SOC may persist because it is bound to soil minerals and exists in forms that microbial decomposers cannot access (Baldock and Skjemstad, Reference Baldock and Skjemstad2000). Therefore, SOC accumulation is often increased in clayey compared to sandy soils.
Sequestred SOC can, if undisturbed, remain in the soil for centuries. In native prairie sites in the US great plains, where SOC was 14C-dated (Follett et al., Reference Follett, Kimble, Leavitt and Pruessner2004), mean residence time of SOC in the soil increased but its concentration decreased with depth. Nevertheless, substantial amounts of SOC remained at depth even after several millennia. In an upland grassland in France, the mean residence time of SOC also increased with depth, reaching values of 2000 to 10 000 years in deep soil layer (>0.2 m) (Fontaine et al., Reference Fontaine, Barot, Barre, Bdioui, Mary and Rumpel2007). The lack of energy supply from fresh organic matter protects ancient buried organic C from microbial decomposition (Fontaine et al., Reference Fontaine, Barot, Barre, Bdioui, Mary and Rumpel2007). Therefore, agricultural practices like ploughing, which mix soil layers and break soil aggregates, accelerate SOC decomposition (Paustian et al., Reference Paustian, Cole, Sauerbeck and Sampson1998, Conant et al., Reference Conant, Easter, Paustian, Swan and Williams2007).
While there has been a steady C accumulation in the soils of many ecosystems over millennia (Schlesinger, Reference Schlesinger1990), it is usually thought that soil C accumulation capacity is limited and that old non-disturbed soils should have reached after several centuries equilibrium in terms of their C balance (Lal, Reference Lal2004). Soil C sequestration is reversible, as factors like soil disturbance, vegetation degradation, fire, erosion, nutrients shortage and water deficit may all lead to a rapid loss of SOC.
Role of land use change for carbon sequestration
Carbon sequestration can be determined directly by measuring changes in C pools (Conant et al., Reference Conant, Paustian and Elliott2001) and, or, indirectly by measuring C fluxes (Table 1 and equation (1)). SOC stocks display a high spatial variability (coefficient of variation of 50%; Cannell et al., Reference Cannell, Milne, Hargreaves, Brown, Cruickshank, Bradley, Spencer, Hope, Billett, Adger and Subak1999) in grassland as compared to arable land, which limits the accuracy of direct determinations of C stock changes. The variability in SOC contents is increased by sampling to different depths (Robles and Burke, Reference Robles and Burke1998; Chevallier et al., Reference Chevallier, Voltz, Blanchart, Chotte, Eschenbrenner, Mahieu and Albrecht2000; Bird et al., Reference Bird, Herrick, Wander and Wright2002) and in pastures by excretal returns concentrated in patches.
Changes in SOC through time are non-linear after a change in land use or in grassland management. A simple two parameters exponential model has been used to estimate the magnitude of the soil C stock changes (Soussana et al., Reference Soussana, Loiseau, Vuichard, Ceschia, Balesdent, Chevallier and Arrouays2004), showing that C is lost more rapidly than it is gained after a change in land use. Land use change from grassland to cropland systems causes losses of SOC in temperate regions ranging from 18% (±4) in dry climates to 29% (±4) in moist climates. Converting cropland back to grassland uses for 20 years was found to restore 18% (±7) of the native C stocks in moist climates (relative to the 29% loss owing to long-term cultivation) and 7% (±5) of native stocks in temperate dry climates (Conant et al., Reference Conant, Paustian and Elliott2001). As a result of periodic tillage and resowing, short-duration grasslands tend to have a potential for soil C storage intermediate between crops and permanent grassland. Part of the additional C stored in the soil during the grassland phase is released when the grassland is ploughed up. The mean C storage increases in line with prolonging the lifespan of covers, that is, less frequent ploughing (Soussana et al., Reference Soussana, Loiseau, Vuichard, Ceschia, Balesdent, Chevallier and Arrouays2004).
Role of management for carbon sequestration in grasslands
A number of studies have analysed effects of grassland and rangeland management on SOC stocks (Table 1). Most studies concern only the top-soil (e.g. 0 to 30 cm), although C sequestration or loss may also occur in deeper soil layers (Fontaine et al., Reference Fontaine, Barot, Barre, Bdioui, Mary and Rumpel2007). It is often assumed that impacts of management are greatest at the surface and decline with depth in the profile (Ogle et al., Reference Ogle, Conant and Paustian2004). A meta-analysis of 115 studies in pastures and other grazing lands worldwide (Conant et al., Reference Conant, Paustian and Elliott2001), indicated that soil C levels increased with improved management (primarily fertilisation, grazing management, and conversion from cultivation or native vegetation, improved grass species) in 74% of the studies considered (Table 1). Light grazing increased SOC stocks compared to exclosure and to heavy grazing (Ganjegunte et al., Reference Ganjegunte, Vance, Preston, Schuman, Ingram, Stahl and Welker2005; Table 1). Some of the possible soil C sequestration opportunities for temperate grasslands in France have been calculated and compared (Table 1) for 20-year time periods (Soussana et al., Reference Soussana, Loiseau, Vuichard, Ceschia, Balesdent, Chevallier and Arrouays2004). According to these estimates, annual C storage rates between 20 and 50 g C/m2 per year are obtained for a range of options, which seem compatible with gradual changes in the forage production systems, namely: (i) reducing N fertiliser inputs in highly intensive grass leys; (ii) increasing the duration of grass leys; (iii) converting these leys to grass-legume mixtures or to permanent grasslands; (iv) moderately intensifying nutrient-poor permanent grasslands. By contrast, the intensification of nutrient-poor grasslands developed on organic soils may lead to large C losses, and the conversion of permanent grasslands to leys of medium duration is also conducive to the release of soil C. Nevertheless, the uncertainties concerning the estimated values of C storage or release after a change in grassland management are still very high (estimated at 25 g C/m2 per year).
Data from the National Soil Inventory of England and Wales obtained between 1978 and 2003 (Bellamy et al., Reference Bellamy, Loveland, Bradley, Lark and Kirk2005) show that C was lost from most top soils across England and Wales over the survey period. Nevertheless, rotational grasslands gained C at a rate of ca. 10 g C/m2 per year (Table 1). The Countryside Surveys of Great Britain are ongoing ecological assessments in UK that have taken place since 1978 (Firbank et al., Reference Firbank, Smart, Crabb, Crabb, Critchley, Fowbert, Fuller, Gladders, Green, Henderson and Hill2003). In this survey, significant increases in soil C concentration, ranging from 0.2 to 2.1 g/kg per year, were observed in both fertile and infertile grasslands (CLIMSOIL, 2008).
In Belgium, grasslands were reported either to be sequestering C in soils at rates of 22 or 44 g C/m2 per year (Lettens et al., Reference Lettens, van Orshoven, van Wesemael, Muys and Perrin2005a; Goidts and van Wesemael, Reference Goidts and van Wesemael2007, respectively), or losing C at 90 g C/m2 per year on podzolic, clayey and loam soils (Lettens et al., Reference Lettens, Van Orshovena, van Wesemael, De Vos and Muys2005b). However, soil bulk density was estimated from pedo-transfer functions in these studies, which adds to the uncertainty, as a small change in bulk density can result in a large change in stock of SOC (Smith et al., Reference Smith, Chapman, Scott, Black, Wattenbach, Milne, Campbell, Lilly, Ostle, Levy, Lumsdon, Millard, Towers, Zaehle and Smith2007).
Follett and Schuman (Reference Follett and Schuman2005) reviewed grazing land contributions to C sequestration worldwide using 19 regions. A positive relationship was found, on average, between the C sequestration rate and the animal stocking density, which is an indicator of the pasture primary productivity. Based on this relationship, they estimate a 200 Megatons SOC sequestration per year on 3.5 billion ha of permanent pasture worldwide. Using national grassland resource dataset and NDVI (Normalised Difference Vegetation Index) time series data, Piao et al. (Reference Piao, Fang, Ciais, Peylin, Huang, Sitch and Wang2009) estimated that C stocks of China’s grasslands increased over the past two decades by 117 and 101 g C/m2 per year in the vegetation and soil compartments, respectively.
In their assessment of the European C balance, Janssens et al. (Reference Janssens, Freibauer, Ciais, Smith, Nabuurs, Folberth, Schlamadinger, Hutjes, Ceulemans, Schulze, Valentini and Dolman2003) concluded that grasslands were a highly uncertain component of the European-wide C balance in comparison to forests and croplands. They estimated a net grassland C sink of 66 ± 90 g C/m2 per year over geographic Europe, though this estimate was not based on field data but on a simple model using yields and land-use data (Vleeshouwers and Verhagen, Reference Vleeshouwers and Verhagen2002).
The 2006 IPCC Guidelines allow for the estimation of: (i) C emissions and removals in grasslands owing to changes in stocks in above and below-ground biomass; (ii) emissions of non-CO2 GHGs (CO, CH4, N2O and NOx) owing to biomass burning (Fearnside, Reference Fearnside2000); and (iii) C emissions and removals in grasslands owing to changes in soil C stocks. Mineral and organic soils (peat, histosoils, etc.) are separated for the calculations of soil C stock changes, provided that national inventory data are available for grassland soils (IPCC, 2006). Ogle et al. (Reference Ogle, Conant and Paustian2004) identified 49 studies dealing with effects of management practices that either degraded or improved conditions relative to nominally managed grasslands. On average, degradation reduced SOC stocks to 95% and 97% of C stored under nominal conditions in temperate and tropical regions, respectively. In contrast, improving grasslands with a single management activity enhanced SOC stocks by 14% and 17% in temperate and tropical regions, respectively, and with an additional improvement(s), stocks increased by another 11%. By applying these factors to managed grasslands in the USA, Ogle et al. (Reference Ogle, Conant and Paustian2004) found that over a 20-year period, changing management could sequester up to 142 Megatons C per year.
Estimating carbon sequestration from carbon flux measurements
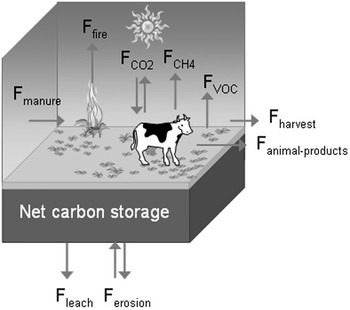
An alternative to the direct measurement of C stock changes in grasslands is to measure the net balance of C fluxes (net C storage, NCS) exchanged at the system boundaries. This approach provides a high temporal resolution and changes in C stock can be detected within one year. In contrast, direct measurements of stock change require several years or several decades to detect significant effects, given the high variability among samples. The main drawback of flux measurements, however, is that several C fluxes need to be measured: (i) trace gases exchanged with the atmosphere (i.e. CO2; CH4; volatile organic compounds, VOC; and emissions during fires), (ii) organic C imports (manures) and exports (harvests, animal products), (iii) dissolved C lost in waters (dissolved organic and inorganic C) and lateral transport of soil C through erosion (Figure 1). NCS (g C/m2 per year) is the mass balance of these fluxes (equation (1)):

where  is equal to the net ecosystem exchange (NEE) of CO2 between the ecosystem and the atmosphere, which is conventionally positive for a C gain by the ecosystem.
 , FVOC and Ffire are trace gas C losses from the ecosystem (g C/m2 per year). Fmanure, Fharvest and Fanimal-products are lateral organic C fluxes (g C/m2 per year), which are either imported or exported from the system. Fleach and Ferosion are organic (and/or inorganic C losses in g C/m2 per year) through leaching and erosion, respectively.
Carbon fluxes (g C/m2 per year) in a managed grassland.  is the net CO2 ecosystem exchange. Ffire is the total C loss by fire;
 , FVOC are non-CO2 trace gas C losses from the ecosystem, as methane and volatile organic carbon, respectively. Fmanure, Fharvest and Fanimal-products are lateral organic C fluxes, which are either imported (manure application) or exported (harvests and animal products) from the system. Fleach and Ferosion are organic (and/or inorganic) C losses through leaching and erosion, respectively. Net carbon storage (NCS, see equation (1)) is calculated as the balance of carbon fluxes.

Nevertheless, depending on the system studied and its management, some of these fluxes can be neglected for NCS calculation. For instance, fire emissions by grasslands are very low in temperate regions like Europe (i.e. below 1 g C/m2 per year over 1997 to 2004), while they reach 10 and 100 g C/m2 per year in the Mediterranean and in tropical grasslands, respectively (Van der Werf et al., Reference Van der Werf, Randerson, Giglio, Collatz, Kasibhatla and Arellano2006). Erosion (Ferosion) is also rather insignificant in permanent grasslands (e.g. in Europe), but can be increased by tillage in the case of sown grasslands. The global map of Ferosion created by Van Oost et al. (Reference Van Oost, Quine, Govers, De Gryze, Six, Harden, Ritchie, McCarty, Heckrath, Kosmas, Giraldez, da Silva and Merckx2007) indicates that grassland C erosion rates are usually below 5 g C/m2 per year, even in tropical dry grasslands (Van Oost et al., Reference Van Oost, Quine, Govers, De Gryze, Six, Harden, Ritchie, McCarty, Heckrath, Kosmas, Giraldez, da Silva and Merckx2007). The total dissolved C loss by leaching was estimated by Siemens (Reference Siemens2003) and Janssens et al. (Reference Janssens, Freibauer, Ciais, Smith, Nabuurs, Folberth, Schlamadinger, Hutjes, Ceulemans, Schulze, Valentini and Dolman2003) at 11 ± 8 g C/m2 per year for Europe. This flux tends to be highly variable depending on soil (pH, carbonate) and climate (rainfall, temperature) factors, and it could reach higher values in wet tropical grasslands, especially on calcareous substrate. VOC emissions by grassland systems are increased in the short-term by cutting and tend to be higher with legumes than with grass species (Davison et al., Reference Davison, Brunner, Ammann, Spirig, Jocher and Neftel2008). However, these C fluxes are usually small and can easily be neglected. Therefore, with temperate managed grasslands, equation (1) can be simplified as (Allard et al., Reference Allard, Soussana, Falcimagne, Berbigier, Bonnefond, Ceschia, D’hour, Hénault, Laville, Martin and Pinarès-Patino2007):

With the advancement of micrometeorological studies of the ecosystem-scale  exchange of CO2 (Baldocchi and Meyers, Reference Baldocchi and Meyers1998), eddy flux covariance measurement techniques have been applied to grassland and rangelands. As the measurement uses a free-air technique, as opposed to enclosures, there is no disturbance of the measured area that can be freely accessed by herbivores. Ruminant’s belched CO2 (digestive + metabolic CO2) at grazing, which can be measured by the SF6 method (Pinares-Patino et al., Reference Pinares-Patino, D’Hour, Jouany and Martin2007), is included in
 measurements. It has no direct effect on the atmospheric CO2 concentration, because it is ‘short-cycling’ carbon, which has been fixed by plants earlier.
Gilmanov et al. (Reference Gilmanov, Soussana, Aires, Allard, Amman, Balzarolo, Barcza, Bernhofer, Campbell, Cernusca, Cescatti, Clifton-Brown, Dirks, Dore, Eugster, Fuhrer, Gimeno, Gruenwald, Haszpra, Hensen, Ibrom, Jacobs, Jones, Lanigan, Laurila, Lohila, Manca, Marcolla, Nagy, Pilegaard, Pinter, Raschi, Rogiers, Sanz, Stefani, Sutton, Tuba, Valentini, Williams and Wohlfahrt2007) have analysed tower CO2 flux measurements from 20 European grasslands, covering a wide range of environmental and management conditions.  varies from significant net uptake (650 g C/m2 per year) to significant release (160 g C/m2 per year). Four sites became CO2 sources in some years, two of them during drought events and two of them with a significant peat horizon (Gilmanov et al., Reference Gilmanov, Soussana, Aires, Allard, Amman, Balzarolo, Barcza, Bernhofer, Campbell, Cernusca, Cescatti, Clifton-Brown, Dirks, Dore, Eugster, Fuhrer, Gimeno, Gruenwald, Haszpra, Hensen, Ibrom, Jacobs, Jones, Lanigan, Laurila, Lohila, Manca, Marcolla, Nagy, Pilegaard, Pinter, Raschi, Rogiers, Sanz, Stefani, Sutton, Tuba, Valentini, Williams and Wohlfahrt2007). Therefore, net CO2 release (
 < 0) is associated with organic-rich soils and heat stress. Indeed, a net CO2 release was found with drained organic soils subjected to grazing in Switzerland and in New Zealand (Nieveen et al., Reference Nieveen, Campbell, Schipper and Blair2005; Rogiers et al., Reference Rogiers, Conen, Furger, Stöcklis and Eugster2008), and these sites were found to lose C (i.e. negative NCS; Table 1).
Within the European (FP5 EESD) ‘GreenGrass’ project, the full GHG balance of nine contrasted grassland sites covering a major climatic gradient over Europe (Tables 1 and 2), was measured during two complete years (Soussana et al., Reference Soussana, Allard, Pilegaard, Ambus, Campbell, Ceschia, Clifton-Brown, Czobel, Domingues, Flechard, Fuhrer, Hensen, Horvath, Jones, Kasper, Martin, Nagy, Neftel, Raschi, Baronti, Rees, Skiba, Stefani, Manca, Sutton, Tuba and Valentini2007). The sites include a wide range of management regimes (rotational grazing, continuous grazing and mowing), the three main types of managed grasslands across Europe (sown, intensive permanent and semi-natural grassland) and contrasted nitrogen fertiliser supplies. Two sites (in Ireland and in Switzerland; Table 1) were sown grass-legume mixtures, while the remainder were long-term grasslands. At all sites, the NEE of CO2 was assessed using the eddy covariance technique. CH4 emissions resulting from enteric fermentation of the grazing cattle were measured in situ at four sites using the SF6 tracer method. N2O emissions were monitored using various techniques (GC-cuvette systems, automated chambers and tunable diode laser).
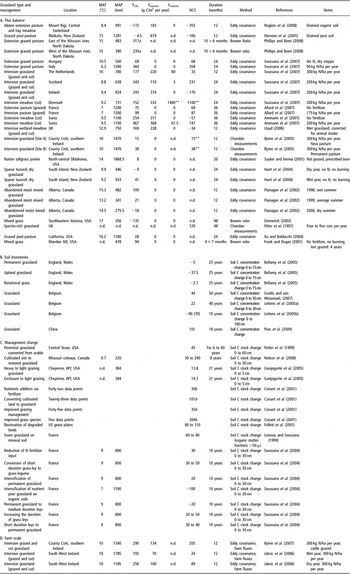
Literature survey of net C storage (NCS) at grassland sites using different methods: C flux balance (A), grassland soil C inventory (B), soil C change after a change in grassland management (C), and farm scale flux measurements (D). A positive  represents a net C uptake from the ecosystem. A positive NCS denotes a net carbon accumulation in grassland ecosystems. All fluxes are in g C/m2 per year

MAT = mean annual temperature; MAP = mean annual precipitation;  = net CO2 ecosystem exchange; Fmanure = lateral organic C fluxes which are imported (manure application) in the system; Fharvest = lateral organic C fluxes which are exported (harvests) from the system; n.d. = not defined.
a average of growing season.
b 87% of the studies were from Australia, the United Kingdom, New Zealand, Canada, Brazil and the United States.
**Not included in mean.
Additional studies can be found in the reviews by Conant et al. (Reference Conant, Paustian and Elliott2001) and by Ogle et al. (Reference Ogle, Conant and Paustian2004).
Mean annual greenhouse fluxes in CO2 equivalents/m2 per year of managed European grassland sites studied by Soussana et al. (Reference Soussana, Allard, Pilegaard, Ambus, Campbell, Ceschia, Clifton-Brown, Czobel, Domingues, Flechard, Fuhrer, Hensen, Horvath, Jones, Kasper, Martin, Nagy, Neftel, Raschi, Baronti, Rees, Skiba, Stefani, Manca, Sutton, Tuba and Valentini2007)

NCS = net carbon storage in the grassland (see equation (2)); Att-NCS = attributed net carbon storage (see equation (4)); NGHG = net greenhouse gas balance (see equation (3)); Att-NGHG = attributed net greenhouse gas balance (see equation (5)); GWP = global warming potential.
Data are means of two, four and three European sites for grazed only (meat production systems), cut and grazed (meat and dairy production systems), and cut only (dairy production systems) grasslands.
A positive value of NCS, Att-NCS, NGHG and Att-NGHG denotes a sink activity of the grassland ecosystems.
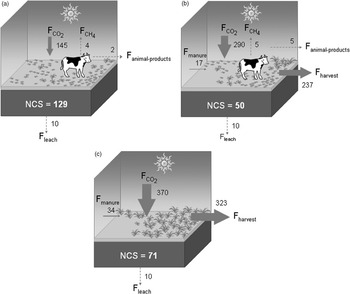
The average C storage was initially estimated at 104 ± 73 g C/m2 per year, but without accounting for C leaching and for C exports in animal products (Soussana et al., Reference Soussana, Allard, Pilegaard, Ambus, Campbell, Ceschia, Clifton-Brown, Czobel, Domingues, Flechard, Fuhrer, Hensen, Horvath, Jones, Kasper, Martin, Nagy, Neftel, Raschi, Baronti, Rees, Skiba, Stefani, Manca, Sutton, Tuba and Valentini2007). NCS and component fluxes are shown in Figure 2. Results, corrected for animal exports (Fanimal-products) and for C leaching (Fleach), show that NCS varied between 50 and 129 g C/m2 per year and was higher in grazed than in cut grasslands (Figure 2). Across sites, NCS declined with the degree of herbage utilisation by herbivores through grazing and cutting (Soussana et al., Reference Soussana, Allard, Pilegaard, Ambus, Campbell, Ceschia, Clifton-Brown, Czobel, Domingues, Flechard, Fuhrer, Hensen, Horvath, Jones, Kasper, Martin, Nagy, Neftel, Raschi, Baronti, Rees, Skiba, Stefani, Manca, Sutton, Tuba and Valentini2007), which underlines that grassland C sequestration per unit area is favoured by extensive management provided that nutrients are not limiting (Allard et al., Reference Allard, Soussana, Falcimagne, Berbigier, Bonnefond, Ceschia, D’hour, Hénault, Laville, Martin and Pinarès-Patino2007; Klumpp et al., Reference Klumpp, Soussana and Falcimagne2007). The uncertainty associated to NCS can be estimated using Gaussian error propagation rules and accounting for site number in each management type. NCS uncertainty reached 25% and 80% of the mean (data not shown) for grazed and for cut and mixed systems, respectively. Indeed, Ammann et al. (Reference Ammann, Flechard, Leifeld, Neftel and Fuhrer2007) reported that cutting and manure application introduce further uncertainties in NCS estimates.
Carbon fluxes (g C/m2 per year) in managed European grassland systems studied by Soussana et al. (Reference Soussana, Allard, Pilegaard, Ambus, Campbell, Ceschia, Clifton-Brown, Czobel, Domingues, Flechard, Fuhrer, Hensen, Horvath, Jones, Kasper, Martin, Nagy, Neftel, Raschi, Baronti, Rees, Skiba, Stefani, Manca, Sutton, Tuba and Valentini2007). Net carbon storage in the grassland (NCS, see equation (2)) in (a) grazed only, (b) cut and grazed and (c) cut only grasslands is calculated as the balance of carbon fluxes. For abbreviations, see Figure 1. Data are means of two, four and three European sites for grazed only ((a), meat production systems), cut and grazed ((b), meat and dairy production systems) and cut only ((a), dairy production systems) grasslands. A standard Fleach value (10 g C/m2 per year) was assumed for all sites. C exports in animal products were assumed to reach 2% and 20% of C intake for meat and milk production, respectively (see text). Grazed sites: Hungary, France, Italy (see Allard et al., Reference Allard, Soussana, Falcimagne, Berbigier, Bonnefond, Ceschia, D’hour, Hénault, Laville, Martin and Pinarès-Patino2007; Soussana et al., Reference Soussana, Allard, Pilegaard, Ambus, Campbell, Ceschia, Clifton-Brown, Czobel, Domingues, Flechard, Fuhrer, Hensen, Horvath, Jones, Kasper, Martin, Nagy, Neftel, Raschi, Baronti, Rees, Skiba, Stefani, Manca, Sutton, Tuba and Valentini2007; Table 1). Cut and grazed sites: Scotland, Ireland and the Netherlands (see Soussana et al., Reference Soussana, Allard, Pilegaard, Ambus, Campbell, Ceschia, Clifton-Brown, Czobel, Domingues, Flechard, Fuhrer, Hensen, Horvath, Jones, Kasper, Martin, Nagy, Neftel, Raschi, Baronti, Rees, Skiba, Stefani, Manca, Sutton, Tuba and Valentini2007; Table 1). Cut sites: Switzerland (see Ammann et al., Reference Ammann, Flechard, Leifeld, Neftel and Fuhrer2007; Table 1). A positive value of NCS and attributed NCS denotes a sink activity of the grassland ecosystem.

A literature search shows that grassland C sequestration reaches on average 5 ± 30 g C/m2 per year according to inventories of SOC stocks and 22 ± 56 g C/m2 per year according to C flux balance (Table 1). These two estimates are therefore not significantly different, although there has not yet been any direct comparison at the same site between C flux and C stock change measurements. According to both flux (−231 and 77 g C/m2 per year, respectively, Table 1A) and inventory (Bellamy et al., Reference Bellamy, Loveland, Bradley, Lark and Kirk2005) methods, organic soils would be more susceptible of losing carbon than mineral soils, which underlines the need to preserve high soil C stocks.
Carbon flux studies show that NCS is affected by a number of site-specific factors, including grassland type (newly established v. permanent, Byrne et al., Reference Byrne, Kiely and Leahy2005), N fertiliser supply (Ammann et al., Reference Ammann, Flechard, Leifeld, Neftel and Fuhrer2007), grazing pressure (Allard et al., Reference Allard, Soussana, Falcimagne, Berbigier, Bonnefond, Ceschia, D’hour, Hénault, Laville, Martin and Pinarès-Patino2007), drainage (Nieveen et al., Reference Nieveen, Campbell, Schipper and Blair2005; Rogiers et al., Reference Rogiers, Conen, Furger, Stöcklis and Eugster2008) and burning (Suyker and Verma, Reference Suyker and Verma2001) (Table 1). In addition, annual rainfall, temperature and radiation (Hunt et al., Reference Hunt, Kelliher, McSeveny, Ross and Whitehead2004; Ciais et al., Reference Ciais, Reichstein, Viovy, Granier, Ogee, Allard, Aubinet, Buchmann, Bernhofer, Carrara, Chevallier, De Noblet, Friend, Friedlingstein, Grunwald, Heinesch, Keronen, Knohl, Krinner, Loustau, Manca, Matteucci, Miglietta, Ourcival, Papale, Pilegaard, Rambal, Seufert, Soussana, Sanz, Schulze, Vesala and Valentini2005; Gilmanov et al., Reference Gilmanov, Soussana, Aires, Allard, Amman, Balzarolo, Barcza, Bernhofer, Campbell, Cernusca, Cescatti, Clifton-Brown, Dirks, Dore, Eugster, Fuhrer, Gimeno, Gruenwald, Haszpra, Hensen, Ibrom, Jacobs, Jones, Lanigan, Laurila, Lohila, Manca, Marcolla, Nagy, Pilegaard, Pinter, Raschi, Rogiers, Sanz, Stefani, Sutton, Tuba, Valentini, Williams and Wohlfahrt2007; Soussana et al., Reference Soussana, Allard, Pilegaard, Ambus, Campbell, Ceschia, Clifton-Brown, Czobel, Domingues, Flechard, Fuhrer, Hensen, Horvath, Jones, Kasper, Martin, Nagy, Neftel, Raschi, Baronti, Rees, Skiba, Stefani, Manca, Sutton, Tuba and Valentini2007) play an important role for the variability in NCS between years and between sites. Other possibly overlooked factors in C flux studies include past changes in land use (e.g. from arable to grassland) and grassland management (e.g. increased fertilisation, reduced herbage utilisation by grazing and cutting), which have carry-over effects on soil C pools. In addition, the recent rise in air temperature, in atmospheric CO2 concentration and in N deposition has enhanced plant growth in northern mid-latitudes and high latitudes (Nemani et al., Reference Nemani, Keeling, Hashimoto, Jolly, Piper, Tucker, Myneni and Running2003). Global change would therefore force grassland soils out of equilibrium, possibly leading to a transient increase in SOC stocks in temperate regions as a result of increased net primary productivity. Further research is needed to disentangle such global factors from management factors, in order to attribute grassland C sequestration to direct anthropogenic changes (land use and land management) and/or to climatic and atmospheric changes.
The greenhouse gas balance of managed grasslands
When assessing the impact of land use and land-use change on GHG emissions, it is important to consider the impacts on all GHGs (Robertson et al., Reference Robertson, Paul and Harwood2000). N2O and CH4 emissions are often expressed in terms of CO2 equivalents, which is possible because the radiative forcing of nitrous oxide, methane and carbon dioxide, can be integrated over different timescales and compared to that for CO2. For example, over the 100-year timescale, on a kilogram-for-kilogram basis, one unit of nitrous oxide has the same global warming potential (GWP) as 298 units of carbon dioxide ( = 298), whereas one unit of methane has the same GWP as 25 units of carbon dioxide (
 = 25) (IPCC, 2007). An integrated approach is needed to quantify in CO2 equivalents the fluxes of all the three trace gases (CO2, CH4 and N2O).
Management choices to reduce emissions involve important trade-offs: for example, preserving grasslands and adapting their management to improve C sequestration in the soil may actually increase N2O and CH4 emissions at farm scale. As agricultural management is one of the key drivers of the sequestration and emission processes, for grasslands there is potential to reduce the net GHG flux, expressed in CO2 equivalents. Methane emissions by enteric fermentation under grazing conditions are reviewed in details by Martin et al. (Reference Martin, Morgavi and Doreau2009). Below, we focus on N2O emissions and on the GHG balance in CO2 equivalents.
Nitrous oxide emissions from grassland soils
Biogenic emissions of N2O from soils result primarily from the microbial processes nitrification and denitrification. N2O is a by-product of nitrification and an intermediate during denitrification. Nitrification is the aerobic microbial oxidation of ammonium to nitrate and denitrification is the anaerobic microbial reduction of nitrate through nitrite, nitric oxide (NO) and N2O to N2. Nitrous oxide is a gaseous product that may be released from both processes to the soil atmosphere.
Major environmental regulators of these processes are temperature, pH, soil moisture (i.e. oxygen availability) and C availability (Velthof and Oenema, Reference Velthof and Oenema1997). In most agricultural soils, biogenic formation of N2O is enhanced by an increase in available mineral nitrogen, which in turn increases nitrification and denitrification rates. Hence, in general, addition of fertiliser N or manures and wastes containing inorganic or readily mineralisable N, will stimulate N2O emission, as modified by soil conditions at the time of application. N2O losses under anaerobic conditions are usually considered more important than nitrification-N2O losses under aerobic conditions (Skiba and Smith, Reference Skiba and Smith2000).
For given soil and climate conditions, N2O emissions are likely to scale with the nitrogen fertiliser inputs. Therefore, the current IPCC (2006) methodology assumes a default emission factor (EF1) of 1% (ranging from 0.3% to 3%) for non-tropical soils emitted as N2O per unit nitrogen input N (0.003 to 0.03 kg N2O-N/kg N input).
N2O emissions in soils usually occur in ‘hot spots’ associated with urine spots and particles of residues and fertiliser, despite the diffused spreading of fertilisers and manure (Flechard et al., Reference Flechard, Ambus, Skiba, Rees, Hensen, van Amstel, van den Pol-van Dasselaar, Soussana, Jones, Clifton-Brown, Raschi, Horvath, Neftel, Jocher, Ammann, Leifeld, Fuhrer, Calanca, Thalman, Pilegaard, Di Marco, Campbell, Nemitz, Hargreaves, Levy, Ball, Jones, van de Bulk, Groot, Blom, Domingues, Kasper, Allard, Ceschia, Cellier, Laville, Henault, Bizouard, Abdalla, Williams, Baronti, Berreti and Grosz2007). Nitrous oxide emissions from grasslands also tend to occur in short-lived bursts following the application of fertilisers (Clayton et al., Reference Clayton, McTaggart, Parker, Swan and Smith1997; Leahy et al., Reference Leahy, Kiely and Scanlon2004). Temporal and spatial variations contribute large sources of uncertainty in N2O fluxes at the field and annual scales (Flechard et al., Reference Flechard, Neftel, Jocher, Ammann and Fuhrer2005). The overall uncertainty in annual flux estimates derived from chamber measurements may be as high as 50% owing to the temporal and spatial variability in fluxes, which warrants the future use of continuous measurements, if possible at the field scale (Flechard et al., Reference Flechard, Ambus, Skiba, Rees, Hensen, van Amstel, van den Pol-van Dasselaar, Soussana, Jones, Clifton-Brown, Raschi, Horvath, Neftel, Jocher, Ammann, Leifeld, Fuhrer, Calanca, Thalman, Pilegaard, Di Marco, Campbell, Nemitz, Hargreaves, Levy, Ball, Jones, van de Bulk, Groot, Blom, Domingues, Kasper, Allard, Ceschia, Cellier, Laville, Henault, Bizouard, Abdalla, Williams, Baronti, Berreti and Grosz2007). In the same study, annual emission factors for fertilised systems were highly variable, but the mean emission factor (0.75%) was substantially lower than the IPCC default value of 1.0% for direct emissions of N2O from N fertilisers (Flechard et al., Reference Flechard, Ambus, Skiba, Rees, Hensen, van Amstel, van den Pol-van Dasselaar, Soussana, Jones, Clifton-Brown, Raschi, Horvath, Neftel, Jocher, Ammann, Leifeld, Fuhrer, Calanca, Thalman, Pilegaard, Di Marco, Campbell, Nemitz, Hargreaves, Levy, Ball, Jones, van de Bulk, Groot, Blom, Domingues, Kasper, Allard, Ceschia, Cellier, Laville, Henault, Bizouard, Abdalla, Williams, Baronti, Berreti and Grosz2007).
The relationship, on a global basis, between the amount of N fixed by chemical, biological or atmospheric processes entering the terrestrial biosphere, and the total emission of N2O shows an overall conversion factor of 3% to 5% (Crutzen et al., Reference Crutzen, Mosier, Smith and Winiwarter2007). This factor is covered only in part by the 1% of direct emissions factor. Additional indirect emissions, resulting from further N2O emissions at the landscape scale, are also accounted for by IPCC (2006).
Methane exchanged with grassland soils
In soils, methane is formed under anaerobic conditions at the end of the reduction chain when all other electron acceptors such as, for example, nitrate and sulphate, have been used. Methane emissions from freely drained grassland soils are, therefore, negligible. In fact, aerobic grassland soils tend to oxidise methane at a larger rate than cropland soil (6 and 3 kg CH4/ha per year respectively), but less so than uncultivated soils (Boeckx and Van Cleemput, Reference Boeckx and Van Cleemput2001). In contrast, in wet grasslands as in wetlands, the development of anaerobic conditions in soils may lead to methane emissions. In an abandoned peat meadow, methane emissions were lower in water-unsaturated compared to water-saturated soil conditions (Hendriks et al., Reference Hendriks, van Huissteden, Dolman and van der Molen2007). Keppler et al. (Reference Keppler, Hamilton, Brass and Rockmann2006) have shown the emissions of low amounts of CH4 by terrestrial plants under aerobic conditions. However, this claim has not been confirmed since and was shown to be caused by an experimental artefact (Dueck et al., Reference Dueck, de Visser, Poorter, Persijn, Gorissen, de Visser, Shapendonk, Vergahen, Snel, Harren, Ngai, Verstappen, Bouwmeester, Voesenek and Van Der Werf2007).
Budgeting the greenhouse gas balance of grasslands
Budgeting equations can be extended to include fluxes ( and
 ) of non-CO2 radiatively active trace gases and calculate a net exchange rate in CO2 equivalents (net greenhouse gas balance, NGHG; g CO2/m2 per year, equation (3)), using the GWP of each gas at the 100-years time horizon (IPCC, 2007):

where  = 44/12 g CO2-g C,
 is the methane emission (g CH4/m2 per year) and
 is the nitrous oxide emission (g N2O/m2 per year). CH4 is not double counted as CO2 in equation (4), as
 is added to NCS.
On average, of the nine sites covered by the ‘GreenGrass’ European project, the grassland plots displayed annual N2O and CH4 emissions of 39 and 101 g CO2 equivalents/m2 per year, respectively (Table 2). Hence, when expressed in CO2 equivalents, emissions of N2O and CH4 compensated 10% and 34% of the on-site grassland C sequestration, respectively. The mean on-site NGHG reached 198 g CO2 equivalents/m2 per year, indicating a sink for the atmosphere. Nevertheless, sites that were intensively managed by grazing and cutting had a negative NGHG and were therefore estimated to be GHG sources in CO2 equivalents.
Vulnerability of soil organic carbon to climate change
Although the ancient carbon located in the deep soil is presumably protected from microbial decomposition by a lack of easily degradable substrates (Fontaine et al., Reference Fontaine, Mariotti and Abbadie2003), soil C stocks in grassland ecosystems are vulnerable to climate change. The 2003 heat wave and drought reduced by 30% the total gross primary productivity over Europe, which resulted in a strong anomalous net source of carbon dioxide (0.5 Gt C per year) to the atmosphere and reversed the effect of 4 years of net ecosystem C sequestration (Ciais et al., Reference Ciais, Reichstein, Viovy, Granier, Ogee, Allard, Aubinet, Buchmann, Bernhofer, Carrara, Chevallier, De Noblet, Friend, Friedlingstein, Grunwald, Heinesch, Keronen, Knohl, Krinner, Loustau, Manca, Matteucci, Miglietta, Ourcival, Papale, Pilegaard, Rambal, Seufert, Soussana, Sanz, Schulze, Vesala and Valentini2005). An increase in future drought events could therefore turn temperate grasslands into C sources, contributing to positive carbon-climate feedbacks already anticipated in the tropics and at high latitudes (Betts et al., Reference Betts, Cox, Collins, Harris, Huntingford and Jones2004; Ciais et al., Reference Ciais, Reichstein, Viovy, Granier, Ogee, Allard, Aubinet, Buchmann, Bernhofer, Carrara, Chevallier, De Noblet, Friend, Friedlingstein, Grunwald, Heinesch, Keronen, Knohl, Krinner, Loustau, Manca, Matteucci, Miglietta, Ourcival, Papale, Pilegaard, Rambal, Seufert, Soussana, Sanz, Schulze, Vesala and Valentini2005; Bony et al., Reference Bony, Colman, Kattsov, Allan, Bretherton, Dufresne, Hall, Hallegatte, Holland, Ingram, Randall, Soden, Tselioudis and Webb2006). Gilmanov et al. (Reference Gilmanov, Tieszen, Wylie, Flanagan, Frank, Haferkamp, Meyers and Morgan2005) have also shown that a source type of activity is not an exception for the mixed prairie ecosystems in North America, especially during years with lower than normal precipitation.
The atmospheric conditions that result in such heat-wave conditions are likely to increase in frequency (Meehl and Tebaldi, Reference Meehl and Tebaldi2004) and may approach the norm by 2080 under scenarios with high GHG emissions (Beniston, Reference Beniston2004; Schär and Jendritzky, Reference Schär and Jendritzky2004). The rise in atmospheric CO2 reduces the sensitivity of grassland ecosystems to drought (Morgan et al., Reference Morgan, Pataki, Korner, Clark, Del Grosso, Grunzweig, Knapp, Mosier, Newton, Niklaus, Nippert, Nowak, Parton, Polley and Shaw2004) and increases grassland productivity by 5% to 15% depending on water and nutrients availability (Soussana and Hartwig, Reference Soussana and Hartwig1996; Soussana et al., Reference Soussana, Casella and Loiseau1996; Tubiello et al., Reference Tubiello, Soussana, Howden and Easterling2007). However, these positive effects are unlikely to offset the negative impacts of high temperature changes and reduced summer rainfall, which would lead to more frequent and more intense droughts (Lehner et al., Reference Lehner, Doll, Alcamo, Henrichs and Kaspar2006) and, presumably, C loss from soils.
The possible implication of climate change was studied by Smith et al. (Reference Smith, Smith, Wattenbach, Zaehle, Hiederer, Jones, Montanarella, Rounsevell, Reginster and Ewert2005) who calculated soil C change using the Rothamsted carbon model and using climate data from four global climate models implementing four IPCC emission scenarios. Changes in net primary production (NPP) were calculated by the Lund–Potsdam–Jena model. Land-use change scenarios were used to project changes in cropland and grassland areas. Projections for 1990 to 2080 for mineral soil show that climate effects (soil temperature and moisture) will tend to speed decomposition and cause soil C stocks to decrease, whereas increases in C input because of increasing NPP could slow the loss.
According to empirical niche-based models, projected changes in temperature and precipitation are likely to lead to large shifts in the distribution of plant species, with negative effects on biodiversity at regional and global scales (Thomas et al., Reference Thomas, Cameron, Green, Bakkenes, Beaumont, Collingham, Erasmus, De Siqueira, Grainger, Hannah, Hughes, Huntley, Van Jaarsveld, Midgley, Miles, Ortega-Huerta, Peterson, Phillips and Williams2004; Thuiller et al., Reference Thuiller, Lavorel, Araujo, Sykes and Prentice2005). Although such model predictions are highly uncertain, experiments do support the concept of fast changes in plant species composition and diversity under elevated CO2, with complex interactions with warming and changes in rainfall (Teyssonneyre et al., Reference Teyssonneyre, Picon-Cochard, Falcimagne and Soussana2002; Picon-Cochard et al., Reference Picon-Cochard, Teyssonneyre, Besle and Soussana2004). Indeed, warming and altered precipitation have been shown to affect plant community structure and species diversity in rainfall manipulation experiments (Zavaleta et al., Reference Zavaleta, Shaw, Chiariello, Mooney and Field2003; Klein et al., Reference Klein, Harte and Zhao2005).
Biodiversity experiments have shown causal relationships between species number or functional diversity, ecosystem productivity (e.g. Tilman et al., Reference Tilman, Lehman and Thomson1997; Hector et al., Reference Hector, Schmid, Beierkuhnlein, Caldeira, Diemer, Dimitrakopoulos, Finn, Freitas, Giller, Good, Harris, Hogberg, Huss-Danell, Joshi, Jumpponen, Korner, Leadley, Loreau, Minns, Mulder, O’Donovan, Otway, Pereira, Prinz, Read, Scherer-Lorenzen, Schulze, Siamantziouras, Spehn, Terry, Troumbis, Woodward, Yachi and Lawton1999; Röscher et al., Reference Röscher, Temperton, Scherer-Lorenzen, Schmitz, Schumacher, Schmid, Buchmann, Weisser and Schulze2005) and C sequestration (Tilman et al., Reference Tilman, Reich and Knops2006a and Reference Tilman, Reich and Knops2006b, Klumpp and Soussana, Reference Klumpp and Soussana2009). Therefore, another threat to C sequestration by grassland soils stems from the rapid loss of plant diversity, which is projected under climate change.
The role of grassland carbon sequestration for the GHG balance of livestock systems
There are still substantial uncertainties in most components of the GHG balance of livestock production systems. Methods developed for national and global GHG inventories are inaccurate at the farm scale. Livestock production systems can be ranked differently depending on the approach (plot scale, on farm budget, lifecycle analysis) and on the criteria (emissions per unit land area or per unit animal product) selected (Schils et al., Reference Schils, Olesen, del Prado and Soussana2007). Moreover, C sequestration (or loss) plays an important (Table 1D), but often neglected, role in the farm GHG budget.
Carbon transfer between different fields is very common in livestock production systems. The application of organic manure to certain fields may also strongly vary from year to year (depending for example on the nutrient status). To date, grassland C sequestration has mostly been studied at the field scale, neglecting the post-harvest fate of the cut herbage. The calculation of NCS considers that the total carbon in the harvested herbage returns within one year to the atmosphere. This is usually not the case, as the non-digestible carbon in this pool will be excreted by ruminants and incorporated into manure that will be spread after storage either on the same or on another field. Off-site C sequestration will occur whenever more C manure is produced by than that returned to a grassland plot. To make some progress, we estimate below the off-site C and GHG balance of the harvested herbage.
Carbon balance during housing
When considering an off-site balance, the system boundaries need to be defined. In the barn, ruminant’s digestion of the harvested herbage (Fharvest) leads to additional C losses as respiratory CO2 and methane from enteric fermentation and to the production of animal effluents (manure). The manure generated by harvests from a given grassland field will be brought to other fields (grassland or arable) thereby contributing to their own carbon budgets. To avoid double counting, we only attribute to a given grassland field the surplus, if any, of decomposed C manure that it generates compared to the amount of manure it receives (Figure 3). On-site decomposition of manure C supplied to the studied grassland field contributes to ecosystem respiration ( ; equation (2)) and is therefore not double counted as an off-site CO2 flux.
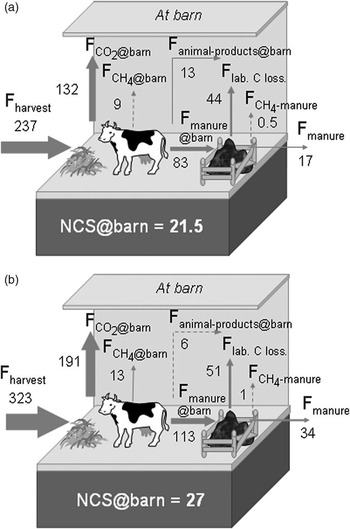
Carbon fluxes (g C/m2 per year) in managed European grassland systems studied by Soussana et al. (Reference Soussana, Allard, Pilegaard, Ambus, Campbell, Ceschia, Clifton-Brown, Czobel, Domingues, Flechard, Fuhrer, Hensen, Horvath, Jones, Kasper, Martin, Nagy, Neftel, Raschi, Baronti, Rees, Skiba, Stefani, Manca, Sutton, Tuba and Valentini2007). Net carbon storage in the barn (NCS@barn) in (a) cut and grazed and (b) cut only grasslands are calculated as the balance of carbon fluxes.  , Fanimal-products@barn and Flabile-C-losses are, respectively, CO2 emissions, C exports in animal products from ruminants and CO2 losses from microbial degradation of farm effluents during storage and after spreading.
 and
 are the CH4 emissions at barn from enteric fermentation and farm effluents, respectively. For other abbreviations, see Figure 1. Carbon fluxes at barn were estimated assuming the same type of production (meat or milk) in the barn and in the grassland and solid manure (see equation (4)). C exports in animal products at barn were assumed to be 2% and 20% of C intake for meat and milk production, respectively (see text).

Off-site C sequestration (NCS@barn) is calculated as the SOC derived from cut herbage manure that is not returned to the grassland, taking into account CH4 emission from manure management. By adding off-site C sequestration and on-site C sequestration (NCS), an attributed NCS (Att-NCS) is calculated as:

where fhumif is the fraction of non-labile C in manure, fdigest is the proportion of ingested C that is digestible and  is methane emission from farm effluents calculated according to IPCC (2006) Tier 2 method in CO2-C equivalents (Figure 3). The fraction of non-labile C in manure (fhumif) varies between 0.25 and 0.45 (Soussana et al., Reference Soussana, Loiseau, Vuichard, Ceschia, Balesdent, Chevallier and Arrouays2004).
Equation (3) assumes that (i) all harvested C is ingested by ruminants (no post-harvest losses), and (ii) that the non-digestible fraction returned as excreta is used for spreading. These assumptions could lead to an overestimation of the attributed NCS, as additional C losses take place after forage harvests (during hay drying and silage fermentation) as well as in manure storage systems. However, these losses concern the degradable fraction of manures and are thus already accounted for by the fhumif coefficient.
NCS@barn reached 21.5 and 27 g C/m2 per year for mixed and cut systems, respectively. Therefore, Att-NCS, which includes NCS@barn, was higher in grazed (129 g C/m2 per year) than in cut and mixed grassland systems (98.5 and 71 g C/m2 per year, respectively). These estimates do not include C emissions from machinery, which are higher in cut (e.g. mowing, silage making) compared to grazed systems, but are not part of the AFOLU (Agriculture, Forestry and Other Land Uses) sector and are not discussed in this review.
GHG balance during housing
GHG emissions from manure management include direct emissions of CH4 and N2O, as well as indirect emissions of N2O derived from NH3/NOx. Quantification of GHG emissions from manure are typically based on national statistics for manure production and housing systems combined with emission factors which have been defined by the IPCC or nationally (Petersen et al., Reference Petersen, Olesen and Heidmann2002). The quality of GHG inventories for manure management is critically dependent on the applicability of these emission factors.
Animal manure is collected as solid manure and urine, as liquid manure (slurry) or as deep litter, or it is deposited outside in drylots or on pastures. These manure categories represent very different potentials for GHG emissions, as also reflected in the methane conversion factors and nitrous oxide emission factors, respectively. However, even within each category the variations in manure composition and storage conditions can lead to highly variable emissions in practice. This variability is a major source of error in the quantification of the GHG balance for a system. To the extent that such variability is influenced by management and/or local climatic conditions, it may be possible to improve the procedures for estimating CH4 and N2O emissions from manure (Sommer et al., Reference Sommer, Petersen and Moller2004).
The fraction of non-labile C (fhumif) in manure increases from 0.25 to about 0.5 after composting (Rémy and Marin-La Flèche, Reference Rémy and Marin-La Flèche1976). During composting, the more degradable organic compounds are decomposed and the residual compounds, which tend to have a longer life span, increase in concentration. In one study, cumulative C losses during storage and after incubation in the soil accounted for 60% and 54% of C initially present in composted and anaerobically stored manure, respectively (Thomsen and Olesen, Reference Thomsen and Olesen2000).
In order to account for: (i) the offsite CO2, CH4 and N2O emissions resulting directly from the digestion by cattle of the forage harvests, (ii) the contribution to CH4 and N2O emissions by farm effluents and (iii) the manure and slurry applications which add organic C to the soil, an attributed net GHG balance (Att-NGHG) was adapted from Soussana et al. (Reference Soussana, Allard, Pilegaard, Ambus, Campbell, Ceschia, Clifton-Brown, Czobel, Domingues, Flechard, Fuhrer, Hensen, Horvath, Jones, Kasper, Martin, Nagy, Neftel, Raschi, Baronti, Rees, Skiba, Stefani, Manca, Sutton, Tuba and Valentini2007) as:

where  is CH4 emission by enteric fermentation at barn (g CH4/m2 per year),
 (g CH4/m2 per year) and
 (g N2O/m2 per year) are the CH4 and direct N2O emissions from farm effluents, respectively, which were calculated according to IPCC (2006) Tier 2 method (Table 2).
Estimated methane emissions at barn from cut herbage reached up to 447 g CO2 equivalents/m2 per year (Table 2) and were therefore an important component of the attributed NGHG budget of the cut sites. The attributed GHG balance was positive for grazed sites (indicating a sink activity), but was negative for cut and mixed sites (indicating a source activity) (Table 2). Therefore, a grazing management seems to be a better strategy for removing GHG from the atmosphere than a cutting management. However, given that the studied sites differed in many respects (climate, soil and vegetation) (Soussana et al., Reference Soussana, Allard, Pilegaard, Ambus, Campbell, Ceschia, Clifton-Brown, Czobel, Domingues, Flechard, Fuhrer, Hensen, Horvath, Jones, Kasper, Martin, Nagy, Neftel, Raschi, Baronti, Rees, Skiba, Stefani, Manca, Sutton, Tuba and Valentini2007), this hypothesis needs to be further tested.
Taken together, these results show that managed grasslands have a potential to remove GHG from the atmosphere, but that the utilisation of the cut herbage by ruminants may lead to large non-CO2 GHG emissions in farm buildings, which may compensate this sink activity. Data from a larger number of flux sites and from long-term experiments will be required to upscale these results at regional scale and calculate GHG balance for a range of production systems. In order to further reduce uncertainties, C and N fluxes are investigated for a number of additional grassland and wetland sites (e.g. CarboEurope and NitroEurope research project). Grassland ecosystem simulation models have also been used for upscaling these fluxes (Levy et al., Reference Levy, Mobbs, Jones, Milne, Campbell and Sutton2007; Vuichard et al., Reference Vuichard, Ciais, Viovy, Calanca and Soussana2007a) in order to estimate the C and GHG balance at the scale of Europe. Two main problems were identified: (i) the lack of consistent grassland management data across Europe; (ii) the lack of detailed grassland soil C inventories for soil model initialisation (Vuichard et al., Reference Vuichard, Ciais, Viovy, Calanca and Soussana2007a).
Including carbon sequestration in greenhouse gas budgets at farm scale
A grazing livestock farm consists in a productive unit that converts various resources into outputs as milk, meat and sometimes grains too. In Europe, many ruminant farms have mixed farming systems: they produce themselves the roughage and, most often, part of the animal’s feeds and even straw that is eventually needed for bedding. Conversely, these farms recycle animal manure by field application. Most farms purchase some inputs, such as fertilisers and feed, and they always use direct energy derived from fossil fuels. The net emissions of GHGs (methane, nitrous oxide and carbon dioxide) are related to C and nitrogen flows and to environmental conditions.
To date, only few recent models has been developed to estimate the farm GHG balance (Schils et al., Reference Schils, Olesen, del Prado and Soussana2007). Most models have used fixed emission factors both for indoors and outdoors emissions (e.g. FARM GHG, Olesen et al., Reference Olesen, Schelde, Weiske, Weisbjerg, Asman and Djurhuus2006, Lovett et al., Reference Lovett, Shalloo, Dillon and O’Mara2006). Although, these models have considered the on- and off-farm CO2 emissions (e.g. from fossil fuel combustion), they did not include possible changes in soil C resulting from the farm management. Moreover, as static factors are used rather than dynamic simulations, the environmental dependency of the GHG fluxes is not captured by these models.
A dynamic farm scale model (FarmSim) has been coupled to mechanistic simulation models of grasslands (PASIM, Riedo et al., Reference Riedo, Grub, Rosset and Fuhrer1998; Vuichard et al., Reference Vuichard, Soussana, Ciais, Viovy, Ammann, Calanca, Clifton-Brown, Fuhrer, Jones and Martin2007b) and croplands (CERES ECC). In this way, C sequestration by grasslands can be simulated (Soussana et al., Reference Soussana, Loiseau, Vuichard, Ceschia, Balesdent, Chevallier and Arrouays2004) and included in the farm budget. The IPCC methodology Tier 1 and Tier 2 is used to calculate the CH4 and N2O emissions from cattle housing and waste management systems. The net GHG balance at the farm gate is calculated in CO2 equivalents. Emissions induced by the production and transport of farm inputs (fuel, electricity, N fertilisers and feedstuffs) are calculated using a full accounting scheme based on life cycle analysis. The FarmSim model has been applied to seven contrasted cattle farms in Europe (Salètes et al., Reference Salètes, Fiorelli, Vuichard, Cambou, Olesen, Hacala, Sutton, Furhrer and Soussana2004). The balance of the farm gate GHG fluxes leads to a sink activity for four out of the seven farms. When including pre-chain emissions related to inputs, all farms – but one – were found to be net sources of GHG. The total farm GHG balance varied between a sink of −70 and a source of +310 kg CO2 equivalents per unit (GJ) energy in animal farm products. Byrne et al. (Reference Byrne, Kiely and Leahy2007), measuring C balance for two dairy farms in South West Ireland, equally considered the farm perimeter as the system boundary for inputs and outputs of C. In the two case studies, both farms appeared as net C sinks, sequestering between 200 and 215 g C/m2 per year (Table 1).
Farm scale mitigation options thus need to be carefully assessed at the production system scale, in order to minimise GHG emissions per unit meat or milk product (Schils et al., Reference Schils, Olesen, del Prado and Soussana2007). Advanced (Tier 3) and verifiable methodologies still need to be developed in order to include GHG removals obtained by farm scale mitigation options in agriculture, forestry and land use (AFOLU sector, IPCC, 2006) national GHG inventories.
Conclusions
This review shows that grassland C sequestration is detected both by C stock change (inventories and long-term experiments) and by C flux measurements, however with high variability across studies. Further development of measurement methods and of plot and farm scale models carefully tested at benchmark sites will help further reduce uncertainties. Low cost mitigation options based on enhancing C sequestration in grasslands are available. Mitigating emissions and adapting livestock production systems to climate change will nevertheless require a major international collaborative effort and the development of extended observational networks combining C (and non-CO2-GHG) flux measurements and long-term experiments to detect C stock changes. Carbon sequestration could play an important role in climate mitigation, but because of its potential reversibility preserving current soil C stocks and reducing CH4 and N2O emissions is strongly needed.
Acknowledgements
Tiphaine Tallec is funded by a research grant from the French Ministry for Research and Higher Education. This research was funded by the EC FP6 ‘CarboEurope IP’ and ‘NitroEurope IP’ projects.