


Introduction
Chronic, non-communicable diseases such as CVD, cancer, diabetes and respiratory disease are major contributors to mortality figures worldwide, accounting for 74% of the total number of deaths.(1) Unhealthy lifestyle habits (unhealthy diets, physical inactivity, tobacco use and alcohol misuse) contribute to the aetiology of non-communicable diseases, and along with obesity, can be identified as modifiable risk factors.(Reference Budreviciute, Damiati and Sabir2) Over the past 20 years there has been a marked rise in the prevalence of overweight and obesity in Turkey in both adults and children.(Reference Erem3) Nutritional transition and decreased physical activity levels are the leading causes of obesity in middle-income countries, among which Turkey can be counted.(Reference Ford, Patel and Narayan4) Nutrition transition refers to the shift toward Western dietary patterns characterized by a preference for ultra-processed foods rich in sugar, fat and refined carbohydrates.(Reference Budreviciute, Damiati and Sabir2) Food literacy is considered an important factor associated with healthier food choices,(Reference Krause, Sommerhalder and Beer-Borst5–Reference LeBlanc, Ward and LeBlanc7) and higher food literacy levels be related to healthier dietary preferences and greater awareness of unhealthy dietary habits.(Reference Hawkes, Smith and Jewell8,Reference Lee, Kim and Jung9)
Food literacy has been defined as the scaffolding that empowers individuals, households, communities, or nations to protect diet quality through change and strengthen dietary resilience over time. It comprises a collection of inter-related knowledge, skills, and behaviours required to plan, manage, select, prepare, and eat food to meet needs and determine dietary intake.(Reference Vidgen and Gallegos10) Although several definitions of food literacy have been proposed in the literature, common elements consistently include food-related knowledge, skills, and behaviours.(Reference Truman, Lane and Elliott11) Building on this conceptualization, self-perceived food literacy (SPFL) refers to an individual’s perceived ability to apply food-related knowledge, skills, and behaviours in everyday life.(Reference Poelman, Dijkstra and Sponselee12) Food-literate individuals are aware of how their personal food and nutrition choices affect both personal health and broader societal outcomes.(Reference Krause, Sommerhalder and Beer-Borst5)
To address the above-mentioned features of food literacy, there has been an increase in the number of food literacy programmes initiated in schools in recent years.(Reference Bailey, Drummond and Ward13,Reference Kelly and Nash14) Such programmes aim to educate and encourage students to make healthy food choices and to develop healthy eating behaviours.(Reference Bröder, Okan and Bauer15) With this in mind, evaluating food literacy among school teachers is important because they are key stakeholders in the implementation and success of school-based food literacy education.(Reference Nanayakkara, Margerison and Worsley16) School teachers are in continuous and intensive contact with students within the school setting, and play a significant role in shaping classroom practices, learning environments, and health-related behaviours.(Reference Altinyelken17)
Previous studies have evaluated the nutrition-related knowledge, attitudes, and nutrition literacy of teachers.(Reference Sharma, Dortch and Byrd-Williams18–Reference Chatzinikola, Papavasileiou and Andreadakis20) A systematic review of the definitions of nutrition literacy and food literacy concluded that these constructs represent distinct but complementary forms of health literacy.(Reference Krause, Sommerhalder and Beer-Borst5) Definitions of nutrition literacy mainly describe the abilities necessary to obtain and understand nutrition-related information, whereas definitions of food literacy encompass a broader spectrum of theoretical and practical knowledge and skills. Furthermore, food literacy includes the ability to apply information related to food choices and to critically reflect on the effects of food choices on both personal health and society.(Reference Krause, Sommerhalder and Beer-Borst5) Nevertheless, studies specifically examining food literacy among teacher populations remain scarce. Although food literacy is generally conceptualized as a broad construct encompassing food-related knowledge, skills, and behaviours(Reference Vidgen and Gallegos10,Reference Truman, Lane and Elliott11) , some conceptual models also incorporate attitudinal components within the broader food literacy construct.(Reference Perry, Thomas and Samra21) Nevertheless, attitudes toward healthy nutrition have also been examined as a separate construct in studies investigating dietary choices, eating behaviours, and dietary quality.(Reference Cooke and Papadaki22,Reference Lê, Dallongeville and Wagner23) Attitudes guide, affect, direct, shape and predict actual behaviours,(Reference Kraus24) and have been identified as one of the multiple drivers of food-related consumer behaviours(Reference Demartini, De Marchi and Cavaliere25) and healthy eating practices.(Reference Kearney, Gibney and Livingstone26) Furthermore, individuals with higher educational attainment are more likely to express positive attitudes toward healthy nutrition, which may influence their food choices.(Reference Lê, Dallongeville and Wagner23) Accordingly, positive attitudes toward healthy nutrition have been associated with healthier dietary behaviours and food choices.(Reference Friese, Hofmann and Wänke27) Given that both food literacy and attitudes toward healthy nutrition have been linked to food choices and dietary behaviours, examining these constructs together may provide a more comprehensive understanding of factors associated with healthy eating.
Food literacy can be affected by such socio-demographic factors as age(Reference Sponselee, Kroeze and Poelman28) and sex.(Reference Sponselee, Kroeze and Poelman28–Reference Murakami, Shinozaki and Yuan30) The female sex(Reference Sponselee, Kroeze and Poelman28,Reference Murakami, Shinozaki and Yuan30) and older age(Reference Sponselee, Kroeze and Poelman28) are associated with greater food literacy. While females and older adults tend to have more positive attitudes toward healthy eating,(Reference Hearty, McCarthy and Kearney31) the difference between sexes in terms of attitudes towards nutrition among school teachers is not significant.(Reference Kana’An, Saadeh and Zruqait32) Studies investigating the relationship between food literacy and BMI have reported inconsistent findings.(Reference Sponselee, Kroeze and Poelman28–Reference Murakami, Shinozaki and Yuan30,Reference Boariu, Scutariu and Reurean Pintilei33,Reference Arslan, Ayyıldız and Esin34) While some studies identified an inverse association between food literacy and BMI,(Reference Bazzani, Amato and Faraguna29,Reference Murakami, Shinozaki and Yuan30,Reference Arslan, Ayyıldız and Esin34) others reported no significant relationship.(Reference Sponselee, Kroeze and Poelman28,Reference Boariu, Scutariu and Reurean Pintilei33) Given the inconsistent findings reported in the literature, further investigation of the relationship between food literacy and BMI is warranted. Furthermore, little is known about the relationships among food literacy, attitudes towards healthy nutrition, and BMI among school teachers. Therefore, the present study aimed to investigate the associations among food literacy, attitudes towards healthy nutrition, and BMI among school teachers.
Methods
Participants
This cross-sectional study was conducted with 294 Turkish primary, secondary and high school teachers working at Bartın, Zonguldak and Samsun Provinces in Western Black Sea Region of Turkey between May 2022 and July 2022. The total sample size for the study was computed as 268 school teachers when the Type 1 error was 0.05 and the power of the study was 90%. Excluded from the study were retired teachers and those working in adult education centres. Additional methodological details have been reported previously.(Reference Kabasakal Çetin35) All procedures involving the research of study participants were approved by the Hacettepe University Non-Interventional Clinical Researches Ethics Board (GO: 22-474).
Data collection procedures and measures
The online questionnare form (Google) was sent to the participants via Whatsapp or e-mail. On the first page of the questionnaire the respondents were provided details about the study and were asked to tick a box indicating that they agreed to participate in the study. The questionnaire garnered data on demographic variables (sex, age, marital status, years of experience, smoking status), anthropometric measurements (body weight and height) and eating habits (skipping meals during the day and skipped meals). In addition, SPFL and ASHN were used in this study.
Anthropometric measurements
The participants were asked to self-report their current weight and height, and if the weight measurement had not been carried out within a period of one month, they were encouraged to weigh and report the current measurements. BMI was calculated and the participants were classified based on the World Health Organization criteria.(Reference Weir and Jan36)
Self-perceived food-literacy scale
SPFLS, a measure of the food literacy of individuals, is based on their knowledge, skills and behaviours in the planning, management, selection, preparation and eating of healthy foods.(Reference Poelman, Dijkstra and Sponselee12) The SPFL scale, developed in 2018, comprises 29 items under the eight subscales of food preparation skills; resilience and resistance; healthy snack styles; social and conscious eating; examining food labels; daily food planning; healthy budgeting; and healthy food stockpiling. The items are rated on a 5-point Likert-type scale (1= ‘not at all/never’ – 5 = ‘yes/always’), with negative items scored in reverse. The higher the total score on the scale, the greater the food literacy.(Reference Poelman, Dijkstra and Sponselee12) The SPFL Scale was adapted to the Turkish context and identified as a valid and reliable scale by Selçuk et al.(Reference Selçuk, Çevik and Baydur37)
Attitude Scale for Healthy Nutrition
The Attitude Scale for Healthy Nutrition (ASHN) was developed by Demir and Cicioğlu in 2019 as a valid and reliable measurement of healthy eating attitudes in the Turkish population.(Reference Demir and Cicioğlu38) The ASHN comprises 21 items that are scored on a five-point Likert-type scale that is scored on a scale of 1 (strongly agree) to 5 (strongly disagree). The ASHN contains four subscales (information on nutrition, emotion for nutrition, positive nutrition and malnutrition), with a reported Cronbach’s alpha of the subscales of 0.75–0.90. The total scores that can be obtained are in the range of 21–105, with higher scores indicating a more favourable attitude toward healthy nutrition.
Statistical analyses
IBM SPSS Statistics (Version 22.0. Armonk, NY: IBM Corp.) was used for the statistical analyses. The variables were investigated using histograms and probability plots and Kolmogorov–Smirnov test to test normality. Descriptive analyses were presented using tables of frequencies for ordinal variables, and means and standard deviations for normally distributed variables. A One-way ANOVA was applied to compare the scale scores of the BMI classification groups. In addition, ANCOVA was performed for BMI-related group comparisons with age included as a covariate. When an overall p-value of less than 0.05 was observed, pairwise post hoc tests were performed using Tukey’s test and Bonferroni-adjusted comparisons for ANCOVA. Student’s t test was used in paired group comparisons. While investigating the associations between normally distributed variables, a Pearson test was used to calculate the correlation coefficients and their significance. A multiple linear regression model was used to identify independent predictors of SPFL and adjusted for age, sex, monthly household income, and years of experience.
Results
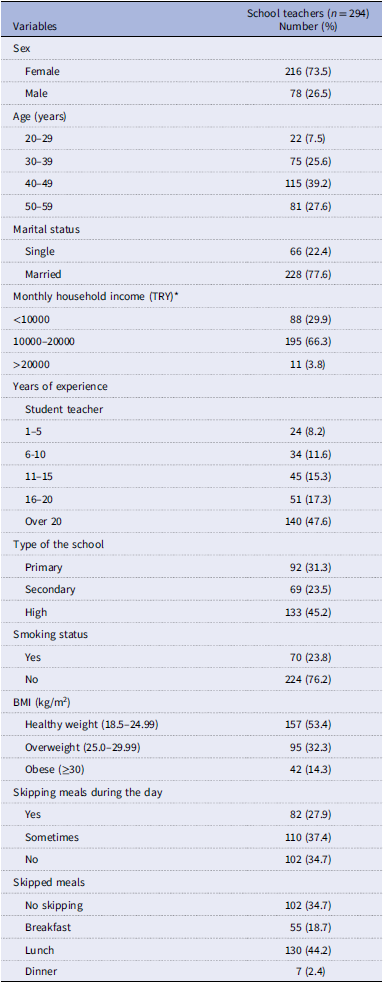
Included in the study were a total of 294 school teachers aged 20–59 years, of which 216 (73.5%) were female and 77.6% were married. Of the total, 53.4% had a normal body weight and 76.2% were non-smokers, while 66.3% reported a monthly income between 10,000 and 20,000 TRY (Table 1). An examination of eating habits revealed that 27.9% and 37.4% of school teachers always and sometimes skipped meals during the day, respectively, with lunch being the meal most frequently skipped (44.2%) (Table 1).
Sociodemographic characteristics and eating habits of school teachers

Table 1. Long description
The table presents sociodemographic characteristics and eating habits of 294 school teachers. It has 16 rows and 2 columns. The columns are labeled ‘Variables’ and ‘School teachers (n = 294) Number (%)’. The rows are labeled with different variables and their corresponding percentages. Row 1: Sex, Female, 216 (73.5). Row 2: Sex, Male, 78 (26.5). Row 3: Age (years), 20-29, 22 (7.5). Row 4: Age (years), 30-39, 75 (25.6). Row 5: Age (years), 40-49, 115 (39.2). Row 6: Age (years), 50-59, 81 (27.6). Row 7: Marital status, Single, 66 (22.4). Row 8: Marital status, Married, 228 (77.6). Row 9: Monthly household income (TRY), <10000, 88 (29.9). Row 10: Monthly household income (TRY), 10000-20000, 195 (66.3). Row 11: Monthly household income (TRY), >20000, 11 (3.8). Row 12: Years of experience, Student teacher, 24 (8.2). Row 13: Years of experience, 1-5, 34 (11.6). Row 14: Years of experience, 6-10, 45 (15.3). Row 15: Years of experience, 11-15, 51 (17.3). Row 16: Years of experience, Over 20, 140 (47.6). Row 17: Type of the school, Primary, 92 (31.3). Row 18: Type of the school, Secondary, 69 (23.5). Row 19: Type of the school, High, 133 (45.2). Row 20: Smoking status, Yes, 70 (23.8). Row 21: Smoking status, No, 224 (76.2). Row 22: BMI (kg/m2), Healthy weight (18.5-24.99), 157 (53.4). Row 23: BMI (kg/m2), Overweight (25.0-29.99), 95 (32.3). Row 24: BMI (kg/m2), Obese (>=30), 42 (14.3). Row 25: Skipping meals during the day, Yes, 82 (27.9). Row 26: Skipping meals during the day, Sometimes, 110 (37.4). Row 27: Skipping meals during the day, No, 102 (34.7). Row 28: Skipped meals, No skipping, 102 (34.7). Row 29: Skipped meals, Breakfast, 55 (18.7). Row 30: Skipped meals, Lunch, 130 (44.2). Row 31: Skipped meals, Dinner, 7 (2.4).
*Income categories reflect the economic conditions at the time of data collection.
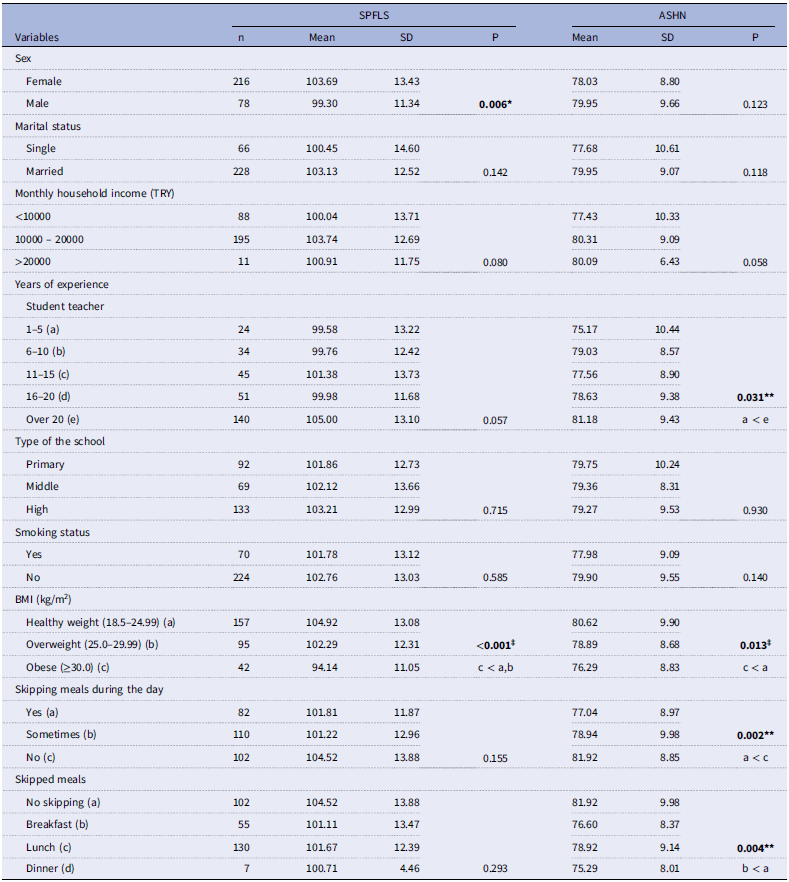
Table 2 presents the sociodemographic factors and eating habits associated with SPFL and attitudes toward healthy nutrition among school teachers. The SPFLS scores were found to be significantly lower among the male respondents (p = 0.006). The ASHN scores of the respondents who had worked as school teachers for over 20 years were significantly higher than those who had worked as school teachers for 1–5 years (p = 0.031). Age-adjusted ANCOVA analyses showed that obese respondents had significantly lower SPFLS scores than both normal-weight and overweight respondents (p < 0.001). In addition obese school teachers had significantly lower ASHN scores than normal-weight school teachers after controlling for age (p = 0.013). There was no statistically significant difference between SPFLS scores and marital status, monthly income, years of experience as a school teacher, smoking status, or tendency to skip meals during the day (p > 0.05). In addition, neither SPFLS nor ASHN scores differed significantly according to monthly income categories (p = 0.080 and p = 0.058, respectively). When the eating habits of the respondents were examined, the ASHN scores were found to be significantly lower in those who skipped meals during the day than those who did not (p = 0.002). The school teachers who skipped breakfast exhibited significantly lower ASHN scores (p = 0.004).
Sociodemographic factors and eating habits associated with self-perceived food literacy and Attitude Scale for Healthy Nutrition of school teachers (n = 294)

Table 2. Long description
The table presents data on sociodemographic factors and eating habits associated with self-perceived food literacy (SPFLS) and Attitude Scale for Healthy Nutrition (ASHN) among school teachers. It includes variables such as sex, marital status, monthly household income, years of experience, type of school, smoking status, BMI, and skipping meals. The table has 12 rows and 10 columns. Column headers are Variables, SPFLS n, SPFLS Mean, SPFLS SD, SPFLS P, ASHN Mean, ASHN SD, ASHN P. Row labels include categories like Female, Male, Single, Married, and various income brackets, years of experience, types of schools, smoking statuses, BMI categories, and meal-skipping habits. Each row provides the number of respondents (n), mean scores, standard deviations (SD), and p-values (P) for both SPFLS and ASHN. Notable trends include significantly lower SPFLS scores among male respondents and higher ASHN scores among teachers with over 20 years of experience. Obese respondents had significantly lower SPFLS and ASHN scores compared to normal-weight and overweight respondents. Teachers who skipped meals, particularly breakfast, had lower ASHN scores.
SPFLS, Self-Perceived Food Literacy Scale; ASHN, Attitude Scale for Healthy Nutrition. Statistically significant values are given in bold and P < 0.05 was considered to show a statistically significant result.
* Student’s t test; **One-way ANOVA (Tukey’s HSD test was performed as post hoc test).
‡ ANCOVA adjusted for age (Bonferroni-adjusted pairwise comparisons).
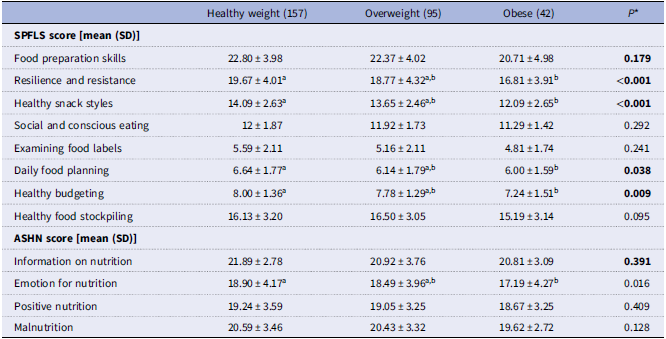
Age-adjusted comparisons of SPFLS and ASHN subscale scores according to BMI classification are presented in Table 3. The mean scores of the respondents in the resilience and resistance and healthy snack style subscales were lower among the obese school teachers than those of the normal-weight school teachers (p < 0.001). The mean score in the daily food planning subscale was lower among the obese respondents than the normal-weight respondents (p = 0.038). Likewise, the mean score in the healthy budgeting subscale was lower among the obese respondents than the normal-weight respondents (p = 0.009). When the subscales of ASHN were evaluated, the mean emotion for nutritionscore was found to be lower in obese respondents compared to normal-weight respondents (p = 0.016). No significant differences according to BMI classification were observed for the food preparation skills, social and conscious eating, examining food labels, and healthy food stockpiling subscales of the SPFLS, or for the information on nutrition, positive nutrition, and malnutrition subscales of the ASHN (p > 0.05).
Subscales of the Self-Perceived Food Literacy Scale (SPFLS) and Attitude Scale for Healthy Nutrition (ASHN) according to BMI classification

Table 3. Long description
A table comparing self-perceived food literacy and healthy nutrition attitudes across BMI classifications. The table has 12 rows and 5 columns. Column headers are Healthy weight (157), Overweight (95), Obese (42), and P*. Row labels include Food preparation skills, Resilience and resistance, Healthy snack styles, Social and conscious eating, Examining food labels, Daily food planning, Healthy budgeting, Healthy food stockpiling, Information on nutrition, Emotion for nutrition, Positive nutrition, and Malnutrition. Each cell contains mean scores and standard deviations for each BMI classification and p-values indicating statistical significance. Notable trends include lower mean scores for obese individuals in resilience and resistance, healthy snack styles, daily food planning, healthy budgeting, and emotion for nutrition compared to healthy weight individuals.
* ANCOVA adjusted for age (Bonferroni-adjusted pairwise comparisons.
Statistically significant values are given in bold. P < 0.05 was considered to show a statistically significant result.
a,bMean values with unlike superscript letters were significantly different (P < 0.05).
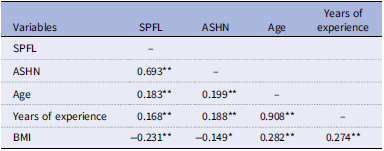
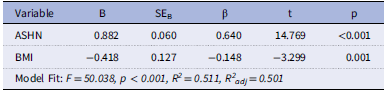
The correlational analyses indicated that SPFL showed positive correlations with ASHN (r = 0.693, p < 0.001), age (r = 0.183, p < 0.001) and years of experience (r = 0.168, p < 0.001), and a negative correlation with BMI (r = −0.231, p < 0.001) (Table 4). ASHN was positively correlated with age (r = 0.199, p < 0.001) and years of experience (r = 0.188, p < 0.001), and negatively correlated with BMI (r = −0.149, p < 0.05). Given that many variables were correlated with SPFL, a multiple linear regression analysis was performed to figure out the predictors of SPFL. Table 5 indicated that higher ASHN (β = 0.640, p < 0.001) and lower BMI (β = −0.148, p = 0.001) predicted higher SPFL after adjusted for sex, age, monthly household income, and years of experience.
Correlation coefficients between self-perceived food literacy (SPFL), attitudes towards healthy nutrition (ASHN), sociodemographic characteristics and BMI

Table 4. Long description
A table with five rows and five columns showing correlation coefficients between self-perceived food literacy (SPFL), attitudes towards healthy nutrition (ASHN), age, years of experience, and BMI. The columns are labeled SPFL, ASHN, Age, Years of experience, and BMI. The rows are labeled with the same variables. The table presents correlation coefficients and significance levels. Row 1: SPFL, dash. Row 2: ASHN, 0.693, dash. Row 3: Age, 0.183, 0.199, dash. Row 4: Years of experience, 0.168, 0.188, 0.908, dash. Row 5: BMI, -0.231, -0.149, 0.282, 0.274.
* p < 0.05; **p < 0.001.
Multiple regression analysis indicating the predictors of self-perceived food literacy

Table 5. Long description
A table showing the results of a multiple linear regression analysis indicating the predictors of self-perceived food literacy. The table has 4 rows and 6 columns. The columns are labeled Variable, B, SE_B, β, t, and p. The rows are labeled ASHN and BMI. The table also includes a Model Fit row with values for F, p, R², and R²_adj. Row 1: ASHN, 0.882, 0.060, 0.640, 14.769, <0.001. Row 2: BMI, -0.418, 0.127, -0.148, -3.299, 0.001. Model Fit: F=50.038, p<0.001, R²=0.511, R²_adj=0.501.
*Adjusted for age, sex, monthly household income and years of experience.
Discussion
The present study investigated the associations among SPFL, attitudes toward healthy nutrition, and BMI in school teachers. SPFL was positively associated with attitudes toward healthy nutrition and negatively associated with BMI. In the regression analysis, attitudes toward healthy nutrition and BMI emerged as independent predictors of SPFL. Compared with normal-weight teachers, obese teachers had lower overall SPFL scores as well as lower scores in several food literacy dimensions, including resilience and resistance, healthy snack styles, daily food planning, and healthy budgeting. Obese teachers also reported less favourable attitudes toward healthy nutrition, particularly in the emotion for nutrition domain.
Studies directly examining the relationship between SPFL and attitudes toward healthy nutrition are limited. However, recent studies conducted in Turkey have reported positive associations between attitudes toward healthy nutrition and both sustainable food literacy(Reference Helvacı, Tayhan and Özbey Yücel39) and e-health diet literacy.(Reference Koca and Çevik40) Although these constructs differ from SPFL and the study populations were not identical, all represent literacy-related concepts associated with food- and nutrition-related knowledge, evaluation, and decision-making processes.(Reference Vidgen and Gallegos10) The findings of the present study are consistent with previous studies reporting positive relationships between attitudes toward healthy nutrition and food literacy-related constructs. The observed association also appears theoretically plausible, as the ASHN assesses dimensions related to nutrition information, emotional responses to nutrition, positive nutrition practices, and malnutrition-related behaviours,(Reference Demir and Cicioğlu38) whereas SPFL encompasses food-related knowledge, skills, and behaviours.(Reference Vidgen and Gallegos10) However, due to the cross-sectional nature of the study, no conclusions can be drawn regarding the causal relationship between these variables.
The present findings are consistent with previous studies reporting inverse associations between food literacy and BMI,(Reference Bazzani, Amato and Faraguna29,Reference Murakami, Shinozaki and Yuan30,Reference Uzdil, Çelebi and Öztürk41) although other studies have reported no significant associations between food literacy and BMI.(Reference Sponselee, Kroeze and Poelman28,Reference Boariu, Scutariu and Reurean Pintilei33) In addition to lower overall SPFL scores, obese teachers scored lower in the resilience and resistance, healthy snack styles, daily food planning, and healthy budgeting dimensions compared with normal-weight teachers.
Resilience is a dynamic process of positive adaptation in the face of risk and adversity.(Reference Stephens, McNaughton and Crawford42) Dietary resilience refers to the utilization of adaptive strategies that enable individuals to maintain an adequate diet despite the dietary challenges.(Reference Vesnaver, Keller and Payette43) Previous studies have suggested that dietary resilience is associated with healthier eating habits,(Reference Lee, Kim and Jung9,Reference Vesnaver, Keller and Payette43) while lower resilience has been lined to higher BMI.(Reference Stewart-Knox, Duffy and Bunting44) Consistent with these findings, obese teachers reported lower resilience and resistance scores in the present study.
The consumption of snack foods high in fat and sugar has been associated with obesity risk,(Reference Bes-Rastrollo, Sanchez-Villegas and Basterra-Gortari45) and unhealthy snacking behaviours have been reported more frequently among overweight and obese individuals.(Reference Cleobury and Tapper46) This may explain the lower healthy snack styles scores observed among obese school teachers. Furthermore, a recent study reported lower resilience and resistance, daily food planning, and healthy budgeting scores among individuals with general obesity,(Reference Murakami, Shinozaki and Livingstone47) consistent with the findings of the present study.
Obese teachers scored lower on the ASHN than normal-weight teachers in the present study. Consistent with this finding, individuals with higher body weight were more likely to report less favourable attitudes toward healthy nutrition and less healthy dietary profiles in an Irish population study.(Reference Hearty, McCarthy and Kearney31) In the present study, the difference was particularly evident in the Emotion for Nutrition dimension of the ASHN. This dimension reflects emotional and hedonic attitudes toward food, including enjoyment of and emotional responses to different food types. Previous research has suggested that emotional and hedonic aspects of eating are associated with food preferences and food-choice behaviours and may influence the consumption of highly palatable foods.(Reference Fuente González, Chávez-Servín and de la Torre-Carbot48) Therefore, differences in Emotion for Nutrition scores across BMI groups may reflect differences in food-related emotional attitudes and perceptions. Furthermore, the ASHN includes items related to regular meal consumption and meal skipping. Accordingly, lower attitude scores among obese teachers may also reflect less favourable meal-related practices, as participants who did not consume regular main meals had lower attitude scores.
Strengths and limitations
The major strengths of this study include its focus on an understudied population of school teachers and its comprehensive evaluation of food literacy, attitudes toward healthy nutrition, and BMI using validated measurement tools. The limitations of this study include the fact that all outcome measures were self-reported and that the AHNS and SPFL levels describe the respondents’ attitudes and perceptions related to eating rather than their objective behaviours. In addition, dietary intake data, such as food consumption frequency and adherence to specific dietary patterns, were not assessed. Therefore, the relationship between food literacy, attitudes toward healthy nutrition, and actual dietary behaviours could not be evaluated. Future studies should assess AHNS and SPFL levels alongside dietary intake measures. Also, the cross-sectional nature of the study can be considered another limitation. Furthermore, the findings cannot be generalized to all school teachers because they were recruited from the schools in three provinces. Information regarding rural or urban residence was not collected; therefore, potential differences according to residential setting could not be examined. In addition, the study was conducted among school teachers, a relatively homogeneous occupational group with generally higher educational attainment than the general population. Therefore, caution should be exercised when generalizing the findings to the broader Turkish adult population.
Implications for practice
The present study demonstrated positive associations between SPFL and attitudes toward healthy nutrition and identified lower food literacy and healthy nutrition attitude scores among obese teachers. Given the important role of school teachers as role models for students’ eating behaviours and food-related practices,(Reference Horne, Greenhalgh and Erjavec49) these findings provide useful information regarding food literacy and nutrition-related attitudes in this population. In addition, teachers play an important role in the implementation and evaluation of school-based nutrition programmes.(Reference Findholt, Izumi and Shannon50,Reference Jones and Zidenberg-Cherr51) Therefore, understanding food literacy and attitudes toward healthy nutrition among teachers may be relevant for the development of future school-based nutrition initiatives. Future studies should further investigate the relationships among food literacy, attitudes toward healthy nutrition, dietary behaviours, and weight status using longitudinal and intervention designs. The findings of the present study may also contribute to the development of future research and educational projects related to food literacy in school settings in Türkiye.
Conclusion
In conclusion, obese teachers had lower SPFL and healthy nutrition attitude scores than normal-weight teachers. SPFL was positively associated with attitudes toward healthy nutrition and negatively associated with BMI. In addition, attitudes toward healthy nutrition and BMI emerged as independent correlates of SPFL. These findings contribute to the limited literature on the relationships among food literacy, attitudes toward healthy nutrition, and BMI among school teachers. Further longitudinal and intervention studies are needed to better understand the nature of these relationships.
Data availability statement
Data will be made available on request.
Acknowledgements
None.
Author contributions
Conceptualization, formal analysis, investigation, methodology, writing original draft was performed by the author.
Financial support
This study is not supported by any funding.
Competing interests
The author(s) have declared no conflict of interest
Informed consent
Informed consent was obtained from all participants before their inclusion. A checkbox at the end of a participant information form was used to digitally record informed consent.
Consent for publication
None.
Use of artificial intelligence tools
ChatGPT was used during the revision process to assist with language editing, grammar correction and readability enhancement. The original manuscript was prepared by the author. All AI-generated content and suggestions were critically reviewed, revised where necessary, and approved by the author, who take full responsibility for the final manuscript.

 Open access

