Introduction
The majority of phytophagous insects are specialists with a narrow host range and a strong taxonomic conservatism in host plant use. The host range depends on the plant chemistry, namely, nutrient compositions, primary and secondary metabolites, as well as plant physical characteristics (e.g. spines, trichomes). These plant attributes are important in the acceptance or rejection of plants as food source because they inform the foraging insect about the suitability of a plant (see Bernays & Chapman (Reference Bernays and Chapman1994) and Schoonhoven et al. (Reference Schoonhoven, van Loon and Dicke2005) for review).
The stem borer Busseola fusca (Fuller) (Lepidoptera: Noctuidae) is considered a major pest of maize (Zea mays L. [Poaceae]) and sorghum (Sorghum bicolor [L.] Moench. [Poaceae]) in sub-Saharan Africa (Kfir et al., Reference Kfir, Overholt, Khan and Polaszek2002).
Like other African cereal stemborers, B. fusca is hypothesized to have co-evolved with indigenous wild graminaceous plants before the domestication of sorghum and the introduction of maize into Africa (Bowden, Reference Bowden1976). However, molecular studies show a drastic divergence in host colonization with a shift from ancestral grasses to cultivated staple cereal crops (maize, sorghum and candle millet) over the previous centuries (Sezonlin et al., Reference Sezonlin, Dupas, Le Rü, Le Gall, Moyal, Calatayud, Giffard, Faure and Silvain2006). Furthermore, recent studies on the host range indicate that B. fusca has oligophagous feeding habits, feeding mostly on maize and sorghum, and on a narrow range of wild graminaceous plant species (Le Ru et al., Reference Le Ru, Ong'amo, Moyal, Muchugu, Ngala, Musyoka, Abdullah, Matama-Kauma, Lada, Pallangyo, Omwega, Schulthess, Calatayud and Silvain2006a,Reference Le Ru, Ong'amo, Moyal, Ngala, Musyoka, Abdullah, Cugala, Defabachew, Haile, Matama-Kauma, Lada, Negassi, Pallangyo, Ravololonandrianina, Sidumo, Omwega, Schulthess, Calatayud and Silvainb; Ong'amo et al., Reference Ong'amo, Le Ru, Dupas, Moyal, Muchugu, Calatayud and Silvain2006; Ndemah et al., Reference Ndemah, Schulthess, Le Ru and Bame2007; Matama-Kauma et al., Reference Matama-Kauma, Schulthess, Le Ru, Mueke, Ogwang and Omwega2008). Young larvae of B. fusca have been commonly recovered from Sorghum arundinaceum (Desv.) Stapf. in Kenya and Uganda, and from Arundo donax L. in Eritrea, Ethiopia and South Africa (Le Ru et al., Reference Le Ru, Ong'amo, Moyal, Muchugu, Ngala, Musyoka, Abdullah, Matama-Kauma, Lada, Pallangyo, Omwega, Schulthess, Calatayud and Silvain2006a,Reference Le Ru, Ong'amo, Moyal, Ngala, Musyoka, Abdullah, Cugala, Defabachew, Haile, Matama-Kauma, Lada, Negassi, Pallangyo, Ravololonandrianina, Sidumo, Omwega, Schulthess, Calatayud and Silvainb). By contrast, only a few individuals were recovered from Pennisetum purpureum Schumach in Cameroon, Kenya and Tanzania and from Setaria megaphylla (Steud.) Th. Dur. & Schinz in Congo (Le Ru et al., Reference Le Ru, Ong'amo, Moyal, Muchugu, Ngala, Musyoka, Abdullah, Matama-Kauma, Lada, Pallangyo, Omwega, Schulthess, Calatayud and Silvain2006a,Reference Le Ru, Ong'amo, Moyal, Ngala, Musyoka, Abdullah, Cugala, Defabachew, Haile, Matama-Kauma, Lada, Negassi, Pallangyo, Ravololonandrianina, Sidumo, Omwega, Schulthess, Calatayud and Silvainb). This can be related to differences in plant chemistry between plant species.
Most herbivorous insects are stimulated to feed by sugars, especially sucrose. However, there is no evidence that host-plant specificity can be explained by sugars, mainly since they are almost ubiquitous in plants, and their relative concentrations vary greatly with plant developmental stage, age, physiological condition and environmental factors (see Schoonhoven et al. (Reference Schoonhoven, van Loon and Dicke2005) for review).
Host choice in phytophagous insects is usually determined by the adults. However, as reported by Berdegué et al. (Reference Berdegué, Reitz and Trumble1998), many species of Lepidoptera have highly mobile larvae that can engage in host plant selection. After hatching under the leaf sheath, B. fusca neonate larvae ascend to the whorl, where they either feed on the leaves or disperse via ‘ballooning-off’ (Kaufmann, Reference Kaufmann1983); dispersal is generally density dependent and might be influenced by host plant quality. After feeding in the leaf whorl, the early third instars larvae descend and bore into the plant stem. Older larvae may also migrate in search of a more suitable host plant (Kaufmann, Reference Kaufmann1983). Generally, lepidopteran larvae display food preferences via a phenomenon driven by chemoreceptors located on the mouthparts (Schoonhoven & van Loon, Reference Schoonhoven and van Loon2002). Like other Lepidoptera species, B. fusca larvae possess sensory structures able to detect plant sugars (Juma et al., Reference Juma, Chimtawi, Ahuya, Njagi, Le Ru, Magoma, Silvain and Calatayud2008). However, the phytochemical basis of host acceptance and suitability is lacking for this species.
In this study, the feeding responses of B. fusca larvae to plant sugars in some of the most common Poaceae species, from which B. fusca larvae have been previously recovered in the field, were determined.
Materials and methods
Insects
Busseola fusca larvae used in the study stemmed from insects reared on a meridic diet according to Onyango & Ochieng’-Odero (Reference Onyango and Ochieng’-Odero1994) at the International Centre of Insect Physiology and Ecology (ICIPE), Nairobi, Kenya. The diet consists of brewer's yeast, sorbic acid, methyl p-hydroxybenzoate, ascorbic acid, vitamin E, maize leaf and bean powder, sucrose (70g per 2l), agar, formaldehyde (40%) and distilled water. To rejuvenate the colonies, larval specimens collected from maize fields in western Kenya were added to the colony three times per year. In all experiments, freshly moulted third instar larvae starved for 24h prior to the test were used. At this developmental stage, the larvae still feeds on young plant leaves and are involved in host plant selection (Kaufmann, Reference Kaufmann1983). Moreover, the insects are large enough for electrophysiological analyses.
Plants
Seven Poaceae species were used in this study, namely maize, Z. mays, wild sorghum, S. arundinaceum, Napier grass, P. purpureum, A. donax, S. megaphylla, from which B. fusca larvae were recovered in the field (Le Ru et al., Reference Le Ru, Ong'amo, Moyal, Muchugu, Ngala, Musyoka, Abdullah, Matama-Kauma, Lada, Pallangyo, Omwega, Schulthess, Calatayud and Silvain2006a,Reference Le Ru, Ong'amo, Moyal, Ngala, Musyoka, Abdullah, Cugala, Defabachew, Haile, Matama-Kauma, Lada, Negassi, Pallangyo, Ravololonandrianina, Sidumo, Omwega, Schulthess, Calatayud and Silvainb) and Panicum maximum Jacq. and Panicum deustum Thunb., the most common grasses in the areas where B. fusca is found in Kenya (B.P. Le Ru, personal observations). Except for maize and A. donax, all grasses are indigenous to sub-Saharan Africa. Maize (cv. 511, growth cycle: 100–150 days) was grown in 4-l pots (one plant per pot) from seeds provided by Simlaw, Kenya Seeds Company, Nairobi, Kenya. The grasses were obtained from natural habitats in Kenya and grown from tufts or stem cuttings in 4-l pots with one tiller per pot. All plants were grown in a greenhouse at ICIPE. The temperature was approximately 31 °C/17 °C (day/night) with a 12:12h (L:D) photoperiod. The plants were watered three times per week and fertilized once with calcium ammonium nitrate (26% N) two weeks after planting. As B. fusca prefers pre-flowering plants for oviposition (Ndemah et al., Reference Ndemah, Schulthess, Poehling and Borgemeister2000; Chabi-Olaye et al., Reference Chabi-Olaye, Nolte, Schulthess and Borgemeister2005), 5-week-old plants were used, except for S. arundinaceum for which 7-week-old plants were chosen.
Survival and growth of larvae on plants
Eight potted plants of each plant species were randomly assigned in the greenhouse, avoiding any contact among the neighbouring plants. Each potted plant was infested with five third instar larvae. The rim of each pot was treated with a thin layer of petroleum jelly to prevent larvae from escaping or moving among the different plants tested. Assessment of the percentage of larvae recovered and their relative growth rates (RGR) on each plant species was evaluated seven and 19 days after infestations. The percentage of larvae recovered per plant was referred to as survival. RGR was calculated by subtracting the initial from the final larval weight, divided by the number of days of infestation (Ojeda-Avila et al., Reference Ojeda-Avila, Woods and Raguso2003).
Extraction of plant leaf materials
For each plant species, young leaves were randomly sampled at around 10am, cut into small discs and immediately freeze-dried. The weight of the leaves prior and after freeze-drying was recorded and the moisture content of each sample evaluated as the difference between fresh and the freeze-dried weights. Dried leaf discs were then ground into a homogeneous powder in a blender and stored at −20 °C in sealed plastic bags prior to being used for bioassays or chemical analyses.
Leaf powder was extracted in methanol to remove polar compounds, including sugars by the following technique. Two grams of dried leaf powder of each plant species were extracted for 24h in a 100ml solution of methanol and water (75, 25% – v/v). After filtration, the residual material was again re-extracted using the same solvent and protocol. Both extracts (i.e. filtrate) were then pooled and termed as methanolic extract. The post extraction residual material was discarded.
For each plant species, the filtered extracts were concentrated at 40 °C under reduced pressure in a rotary evaporator (Büchl, Switzerland) to obtain a solid crude extract. Based on the freeze-dried weights and the percentage of moisture content of the original foliage, solid crude extracts were re-dissolved in a similar volume of their respective solvent system to give a final solution of the concentration equal to 1mg of fresh weight plant material per ml. All extracts were stored at −20 °C until required for bioassays.
Larval Feeding responses using plant extracts
Each plant extract was applied on surrogate stems consisting of cylindrical pieces of Styrofoam™ substrates and tested for feeding activities in bioassays based on the modified method of Ma & Kubo (Reference Ma and Kubo1977). Styrofoam™ carrier cylinders (13mm diameter, 35mm long) were first punched from a 35mm thick Styrofoam™ board using a 1cm diameter cork-borer. For all bioassays, an aliquot of 400μl of each of the plant extracts or the solvent as control were topically applied on the inert Styrofoam™ cylinder. Treated and control bioassay substrates were placed on aluminium foil and air-dried at room temperature. The weight of each dried impregnated Styrofoam™ cylinder was evaluated before being used in the experiments. The bioassay arena consisted of a Petri dish (90mm diameter) lined with moistened filter paper to maintain humidity. Styrofoam™ cylinders containing each of the seven plant methanolic extracts and a control treated with a mixture of methanol and water (75, 25% – v/v) were randomly arranged in the arena and simultaneously presented to a single third instar larva in the arena (8-choice test). The temperature was 25 °C and air humidity 80% RH.
Each bioassay experiment lasted for 36h (the time required for the larvae to make a choice (Juma, Reference Juma2010)). To avoid risk of photoperiodicity, all bioassays tests were performed in the dark. After feeding, the weight of each Styrofoam™ cylinder was recorded and the feeding response index (FRI) (Cai et al., Reference Cai, Konno and Matsuda2002) was calculated as
 $${\rm FRI}(\% ) = [({\rm X}-{\rm Y})/{\rm X}] \times 100$$
where X and Y are the weight of the Styrofoam™ cylinder before and after the assay, respectively.
Analysis of sugars in the plant extracts
A 12-ml aliquot of each of the plant's methanolic extracts was further concentrated in a rotary evaporator at 40 °C to remove excess methanol solvent. The resulting aqueous solution was freeze-dried, and the solid was re-dissolved in distilled water to obtain a solution of approximately 5mg ml−1. A modified method of Gomez et al. (Reference Gomez, Rubio and Augé2002) was used to purify the aqueous crude sugar extracts from other classes of compounds prior to analysis. Briefly, 0.2g of polyvinylpyrolidone (PVP) was added to 12ml of crude extract and thoroughly vortexed. The mixture was then centrifuged for 30min at 15,000rpm at 4 °C. The supernatant was then recovered with a 4-ml syringe and sequentially filtered, first through a C18 cartridge and then through Whatman PTFE membrane filter (0.45μm). The resulting solution was further freeze-dried and subsequently stored at −20 °C prior to sugar analyses.
Fifty milligrams of each of the dried plant extracts were re-dissolved in 1ml of distilled water and the resultant solution filtered on 0.45μm PTFE membrane filters prior to loading an aliquot of 2μl into the HPLC column. All analyses were performed with a Shimadzu auto-sampler chromatograph (Shimadzu Kyoto, Japan) equipped with a quaternary pump and a differential refractive index detector (cell temperature: 30 °C). Separations were achieved on a sugar specific supelcosil-NH2 analytical column (Supelco) (5μm × 250mm × 4.6mm) according to the manufacturer's protocol for the separation of the most common soluble sugars found in plants. Isocratic elution with a mobile phase of acetonitrile and water (75, 25% – v/v) was performed at a flow rate of 1.2ml min−1 35 °C over 25min.
The chromatographic conditions that allow for good separations, and accurate determination of sugars in the extracts were optimised prior to sample analysis according to Boersig & Negm (Reference Boersig and Negm1985) and Gomez et al. (Reference Gomez, Rubio and Augé2002). A total of nine well-separated peaks, each indicating a specific sugar, were hence resolved among the extracts. The identification of the resolved peaks was achieved by comparing peak retention times to those of external authentic sugar standards (Sigma–Aldrich Chemie Gmbh, Steinheim, Germany) obtained following the resolution of mixtures of pure standards. The identities of the resolved compounds were confirmed by co-injection with the pure sugar standards. About 90% of the compounds detected in the extracts by HPLC analysis were identified by both procedures. The quantification of the sugars was assessed based on peak areas in comparison to calibration curves established prior the analysis. All solvents used in the analysis were of HPLC grade (Fisher Scientific, UK).
Feeding responses using sucrose and turanose
Of the sugars identified in the extracts, only sucrose and turanose were used for feeding response experiments; sucrose was the most abundant sugar in all the plant extracts analysed, apart from being a key phagostimulant for a number of insects species (Albert et al., Reference Albert, Cearly, Hanson and Parisella1982; Bartlet et al., Reference Bartlet, Parsons, Williams and Clark1994; Bowdan, Reference Bowdan1995). Turanose, an isomer of sucrose, was most abundant in plants which were least suitable for larval development (table 1 and fig. 1). The effect of sucrose and turanose on the feeding response of third instar larvae was examined using varying concentrations of pure sugar standards (Sigma-Aldrich, Steinheim, Germany; sucrose: a-D-glucopyranosyl ß-D-fructofuranoside (S7903) and turanose: 3-O-α-D-glucopyranosyl-D-fructose (T2754)). The sugar solutions for bioassays were prepared in a mixture of methanol and water (75, 25% – v/v). Sucrose or turanose concentrations used ranged from 0 to 100mM, i.e. corresponding to the range found in the plant species tested (see results). To determine the effects of combining sucrose and turanose on larval feeding, the following combinations of sugar solutions were also tested: 100mM sucrose/0mM turanose, 100mM sucrose/25mM turanose, 100mM sucrose/50mM turanose, 100mM sucrose/75mM turanose, 100mM sucrose/100mM turanose.
Sugar content (μg mg−1 of leaf dry weight) of leaves of different host plant species, from the more suitable (A) to the less suitable (G) plant to B. fusca larval development according to the results of table 1 (A, Z. mays; B, S. arundinaceum; C, P. maximum; D, P. purpureum; E, A. donax; F, P. deustum; G, S. megaphylla). Bars represent means ±SE (n = 5). Results of ANOVA within each sugar: NS, non significant or P > 0.05 and S, significant or P ≤ 0.05. Means within a sugar followed by the same small letter(s) are not significantly different at P ≤ 0.05 (Fisher's PLSD test following ANOVA).

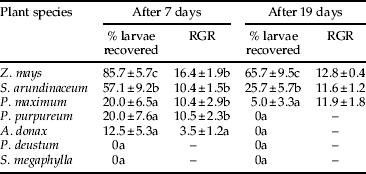
Percentages of third instar B. fusca larvae recovered (mean1 ± SE, n 2 = 8) and relative growth rates (RGR) (mg d−1, mean ± SE) on different Poaceae species, seven and 19 days after infestation.
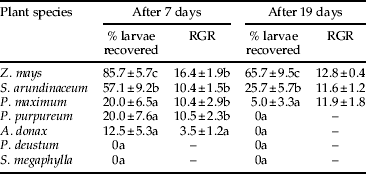
1 within a column followed by the same letter(s) are not significantly different at P ≤ 0.05 (Student-Newman-Keuls test following ANOVA).
2 except for Z. mays and S. arundinaceum, n = 7.
For all bioassays, an aliquot of 400μl of each of the aforementioned solutions or the control solvent were topically applied on the inert Styrofoam™ cylinder. Treated and control bioassay substrates were then placed on aluminium foil and air-dried at room temperature. The weight of each dried, impregnated Styrofoam™ cylinder was estimated before being used in the experiments. Both single-choice and multiple-choice tests were done.
For single-choice tests, Styrofoam™ cylinders containing each of the aforementioned sugar solutions (i.e. either sucrose at 25, 50, 75 or 100mM; or turanose at 25, 50, 75 or 100mM; or 100mM sucrose/0mM turanose, 100mM sucrose/25mM turanose, 100mM sucrose/50mM turanose, 100mM sucrose/75mM turanose or 100mM sucrose/100mM turanose) and a control treated with a mixture of methanol and water (75, 25% – v/v) were individually presented in the arena to a single larva.
For multiple-choice tests, Styrofoam™ cylinders containing each a solution of sucrose at 25, 50, 75 or 100mM and a control treated with a mixture of methanol and water (75, 25% – v/v) were randomly arranged in the bioassay arena and simultaneously presented to a single larva (5-choice test). A separate 5-choice test was done using turanose instead of sucrose. In another separate experiment, Styrofoam™ cylinders containing each a solution of 100mM sucrose/0mM turanose, 100mM sucrose/25mM turanose, 100mM sucrose/50mM turanose, 100mM sucrose/75mM turanose or 100mM sucrose/100mM turanose and a control treated with a mixture of methanol and water (75, 25% – v/v) were randomly arranged in the bioassay arena and simultaneously presented to a single larva (6-choice test). One third instar larva was introduced into each bioassay arena. The temperature was 25 °C and air humidity 80%.
Electrophysiological analysis after stimulation by sucrose or turanose
Each larva was restrained with Parafilm (Pechiney Plastic Packaging, Chicago, USA) over a strip of plastic with only its head protruding. The electrophysiological recordings were made on the medial and lateral styloconic sensilla of the galea. A silver electrode (0.38mm in diameter) was inserted into the larval body up to the head and connected to the electrical ground. Recordings were performed visually using a Wild Leitz M10 microscope. Thereby, the tip of individual sensillum was covered with a glass pipette electrode (tip diameter 0.8–1.0μm), which was filled with the stimulus solution just before recording.
Electrical signals were recorded with an amplifier (TastePROBE DLP-02; Syntech, Hilversum, The Netherlands; Marion-Poll & van der Pers (Reference Marion-Poll and van der Pers1996)) and further amplified and then filtered (CyberAmp 320, Axon Instruments, Foster City, CA, USA; ×1000, 10–2800Hz Bessel band-pass filter). These data were stored on a computer using a data acquisition card (16-bit A/D, DT9803; Data Translation, Marlboro, MA, USA) under the control of a custom program, dbWAVE (Marion-Poll, Reference Marion-Poll1996).
The stimulus concentrations were prepared in KCl 10−3M. Each sensillum was stimulated first with sucrose (10−4M) to check its responsiveness. Larvae that did not respond were discarded. Each responsive sensillum was stimulated with the test stimuli, presented one after the other in increasing sugar concentrations (10−4M–10−1M). Each stimulus presentation lasted two seconds and was 2min apart from the previous one to prevent adaptation. Eight to ten minutes after each trial series with a given molecule, each sensillum was washed with 10−3MKCl in order to remove stimulus residues from the previous series. A single stimulation was performed for each solution on each sensillum, and seven larvae were tested for each sugar concentration tested.
The action potentials were detected and sorted into amplitude classes using dbWAVE followed by the subsequent transfer of values to a spreadsheet (Microsoft Excel). The results were presented as the number of action potentials per second.
Statistical analysis
Data on the percentage of larval recovery per plant were arcsin transformed. RGR and sugar contents were log transformed. Untransformed results are presented in the tables. All means were separated by Fisher's PLSD for samples with the same number of replicates and by Student-Newman-Keuls test for different number of replicates following one-way analysis of variance (ANOVA). The correlations between sugar concentration and FRIs were determined both by Spearman rank test and the Spearman rank correlation coefficient. Means for data on feeding preferences under multiple-choice conditions were separated using Wilcoxon signed ranks test.
Electrophysiological results were analyzed by Student's t-test (Microsoft Excel) using the Bonferroni correction with the adjusted significance level b = 0.05×n −1, where n is the number of comparisons made within the same group (b = 0.05 × 3−1 = 0.01).
Statistical tests were performed with StatView software (Abacus Concept, version 5.0, Cary, NC, USA).
Results
Survival and growth of larvae on plants
Larval survival and growth varied significantly among plant species studied (table 1). Survival was highest on maize and wild sorghum (ANOVA: F6,47 = 26.8, P < 0.0001 and F6,47 = 18.9, P < 0.0001 after seven and 19 days of infestations, respectively). Seven days after infestation, RGR was lowest on A. donax and similar on the other plant species (ANOVA: F4,24 = 5.9, P = 0.0019). Nineteen days after infestation, larvae were obtained only from Z. mays, S. arundinaceum and P. maximum; RGR did not vary among the three plant species (ANOVA: F2,12 = 0.7, P = 0.5285). However, no larvae developed on P. deustum and S. megaphylla.
Larval feeding responses on plant extracts
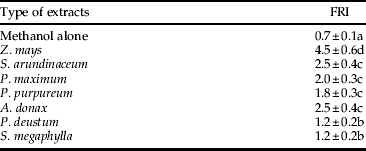
FRI was significantly higher on Styrofoam™ cylinders treated with plant extracts than on those treated with the methanol alone (i.e. the control) (table 2). It was highest with maize extracts and lowest with extracts of P. deustum and S. megaphylla.
Feeding response index (FRI) (%, mean1 ± SE, n = 87) of third instar larvae of B. fusca after 36h of feeding on methanolic extracts of different plant species topically applied on cylindrical Styrofoam™ cylinders under 8-choice conditions.
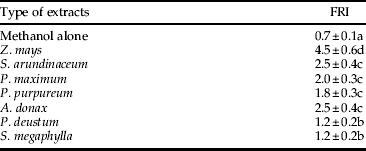
1 followed by the same letter(s) are not significantly different at P ≤ 0.05 (Wilcoxon signed ranks test).
Sugars analysis in plant extracts
Nine sugars were identified in the methanolic plant extracts following a HPLC analysis (fig. 1). With the exception of turanose and maltose, none of the sugars varied significantly in concentrations among the plants species studied. Sucrose was generally the most abundant sugar followed by glucose and fructose. The concentrations of other sugars, i.e. xylose, galactose, lactose and melibiose, were very low, and their relative concentrations in the samples decreased in the same order. Concentration of turanose, an isomer of sucrose, was significantly lowest with Z. mays and S. arundinaceum, and highest in the extracts of P. deustum and S. megaphylla. Maltose concentrations was, however, significantly higher in A. donax than in other plants considered in this study. Therefore, only sucrose and turanose were used in the subsequent bioassays.
Feeding responses using sucrose and turanose
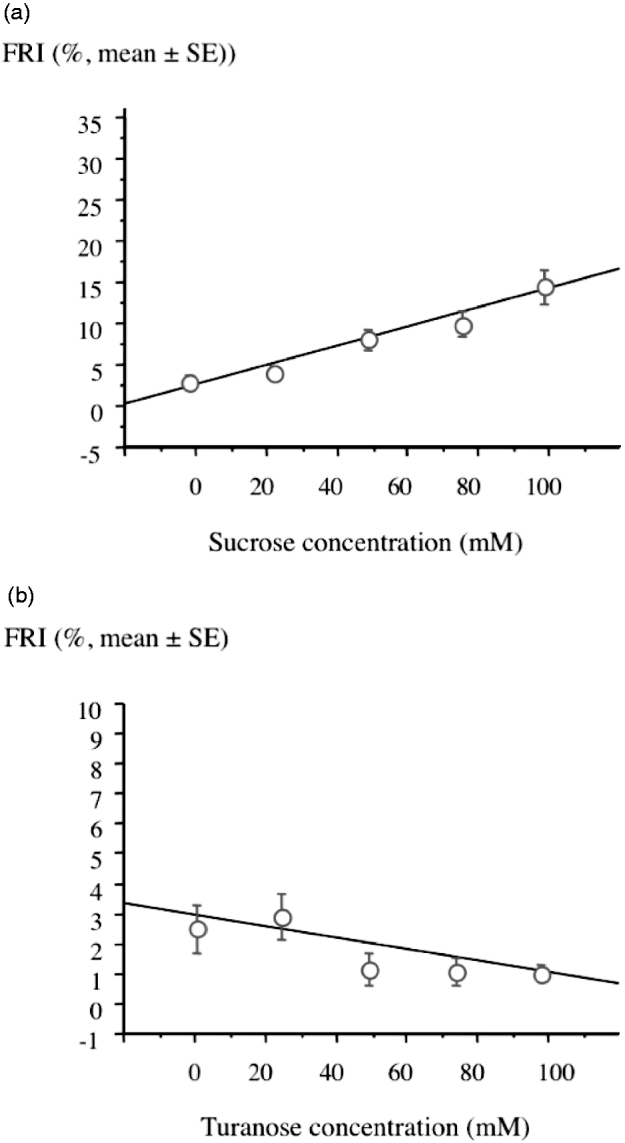
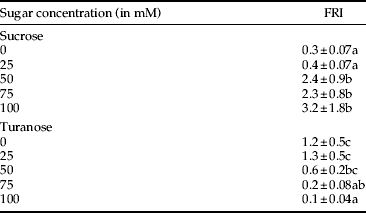
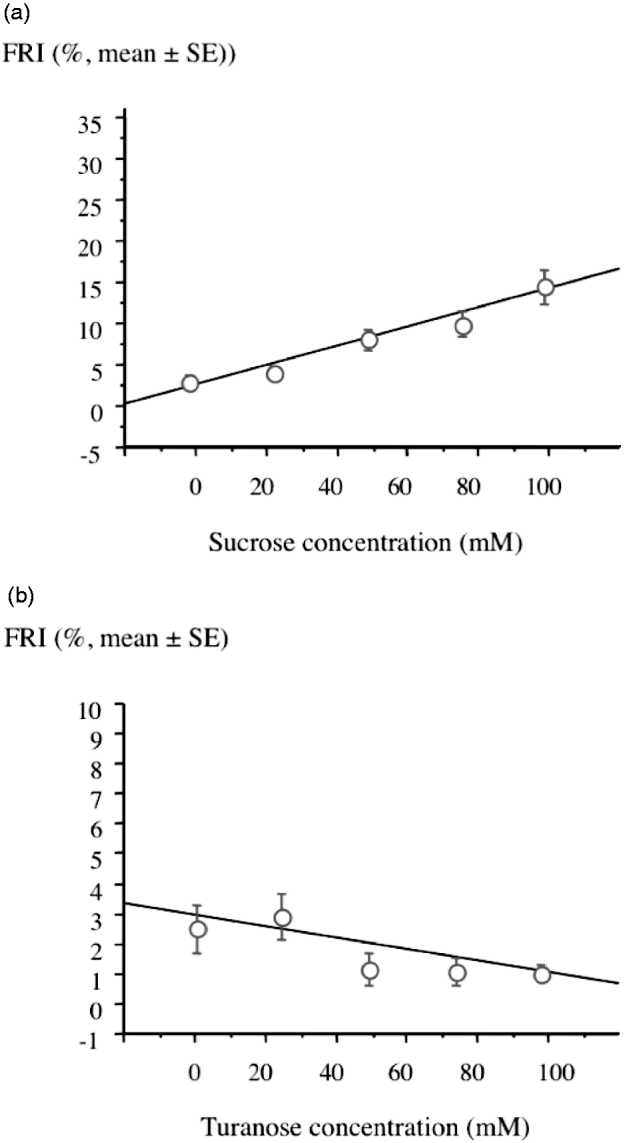
Under single-choice conditions, a positive relationship was found between sucrose and FRI (fig. 2a; Spearman rank test, r s = 0.64; P < 0.0001). Similarly, in the 5-choice bioassay, FRI tended to increase with sucrose concentrations (table 3).
Regression curves on the feeding response index (FRI) (n = 15) of third instar larvae of Busseola fusca after 36h of feeding on cylindrical Styrofoam™ carrier substrates with increasing concentrations of (a) sucrose or (b) turanose under no-choice conditions.
Feeding response index (FRI) (%, mean1 ± SE, n = 15) of third instar larvae of Busseola fusca after 36h of feeding on cylindrical Styrofoam™ carrier substrates with increasing concentrations of sucrose or turanose alone under 5-choice conditions.
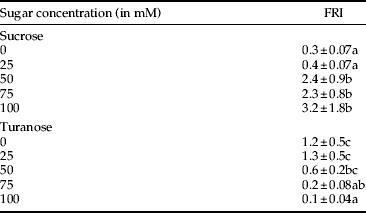
1 within each sugar bioassayed followed by the same letter(s) are not significantly different at P ≤ 0.05 (Wilcoxon signed ranks test).
By contrast, a negative relationship coexisted between turanose and FRI in the single-choice bioassay studies (fig. 2b; Spearman rank test, r s = − 0.17; P = 0.0324). A similar trend was also observed in the 5-choice bioassay (table 3).
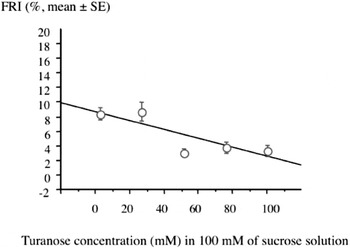
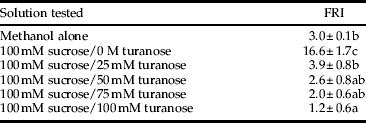
By using a mixture of solutions of constant concentration of sucrose but increasing concentrations of turanose, a negative correlation was established between turanose concentration and the feeding response in single-choice bioassays (fig. 3; Spearman rank test, r s = − 0.47; P < 0.0001). Similarly, in the 6-choice bioassay, the highest FRI was obtained in treatments free of turanose, while most turanose treatments did not vary from the control (table 4).
Regression curve of the feeding response index (FRI) (n = 24) of third instar larvae of Busseola fusca after 36h of feeding on cylindrical Styrofoam™ carrier substrates with a constant concentration of sucrose and increasing concentrations of turanose under no-choice conditions.

Feeding response index (FRI) (%, mean1 ± SE, n = 24) of third instar larvae of Busseola fusca after 36h of feeding on solution of a mixture with a constant concentration of sucrose and increasing concentrations of turanose topically applied on cylindrical Styrofoam™ carrier substrates under 6-choice conditions.
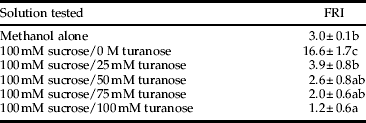
1 within a column followed by the same letter(s) are not significantly different at P ≤ 0.05 (Wilcoxon signed ranks test).
Electrophysiological analysis
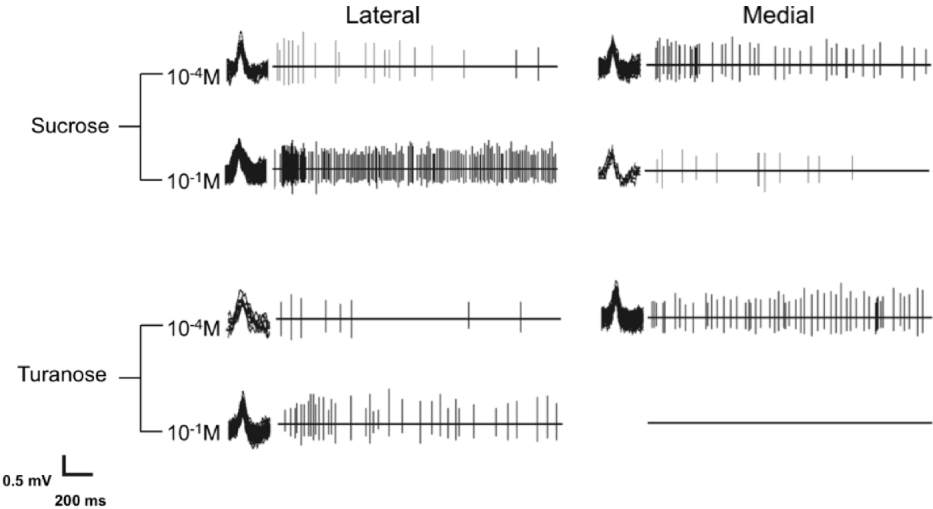
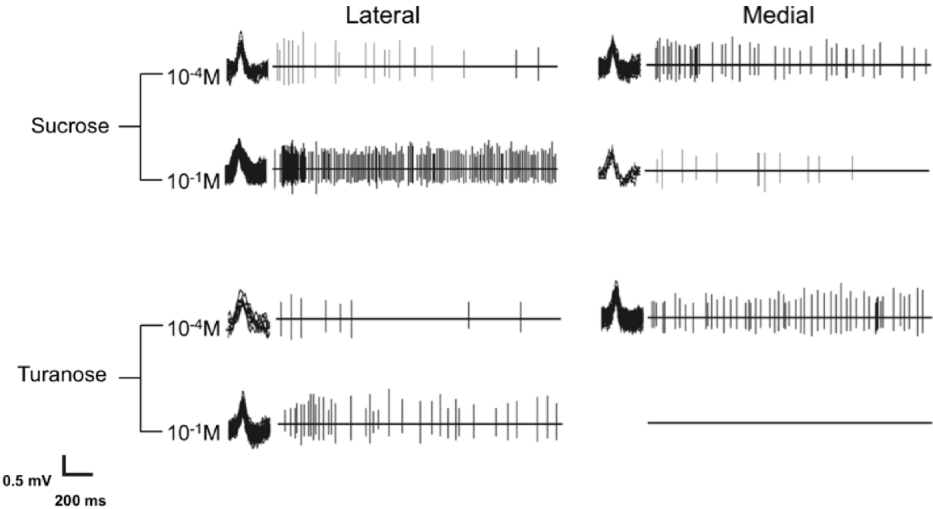
Stimulation of both lateral and medial styloconic sensilla of B. fusca larvae by sucrose or turanose solutions resulted in action potentials or spikes (fig. 4). The dose-response curves indicated that, when the sucrose concentration increased, the sensitivity of lateral styloconic sensilla increased, reaching a plateau at 10−2M, whereas the sensitivity of the medial styloconic sensilla decreased to zero at 10−2M (fig. 5). Similarly, the sensitivity of lateral styloconic sensilla increased with increasing turanose concentrations, while the sensitivity of the medial styloconic sensilla decreased.
Samples of extracellular recordings showing responses of B. fusca larvae from lateral and medial styloconica sensilla stimulated by sucrose or turanose alone (10−4M and 10−1M).
Electrophysiological responses to sucrose and turanose (10−4M–10−1M) in the lateral and the medial styloconic sensilla of B. fusca larvae. Each data point represents the mean (±SE) of spikes number during 1s (n = 7 Larvae, one stimulation per larva). Different letters capping the bars within each compound indicate significant differences among means (t-test with Bonferroni correction: a–b, P < 0.01; a–c, P < 0.001) ( , lateral;
 , medial).

The lateral styloconic sensilla were more sensitive to sucrose than the medial styloconic sensilla, as was expressed by the higher number of spikes generated following 10−4 and 10−1M sucrose stimulation. The medial styloconic sensilla were more sensitive to turanose than the lateral styloconic sensilla, as shown by the higher number of spikes generated by a 10−4 to 10−2M turanose stimulation.
Discussion
In insects, host-plant specialization is the rule rather than the exception (see Schoonhoven et al. (Reference Schoonhoven, van Loon and Dicke2005) for review). Many clades of herbivorous insects are remarkably conservative in the plants that they feed on, and in many groups related insect taxa tend to feed on related plant taxa. Taxon-specific secondary metabolites act as feeding stimulants, explaining the monophagous or oligophagous characteristics of some insect species and thus their host-plant specificity. From the information available in the literature, the specificity of B. fusca towards maize and Sorghum spp. cannot be explained by host plant secondary metabolites. Maize is known to contain DIMBOA, a hydroxamic acid with a powerful antibiosis effect to insects, whereas Sorghum spp. possesses dhurrin, a cyanogenic glucoside, which is toxic to insects (Schoonhoven et al., Reference Schoonhoven, van Loon and Dicke2005). The present findings suggest that some plant primary metabolites such as sugars contribute significantly to host selection and acceptance of B. fusca larvae, although involvement of other metabolites cannot be ruled out.
The highest number of larvae recovered from maize might be due to the higher suitability of the plant to larval feeding (i.e. few larva tried to escape). Similarly, higher RGR could be attributed to superior quality of the plant as a food source. This can also be attributed to the fact that the larvae were more stimulated to feed on maize than on the other plant species. This aspect is corroborated by higher FRI values when compared with other plants studied (table 2). Moreover, choice tests results using methanolic plant extracts suggests that the discriminatory behaviour of B. fusca larvae towards different plant species was influenced, partly by the quantitative and qualitative sugar characteristics of the plants. Most of the sugars identified have been implicated in stimulating feeding in larvae of other lepidopteran species (Albert et al., Reference Albert, Cearly, Hanson and Parisella1982; Bartlet et al., Reference Bartlet, Parsons, Williams and Clark1994; Lopez & Lingren, Reference Lopez and Lingren1994; Bowdan, Reference Bowdan1995). However, information about the role of turanose, the only sugar correlated with the suitability of the plant to B. fusca larvae, is still scanty in the literature. However, this sugar has been shown to have a strong phagostimulatory effect on invasive red fire ant, Solenopsis invicta Buren (Hymenoptera: Formicidae) (van der Meer et al., Reference van der Meer, Lofgren and Seawright1995), and a similar, but a weak, effect on the corn earworm, Helicoverpa zea (Boddie) (Lepidoptera: Noctuidae) (Lopez & Lingren, Reference Lopez and Lingren1994). Among the sugars analysed, turanose showed a good negative correlation with the plant suitability (highest levels of turanose were found in less suitable plants, while lowest levels in more suitable plants), indicating the phagodeterrency effect of this sugar on B. fusca larvae. Therefore, the balance between sucrose and turanose, which varies among the plant species as shown in this study, rather than the concentration of individual sugars may partly condition the feeding preference, and thus the development, of B. fusca larvae on plants.
The electrophysiological analyses indicated that B. fusca larvae have sensorial structures on their mouthparts that are able to detect both sucrose and turanose sugars in solution. The lateral and medial styloconic sensilla responded differently and varied according to the type of sugar solution used for their stimulation. Such differences may lie in small but subtle structural differences in the two sugars and are likely to give rise to variations in molecular fit in the larval taste receptors, thereby inducing different electrophysiological stimulations. This aspect fits with the opposite effects of these two sugars in the feeding bioassays. However, the electrophysiological analyses do not allow us to conclude that turanose is phagodeterrent to B. fusca larval feeding, but only indicates that there were more profound responses to sucrose than turanose stimulation.
In conclusion, our study indicates that sucrose is a feeding stimulant to B. fusca larvae, and its relative concentration influences larval food choice. Similarly, the balance between sucrose and turanose concentrations in food contributes to the overall choice of host plant by B. fusca larvae. This may partly explain the oligophagy of B. fusca larvae, although other factors, such as plant silification (Juma, Reference Juma2010), cannot be ruled out in host selection by B. fusca larvae. For example, increased maize silification has been shown to affect the bionomics of the stem borer, Sesamia calamistis Hampson (Lepidoptera: Noctuidae) (Sétamou et al., Reference Sétamou, Schulthess, Bosque-Pérez and Thomas-Odjo1993).
Haile & Hofsvang (Reference Haile and Hofsvang2002) showed that B. fusca prefers to oviposit on wild sorghum and maize and that the larval density on these two plants was higher than on Setaria sphacelata (Schumach) Moss. This study fits well with the theory of positive correlation between adult host preference and offspring performance (Thompson & Pellmyr, Reference Thompson and Pellmyr1991; Scheirs & De Bruyn, Reference Scheirs and De Bruyn2002). It, hence, would be interesting to study the presence of turanose on a number of host plants and ascertain whether B. fusca gravid females would avoid to oviposit on turanose-rich plants.
Currently, we are not aware of any previous studies that show the influence of sugar isomers, in higher plants, on acceptance by a caterpillar pest. The current findings, therefore, may partly explain host plant choice and suitability of this pest and, hence, pave the way for explaining differences in B. fusca distribution among wild and cultivated habitats.
Acknowledgements
The authors are grateful to Peter Ahuya for his technical assistance, Peter Malusi and the staff of ICIPE's mass rearing unit for stemborer colony rearing. Thanks are given to ICRAF Soil Laboratory staff for HPLC analysis of the sample extracts. Thanks are also given to Fritz Schulthess for his critical reading of the manuscript and English corrections. This work was funded by IRD (France) and the French Ministry of Foreign Affairs for which the authors are very grateful.