Introduction
Medium- to small-sized petrels represent a large proportion of the world’s pelagic seabirds, both in terms of number of individuals and of species (Brooke Reference Brooke2004). Yet, little is known about their population trends, with implications for management and conservation. These petrels are represented by three families (Procellariidae, Hydrobatidae, and Oceanitidae) and there are 124 recognised extant species, following the taxonomy used by BirdLife International (BirdLife International 2024). From these, 65 species (52%) are considered “Near Threatened” or threatened (i.e. “Vulnerable”, “Endangered” or “Critically Endangered”), but only 20 of these classifications are based on negative population trends (Red List Criterion A), the others being classified as threatened based on other criteria such as small populations sizes or very restricted geographical ranges (BirdLife International 2024). The vast majority of these species nest underground in remote and difficult-to-access islands. In contrast, corresponding values for albatrosses (Diomedeidae), which nest exposed at the surface, are substantially different. Amongst the 22 species of albatrosses, 21 (95%) are Near Threatened or threatened, and for 13 of these the criteria for such classification involves negative population trends (BirdLife International 2024). So, while 59% of the albatross species are known or suspected to have suffered declines that affect their conservation status, the same applies to only 16% of the non-albatross petrel species. While it is possible that such large differences reflect the reality, it seems more likely, given all the threats to which smaller petrels are subjected (Dias et al. Reference Dias, Martin, Pearmain, Burfield, Small and Phillips2019), that the deficit of population trends data is severely affecting the assessment of conservation status of these birds (Rodríguez et al. Reference Rodríguez, Arcos, Bretagnolle, Dias, Holmes and Louzao2019). It is clear, from this, that more population monitoring of underground nesting petrels should be regarded as a priority to better guide conservation actions for this group of seabirds.
Most non-albatross petrels are difficult to survey, compared with surface nesting seabirds. Furthermore, many nest in largely inaccessible areas, which makes monitoring even more difficult. However, for several species there are relatively accessible colonies, and still their population trends are poorly known. Part of the reason is that monitoring is often attempted through repeated (extremely laborious) large-scale surveys which primarily aim at estimating population size (Bird et al. Reference Bird, Woodworth, Fuller and Shaw2021). However, even the most sophisticated design-based and model-based population estimates of burrowing petrels sustained by large sampling efforts generally produce population estimates with very broad confidence intervals (CIs) (particularly due to large between-sample variances), precluding the detection of slow, moderate or even rapid population changes (Bird et al. Reference Bird, Woodworth, Fuller and Shaw2021, Reference Bird, Terauds, Fuller, Pascoe, Travers and McInnes2022). Still, virtually all the examples we can find in the bibliography of documented population trends in underground nesting petrels result from comparisons of whole-island population estimates (based on burrow/nest counts and occupancy rates) which, when involving changes in numbers that are important enough (either because the censuses cover a long period or the population is changing at a fast rate) allow relatively robust estimates of population growth (e.g. Clark et al. Reference Clark, Matthiopoulos, Bonnet-Lebrun, Campioni, Catry and Marengo2019; Ryan et al. Reference Ryan, Dilley and Ronconi2019). Other methods already in use or suggested to monitor population change in petrels include capture-mark-recapture methods (Insley et al. Reference Insley, Hounsome, Mayhew and Elliott2014), number of birds attracted to lights (Rodríguez et al. Reference Rodríguez, Suárez-Pérez, Méndez, Acosta and Rodríguez2023), indexes based on acoustic monitoring (Oppel et al. Reference Oppel, Hervías, Oliveira, Pipa, Silva and Geraldes2014) or based on automatic ground cameras and radar (Orben et al. Reference Orben, Fleishman, Borker, Bridgeland, Gladics and Porquez2019), and surveys by thermal cameras on drones (Virtue et al. Reference Virtue, Turner, Williams, Zeliadt, Walshaw and Lucieer2023). Cory’s Shearwater Calonectris borealis is one of those species of petrel that nests underground. During breeding, Cory’s Shearwater is restricted to the north-east subtropical or warm temperate Atlantic Ocean, where it is one of the most abundant and conspicuous seabirds (Meirinho et al. Reference Meirinho, Barros, Oliveira, Catry, Lecoq and Paiva2014). A close relative (until recently treated as conspecific), Scopoli’s Shearwater Calonectris diomedea, nests in the Mediterranean, and the Cape Verde Shearwater Calonectris edwardsii breeds in the Cape Verde archipelago. Calonectris shearwaters have been reported to be frequently bycaught in fisheries (Báez et al. Reference Báez, García-Barcelona, Mendonza, Urbina, Real and Macias2014; Branco et al. Reference Branco, Fracasso, Pérez and Rodrigues-Filho2014; Cooper et al. Reference Cooper, Baccetti, Belda, Borg, Oro and Papaconstantinou2003), sometimes even being directly persecuted by fishers who see them as an annoyance (Gianuca et al. Reference Gianuca, Bugoni, Jiménez, Daudt, Miller and Canani2020), to suffer accidents and mortality related to attraction to light (Rodríguez et al. Reference Rodríguez, Holmes, Ryan, Wilson, Faulquier and Murillo2017), and to fall prey to introduced predators and be the victims of harvesting for food (Fontaine et al. Reference Fontaine, Gimenez and Bried2011; Lopez-Darias et al. Reference Lopez-Darias, Luzardo, Martínez, González, García and Cabrera2011). Despite this and the fact that Cory’s Shearwater stands out as the most studied of the non-albatross petrels globally (Rodríguez et al. Reference Rodríguez, Arcos, Bretagnolle, Dias, Holmes and Louzao2019), little is known on their current population trends and hence it is difficult to evaluate the species’ conservation status. Whole island counts have reported increases on Selvagem Grande and Berlengas islands (Portugal) over the late twentieth/early twenty-first century (Granadeiro et al. Reference Granadeiro, Dias, Rebelo, Santos and Catry2006; Lecoq et al. Reference Lecoq, Catry and Granadeiro2010). However, such whole island counts are subject to errors and uncertainty levels which are hard to quantify, resulting, for example, from the difficulty of access to certain sectors and from the lack of assessment of repeatability of counts.
As suggested by Bird et al. (Reference Bird, Woodworth, Fuller and Shaw2021, Reference Bird, Terauds, Fuller, Pascoe, Travers and McInnes2022; see also Buxton et al. Reference Buxton, Gormley, Jones and Lyver2016), to assess population trends of burrowing seabirds it may be better to focus on constant-effort monitoring approaches, instead of producing intermittent whole-island population estimates. Here, we report on the design and results of an established monitoring scheme for Cory’s Shearwaters, that has been carried out for 14 years, to allow for rapid detection of modest population changes at the large nesting colony of Selvagem Grande. We also carried out power analyses and simulations to assess whether slightly different sampling regimes would still potentially result in relevant population trend information.
Methods
Selvagem Grande (30°09’N, 15°52’W) harbours the largest known Cory’s Shearwater colony, with an estimated 29,540 nesting pairs in 2005 (Granadeiro et al. Reference Granadeiro, Dias, Rebelo, Santos and Catry2006). The island is located c.300 km south of Madeira Island and 160 km north of the Canary Islands. It covers a total area of 245 ha and consists of a central plateau (with 161.5 ha, approximately 100 m above sea level), surrounded by cliffs, some inaccessible, but others not so steep as to preclude survey work. Cory’s Shearwaters nest in numerous small open caves, amongst boulders, under bushes, in holes within old stone walls, and in burrows on the ground.
Based on our previous knowledge of the island (Granadeiro et al. Reference Granadeiro, Dias, Rebelo, Santos and Catry2006), we set 60 plots across its surface (Figure 1). The central place of each plot was marked on the ground by a dot accompanied by the number of the plot painted on rock (Figure 2). GPS coordinates of each plot’s centre point were used to arrive at each plot site. Where the ground was level and easily surveyed, plots had a 10-m radius around this central mark, whereas on sloping ground or in places with lots of boulders or dense vegetation making surveying more difficult, this radius was set as 5 m (77% of the plots).
Location of the fixed monitoring plots on Selvagem Grande. The areas with few or no plots in the centre or the north-western part of the island correspond to largely inaccessible areas (steep cliffs or colonies of White-faced Storm Petrels Pelagodroma marina where the danger of trampling nests is very high) or to areas with virtually no suitable nesting habitat (open plateau with little or no soil or boulders and scant bushy vegetation).

Preparations for counting plot 29 on Selvagem Grande. Note the cross marking the centre of the plot.

Plots were not chosen randomly for purely practical reasons: (1) the centre of plots was painted on stable rocks (for durability) and those had to be chosen; (2) many randomly chosen plots would have fallen in inaccessible areas or in areas with no shearwater nests; (3) a stratified design within which to randomly place plots would require a previous habitat mapping which was unavailable to us (see Discussion for a more detailed discussion of this and its implications). Plots were chosen based on a good empirical (but informal) knowledge of the terrain with the following aims: (1) to sample all the main habitats in approximate proportion to their numerical importance for nesting shearwaters; (2) to sample a sufficient number of plots per habitat; (3) to distribute plots over the entire (accessible) study area with suitable shearwater habitat; (4) to ensure accurate and long-lasting marking in the field so that the exact same plot is surveyed each year. Plots were on cliff areas (34) and the plateau (26) and covered four main types of habitat: (1) boulder fields (“boulders”; 20 plots); (2) rocky/cliff areas with small caves (“caves”, 26 plots); (3) flat open areas with rocky soil and/or with deep earth and sparse vegetation (“open ground”, nine plots); (4) areas covered by shrubs (shrubby seablite Suaeda vera and salado Schizogyne sericea; “shrubs”, five plots).
Plots were set during the nesting season of 2008 and surveyed for the first time in 2009 and yearly afterwards, with a gap in 2020 due to the COVID-19 pandemic. Since 2023, these surveys are formally part of the long-term monitoring scheme of the Selvagens Islands Nature Reserve (Oliveira et al. Reference Oliveira, Menezes, Santos, Ribeiro and Nogales2023). Surveys were generally carried out on 15–16 June (extreme dates 13–16 June), just after the completion of laying, on two consecutive days. During the survey, one observer held one end of the measuring tape at the centre of the plot, while 1–2 others described a circle at the predetermined radius and counted all the eggs falling within the plot. On Selvagem Grande no nests are so deep as to preclude the inspection of the contents or to make their detection difficult. Intact eggs being incubated or recently abandoned were counted, as well as shells of recently broken eggs in failed nests. Cory’s Shearwater females lay one single egg per nesting season with no relaying. Abandoned eggs are easily identified, as no other species on Selvagem lays similarly sized white eggs.
Data analysis
Our data included repeated annual counts of the same plots with almost no missing values (except for 2020) and therefore we estimated annual growth rates using a generalised linear mixed model (GLMM), with a Poisson error distribution. The model included year as a covariate and the plot ID as a random factor. Annual growth rates were estimated as the exponential of the model slopes, expressed as percentages. To test whether growth rate varied among habitats, we built a second model in which we included an interaction between the year and the type of habitat. We further added to this model the number of nests with an egg counted in each plot in 2009 (the starting year) as a covariate to check whether the growth would depend on the starting number of eggs in each plot. GLMMs were fitted with lme4 (Bates et al. Reference Bates, Maechler, Bolker and Walker2015) and lmerTest (Kuznetsova et al. Reference Kuznetsova, Brockhoff and Christensen2017) packages and marginal effects of covariates were estimated with the package marginaleffects (Arel-Bundock Reference Arel-Bundock2023), running in R software 4.1.2 (R Core Team 2021). R-squared values for mixed models were calculated using rsq (Zhang Reference Zhang2023).
We also tested the statistical power of our sampling design, particularly to detect its ability to find significant values of slope, since this parameter is indicative of the direction and magnitude of the (positive or negative) population growth rates. We simulated three different scenarios: (1) reduced number of plots; (2) reduced frequency of surveys (once every two and every three years, rather than annually); (3) reduced effect size (i.e. values indicating positive or negative population growth). To undertake these tests, we used 250 Monte Carlo simulations as implemented in SIMR R package and assumed 80% as an adequate power (Green and MacLeod Reference Green and MacLeod2016). This package can directly handle GLMMs produced with the lme4 package, therefore accommodating multiple fixed covariates and their interactions as well as random effects.
Results
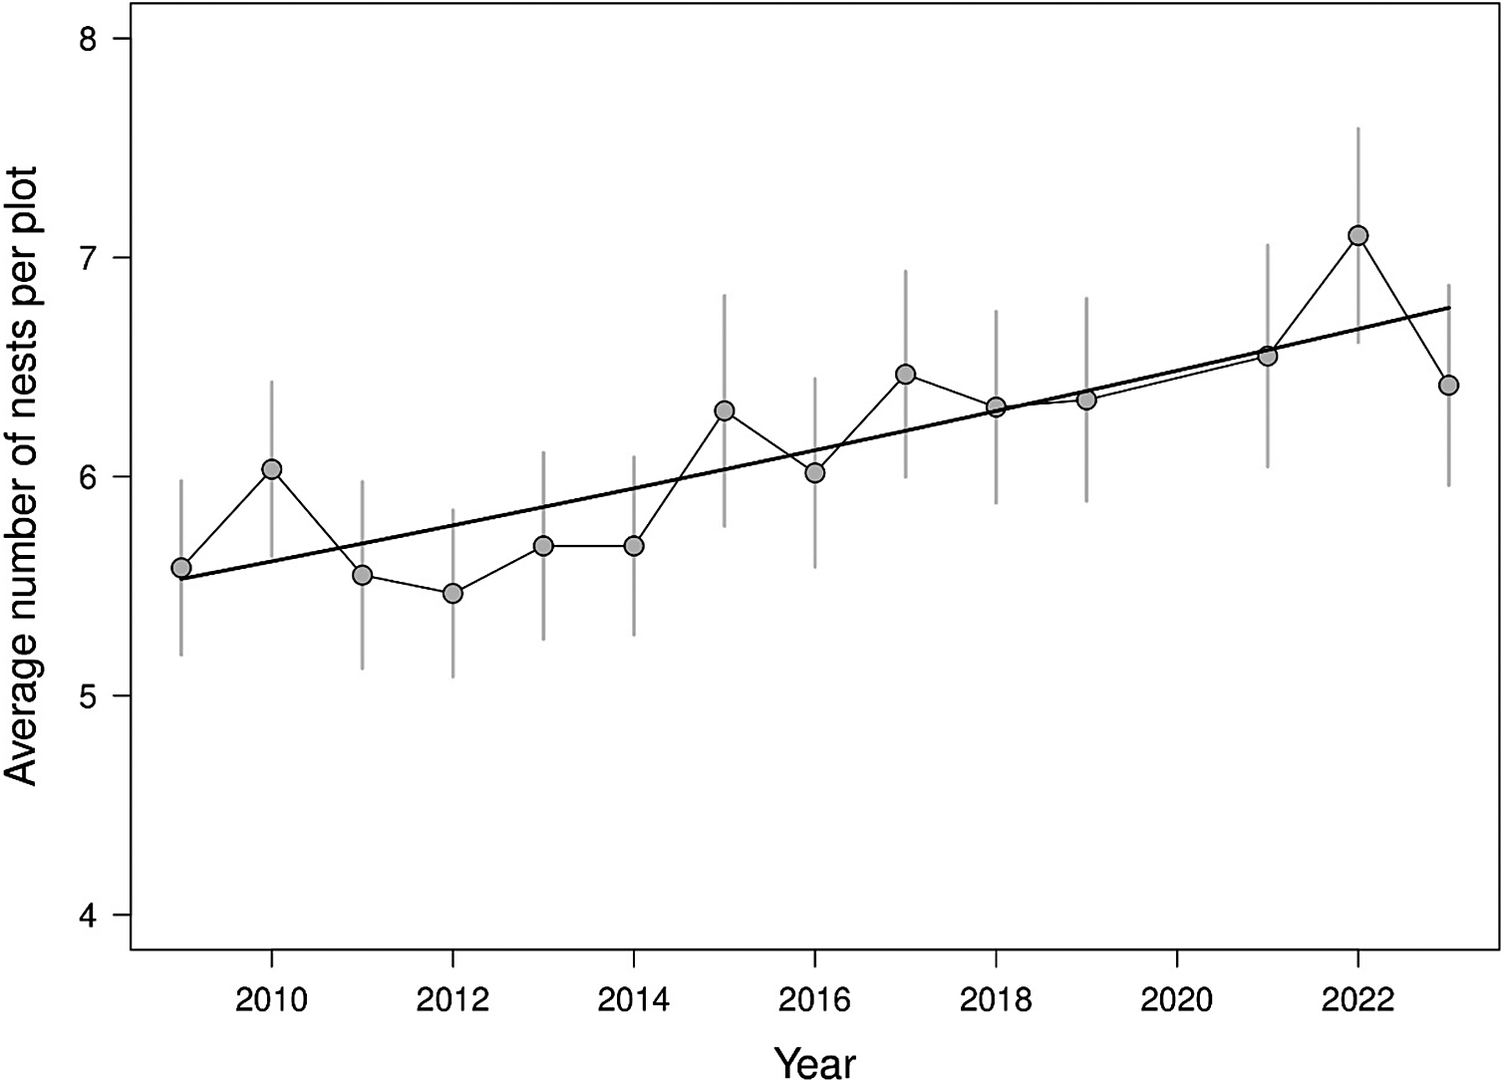
At the initial survey in 2009, the number of active nests in our plots ranged from zero (only one case out of 60) to 10. Assuming the 60 plots are representative, the Cory’s Shearwater population grew from 2009 to 2022 at an annual rate of 1.45 ± 0.32% (95% CI: 0.72–2.01%; Figure 3).
Variation in the mean number of nests per plot (± SE) during the study period and trendline at an annual growth rate of 1.45% per year.

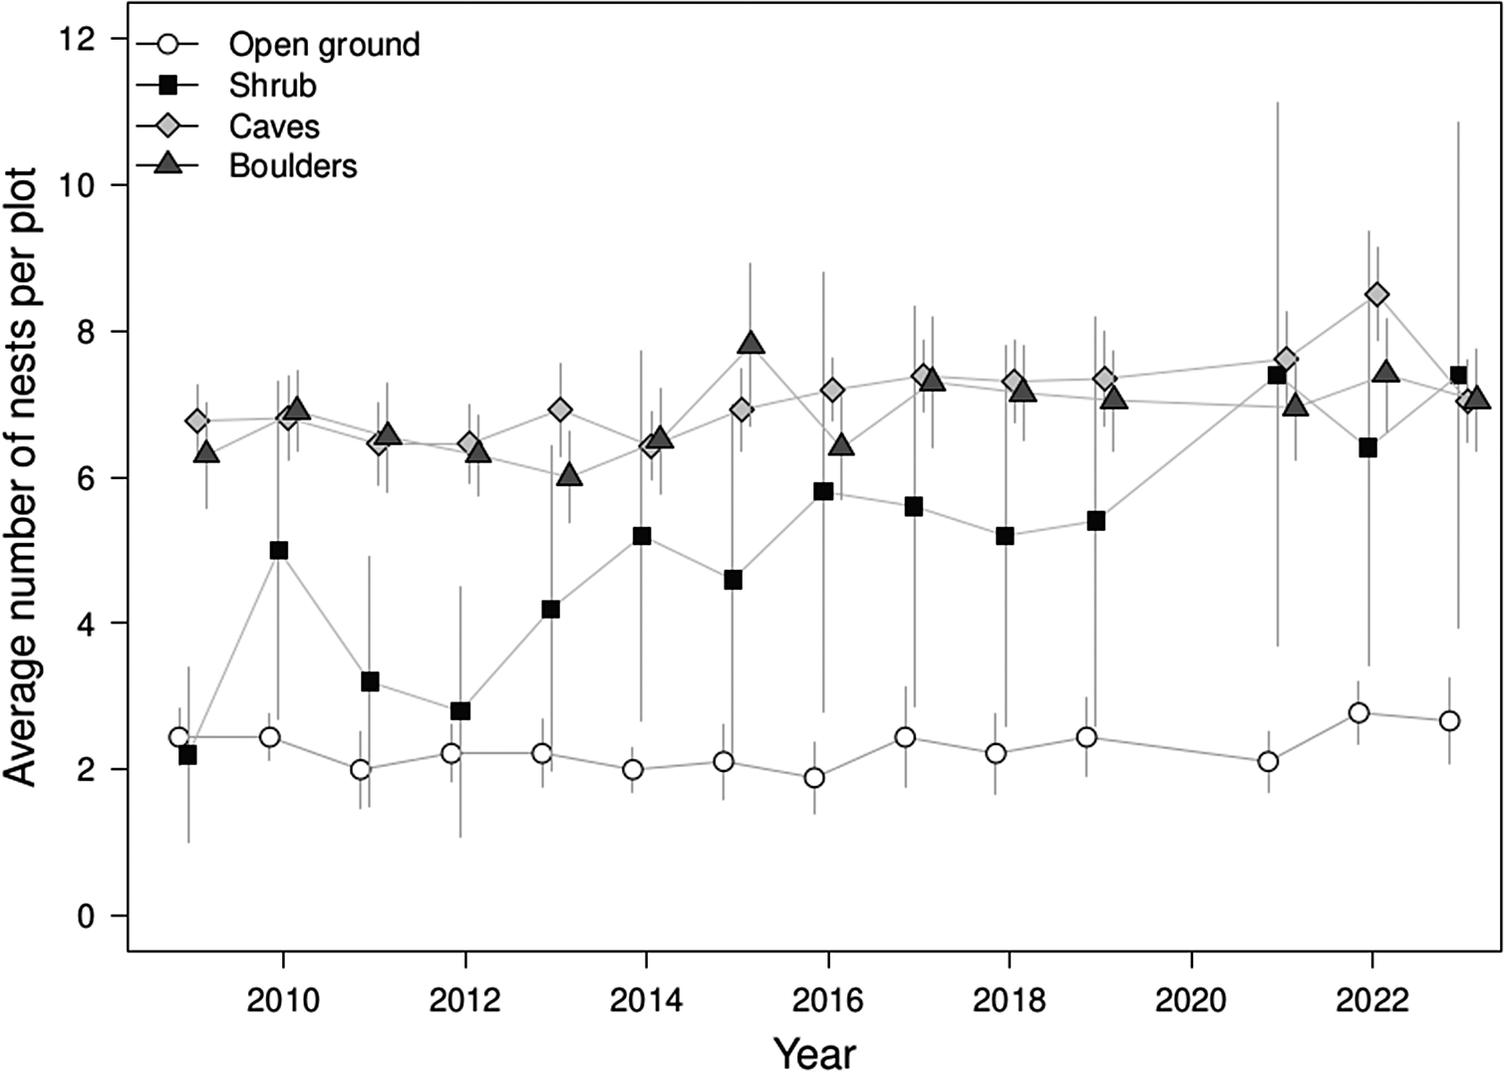
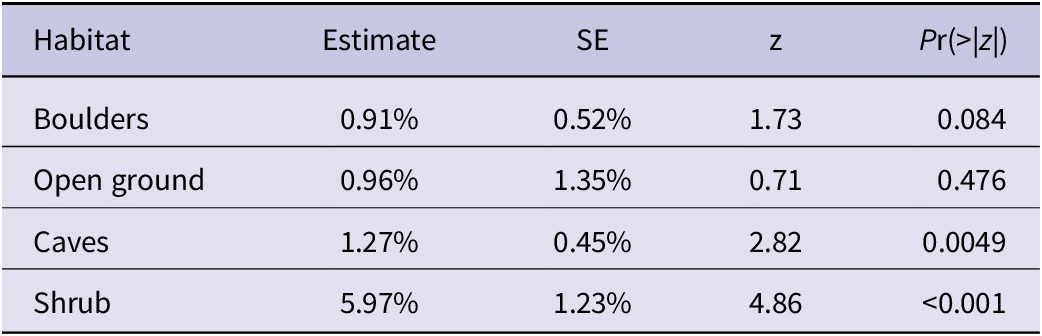
Growth rate significantly differed between habitats, being particularly high in shrub (Figure 4 and Table 1), with an additional significant positive contribution of number of nests at the start of the study (0.14 ± 0.016, z = 8.86, P <0.001), see Supplementary material).
Variation in the mean number of nests per plot (± SE) in different habitats during the study period (points are slightly out-phased to improve readability).

Estimated annual growth rates in different habitats (annual growth rates were calculated as the exponential of the corresponding values of slope from a generalised linear mixed model). Model R2 = 0.807

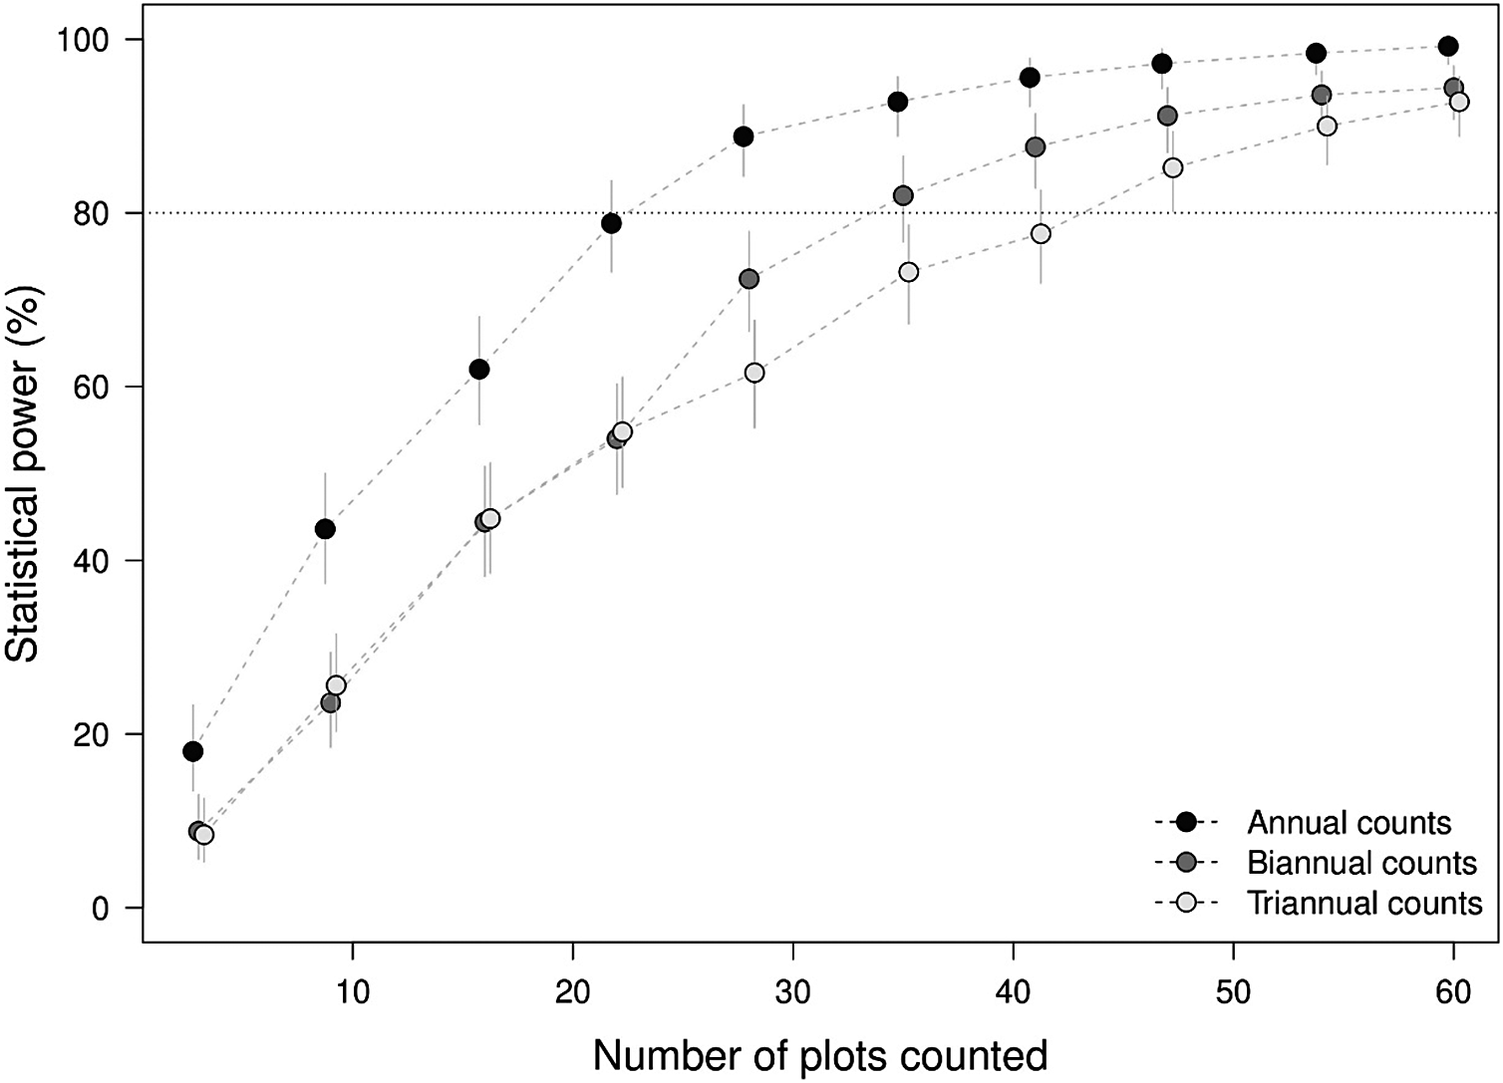
The statistical power of our approach was very high (almost 100%), increasing rapidly as the number of plots considered increased (Figure 5); even a less frequent sampling effort (counts at three-year intervals) would still enable the detection of a significant population growth. Our simulations further demonstrated that the number of years of counts data has an important effect on the likelihood of detecting trends (assuming annual counts), increasing quite rapidly in the first years and slowing down with longer term studies (Figure 6). With a sample size of 60 plots and 14 years of data, we would have been able to detect a growth rate of 1% with a statistical power of 0.8. The log-link function and the mean–variance relationship makes increases and decreases in rate behave asymmetrically in terms of power, which is noticeable with larger intervals between counts (Figure 6).
Mean (± SE) statistical power estimates from Monte Carlo simulations to detect the growth rate obtained in this study, in relation to the number of plots included in the study, under different survey frequencies within the same period (2009–2023): annual counts (our approach), one count every two years and one count every three years (points were slightly out-phased to improve readability). The horizontal line represents a power of 80%, which was considered adequate in this study).

Mean (± SE) statistical power estimates from Monte Carlo simulations to detect varying magnitudes of population growth, for four different durations of the study. The horizontal line represents a power of 80% (which was considered adequate in this study), and the vertical line represents the growth rate obtained in our study.

Discussion
The results of the present study demonstrate that the Cory’s Shearwater population nesting at the largest known colony for this species is increasing at an annual rate of 1.45 ± 0.32%. This was established with a high level of confidence through the annual monitoring of 60 plots and with limited time and workforce investment (two days of fieldwork by 2–3 persons per year, over 14 years).
While a random selection of monitoring plots theoretically results in the most representative count data (Bird et al. Reference Bird, Terauds, Fuller, Pascoe, Travers and McInnes2022), this would have resulted in most plots having no Cory’s Shearwaters nesting in them, as the nesting distribution is very patchy, and often at a very low density on the study island. Many plots falling in cliff areas or in White-faced Storm Petrel Pelagodroma marina colonies (highly susceptible to trampling) in the plateau would also have been inaccessible. An alternative would have been a stratified sampling design (Bird et al. Reference Bird, Terauds, Fuller, Pascoe, Travers and McInnes2022), but this would require detailed habitat mapping of the island in relation to shearwater nesting, and this was not available to us and would require a considerable research effort to establish. The alternative we pursued aimed to select plots covering a broad range of habitats in a broadly representative way. Our choices were entirely blind to potential habitat or site-specific previous or current population growth rate, but not to local population density, which we could roughly assess during plot selection. It is relevant to note that the limitations we experienced in plot selection result from challenges that are likely to be faced by many other fieldworkers interested in setting up a monitoring scheme (e.g. lack of previous knowledge on nesting locations, patchy nest distributions, difficulties in accessing cliffs and other areas), but we do not feel that these difficulties irremediably compromise the value of the approach used here.
Cliff areas (which largely correspond to the “caves” habitat) held an estimated 80% of the shearwater population in 2005 (Granadeiro et al. Reference Granadeiro, Dias, Rebelo, Santos and Catry2006), but only 64% of the nests inside plots at the beginning of our monitoring scheme in 2009, meaning that the correspondence between chosen plot sites and the representativeness of habitats was not perfect; however, the deviation, at this level, was small. We do not have data to assess how much our sampling plots deviated from a representative sample of the finer habitat categories used here, but we believe that it is also relatively small and hence that our estimates of population growth are not severely biased.
Without knowing the proportion of Cory’s Shearwaters nesting in each habitat type on Selvagem Grande, it is not possible to calculate an unbiased overall population growth based on our habitat-specific estimates of growth. We should note, nevertheless, that given that no habitats displayed a negative population growth, we can be highly confident that the population is increasing. Nevertheless, it is clear that the value of our monitoring would increase if a detailed habitat mapping of the island was carried out, and the proportion of nests in each habitat type was determined, with the trend analyses and inferences being carried out by habitat strata and finally, an overall estimate obtained by weighing each stratum appropriately.
Since the eradication of rabbits and mice from Selvagem Grande in 2002, two species of shrub have gone through a considerable expansion: shrubby seablite and, to a greater extent, salado. Cory’s Shearwaters extensively use the former species to nest under, but less often the second (33 nests under seablite vs 6 under salado within the study plots at our 2023 survey). Our results suggest that Cory’s Shearwater took advantage of this expanding habitat. Nevertheless, the conclusion that the shearwater population is growing is not driven by the rapid growth at this single habitat. Only 10.1% of the nests recorded inside plots in 2023 were under shrubs. Even after excluding the five plots of shrub habitat, the estimated population growth is significant, with an annual rate of 1.11%.
On Selvagem Grande there are no obvious areas of suitable habitat that are not currently being used by shearwaters. However, at other petrel colonies a patchy nesting distribution resulting in unoccupied suitable habitats is not uncommon. In such situations, the use of fixed plots placed only in existing colonies may not adequately capture population growth if this happens through the expansion of the colony to new areas, rather than by increasing density in currently settled patches (Buxton et al. Reference Buxton, Gormley, Jones and Lyver2016; Ryan et al. Reference Ryan, Dilley and Ronconi2019). In such situations, placing some plots in suitable but currently unoccupied areas is advisable and the mapping of colony limits may be just as important as detecting changes in nest density.
Cory’s Shearwaters, and close relatives, Scopoli’s Shearwaters, are regular victims of accidental mortality in fisheries (Báez et al. Reference Báez, García-Barcelona, Mendonza, Urbina, Real and Macias2014; Branco et al. Reference Branco, Fracasso, Pérez and Rodrigues-Filho2014; Cooper et al. Reference Cooper, Baccetti, Belda, Borg, Oro and Papaconstantinou2003), and the survival rate of adult breeders in our study population is known to negatively correlate with long-line fishing effort in the Canary Current area (Ramos et al. Reference Ramos, Granadeiro, Nevoux, Mougin, Dias and Catry2012). Seabird bycatch is one of the main factors threatening numerous species of seabirds (Dias et al. Reference Dias, Martin, Pearmain, Burfield, Small and Phillips2019) and hence concerns for Cory’s Shearwaters are justified. Despite this, our monitoring suggests that the population at a key nesting site, Selvagem Grande, has been recently increasing, in accordance with its long-term trend (Granadeiro et al. Reference Granadeiro, Dias, Rebelo, Santos and Catry2006). The only other area where trends are available for this species is along the coast of Iberia, where nesting numbers of Cory’s Shearwaters are increasing and the population has expanded to new nesting grounds in the most recent decades (Lecoq et al. Reference Lecoq, Catry and Granadeiro2010; Munilla et al. Reference Munilla, Genovart, Paiva and Velando2016). Further, unsystematic observations on Desertas Islands, Madeira, suggest a rapidly increasing population over the past two decades (P. Catry, personal observation). No published trends are available for other strongholds of the species, namely in the Azores and Canary Islands.
The current growth rate is slower than previously estimated for Selvagem Grande where, based on whole island counts, between 1980 and 2005 the mean annual growth rate was calculated at 4.6% (Granadeiro et al. Reference Granadeiro, Dias, Rebelo, Santos and Catry2006). The previous high growth rate involved a recovery trajectory from past human depredations (Granadeiro et al. Reference Granadeiro, Dias, Rebelo, Santos and Catry2006), and it is possible that the growth rate slows down as the population approaches the carrying capacity of the present environmental conditions, but it seems too early to assess this hypothesis.
A simple bootstrap exercise involving selecting 5,000 replicates of the mean growth rate and its standard error (Table S1) to the population estimated at the last whole-island census in 2005 (29,540 breeding pairs; Granadeiro et al. Reference Granadeiro, Dias, Rebelo, Santos and Catry2006), suggest that the current population is 38,830 pairs (95% quantile CIs = 34,373–43,713). This represents 99% of the population in the Selvagens archipelago, as only c.350 pairs nest on Selvagem Pequena and Ilhéu de Fora, the other two islands of the group (Catry et al. Reference Catry, Geraldes, Pio and Almeida2010; P. Catry, personal observation).
Conclusions
Despite known pressure factors, the Cory’s Shearwater population on Selvagem Grande keeps increasing, which parallels reports in other areas. We would encourage researchers and managers to set up similar monitoring schemes for underground nesting petrels at other sites, with site-specific adaptations and covering areas of potential colony expansion (which did not exist at our site). Further, where possible, the concurrent mapping of colony limits may be important, where those limits may change (Ryan et al. Reference Ryan, Dilley and Ronconi2019). We acknowledge that Cory’s Shearwaters on Selvagem Grande are a particularly easy population to survey, compared with most other petrels, as nests are very rarely deep enough to preclude an assessment of contents through simple visual inspection. In most other species, calculating nest occupancy adds an additional source of error to estimates (Clark et al. Reference Clark, Matthiopoulos, Bonnet-Lebrun, Campioni, Catry and Marengo2019), widening their CIs (Bird et al. Reference Bird, Woodworth, Fuller and Shaw2021). Nevertheless, this should not impede the application of the methodology employed here, with relevant adaptations, to other more cryptic petrel species.
Supplementary material
The supplementary material for this article can be found at http://doi.org/10.1017/S095927092400039X.
Acknowledgements
This research was funded by Fundação para a Ciência e a Tecnologia (FCT, Portugal) through projects UIDP/50017/2020, UIDB/50017/2020, and LA/P/0094/2020, granted to CESAM and UIDB/04292/2020 and UIDP/04292/2020, granted to MARE, and through the project LA/P/0069/2020 granted to the Associate Laboratory ARNET. Thanks are due to all the fieldworkers that helped with the surveys over the years.