

1. Introduction
The passing of Douglass C. North in 2015 leaves a huge hole in the field of Institutional Economics. However, judging by the number of citations that North's work has received over the years, and particularly during the current millennium, it appears that his work and his ideas will enjoy a fitting legacy. Indeed, as North's work on institutions and economic history continues to challenge the historical orthodoxy through new applications to old problems, interest in, and extension of, his methods is assured for many years to come.
In his examination of the rise and fall of the manorial system, and later Mercantilism, North determined that institutions matter because economic interaction is characterised by collective choice problems, contracting issues and information asymmetry such that prices do not always incorporate all the data about the transaction (see, for example, North, Reference North2005). Institutions may reduce these imbalances and lower the cost of acquiring all the information needed to transact within the economy, and are therefore important to economic analysis (Haita, Reference Haita2006). The research findings of Acemoglu et al. (Reference Acemoglu, Johnson and Robinson2001), Lange et al. (Reference Lange, Mahoney and vom Hau2006) and Prados de la Escosura and Smits (Reference Prados de la Escosura and Smits2007), amongst others, on various aspects of British and Spanish colonialism have supported North's assertion that institutions exert a significant influence on the economic formation and development of colonial economies.
However, the relevance of the Northian approach to understanding the economic development of the Australian colonies has yet to be attempted. The current paper attempts to redress this gap – and in doing so cast new light on the institutions that shaped the early economic development of the Australian colonies. It uses the lens of North's particular ideas on institutional theory to determine why two colonies, Western Australia (WA) and South Australia (SA), which were both established on the central western portion of the Australian continent in 1829 and 1836, respectively, had such disparate economic experiences during the course of the 19th century (to the end of 1900). The economic story of these two colonies resembles Aesop's fable ‘The Tortoise and the Hare’ in that one (SA) developed very rapidly, whilst, on most measures, the other (WA) grew at a slow rate throughout all but the final years of the in the 19th century, when it finally matched the former's performance’.
Given that that a majority of Australian histories focus primarily on the eastern colonies, the economic history of WA and SA has been largely neglected. This is disappointing because the experiences of these two colonies, in particular, represents a unique ‘natural experiment’ of the influence of alternative institutional frameworks on economic performance. WA was established under the principles of Mercantilism, whilst SA was established under the principles of systematic colonisation. Because the different methods of colonisation were introduced at similar points in time and in similar geographic and social contexts studies of the early economic history of WA and SA can unique provide insights to the influence of particular institutional forms on economic performance. This study utilises a large volume of unpublished statistical data to examine whether – and if so how – key institutions relating to property rights, capital markets, the State and the cultural institutions of religion and education were factors in explaining the disparate economic development of two colonies that existed in similar geographic, historical and economic contexts. As such, the study is a unique and important test of North's key proposition: ‘Institutions Matter’.
The broad conclusions of our research are that the way colonisation was planned in Britain shaped the way in which her institutions were transferred to the colonies, and that this affected the early economic performance of WA and SA in a way that a Northian analysis would suggest. That is, as North emphasised, the different institutional matrices established in the two colonies, especially around property rights, affected the incentives and deterrents to engage in economic activity (especially the development of agriculture, the principle economic activity). In doing so, institutions were key determinants of the levels of material prosperity achieved in the two colonies in the 19th century. The data assembled for this study indicates that WA's institutions were poorly defined and it wasn't until these deficiencies were corrected that significant economic growth occurred. In contrast, SA's institutions, although they were far from ideal, had a superior specification and enabled rapid economic formation from the time of initial settlement.
2. Background: the colonies of Western Australia and South Australia
Unlike the principle colony of New South Wales (NSW), WA and SA were founded in the early part of the 19th century with free institutions, rather than the penal institutions and, crucially, both were organised under different theories of colonisation (Keneally, Reference Keneally2009). WA was established in 1829 with land grants as the standard basis of property rights (Statham, Reference Statham and Stannage1981). Land, the principle public asset, was vested in the Crown through Parliament and could be disposed of in any manner the Crown thought fit. Land grants did not require an upfront purchase and full legal ownership was normally gained after improvements had been made or other conditions imposed by the government had been met (grants could also be revoked). Land grants were used by the government as a means of enticing settlers and rewarding emancipated convicts, public officials and the military in lieu of salaries (Bowle, Reference Bowle1974: 128). By this mechanism, the government was, in theory, free from financing new colonial ventures, but in authorising their creation new markets would be created as vents for metropolitan surplus capital and labour. Given the lack of knowledge about resources, the distances between colonies and the metropolis, and the accuracy in objectively establishing the efficacy of improvements made to colonial land, the grant scheme may have had the lowest transaction cost to the government instead of establishing full property rights (ownership of land) at the beginning of economic formation in settler colonies.
James Stirling RN [1791–1865], the colony's main promoter, was stationed in NSW between 1826 and 1827. When promoting the colonisation of WA in London, he drew inspiration from NSW as a suitable property rights model to transfer, as it had proved moderately successful in developing the NSW economy after about 1810 (Butlin, Reference Butlin1994; Darwin, Reference Darwin2012). In the plans for WA, potential colonists would introduce the capital stock and (non-convict) labour to qualify for land grants. If their grants had been wholly improved with 10 years, the settler earned its titled ownership with all attendant common law protections (Statham, Reference Statham and Stannage1981). Exportable commodities from the productive land would be taxed to pay for colonial administration and thus the colony would be entirely self-funding.
For this model of colonisation to work, the right combinable mix of land, labour and capital was required. However, the system of allocating land in WA was without colonial precedent and possessed a number of undesirable features. First, the grants were inherently worthless unless they could produce something of value (and this required substantial capital and labour investment); second, because grants could be so cheaply obtained – in terms of introduced capital stock and labour – and with few restrictions on what capital stock qualified for a grant, colonists were able to accumulate enormous parcels of land that were beyond their financial capacity to improve, and this locked up large amounts of land and forced population dispersion and third, because grants were effectively gifts from the British government they could be withdrawn upon any pretext (such as failure to improve the grant within the set timeframe). As a result of these features, grantees did not enjoy secure property rights in WA. Stirling was vested with the governorship of the colony and forewent a salary in return for a grant of 10,000 acres (an enormous parcel of land) in an area of his choosing within the colony. Should the colony prove successful, Stirling would become a wealthy landowner and could expect significant promotion within the public service. Stirling thus had strong self-interested motivations to promote the colony of WA.
The mental models and interests of the promoter of SA, Edward Gibbon Wakefield [1796–1862], were quite different. During a stint in gaol in 1827 for kidnap, Wakefield studied the outcomes from land grants in NSW and was influenced by Adam Smith's views on how colonisation should work under free trade conditions. Smith had demonstrated how mercantilism hurt colonial economic formation and he advocated not only the adoption of free trade but also the abandonment of colonisation as a process for increasing British wealth (Robbins, Reference Robbins2006). In 1829, several months after the founding of WA, Wakefield published his criticism of the NSW the land grant system, emphasising how it resulted in a shortage of non-convict labour and a dispersion of settlers. Wakefield criticised the metropolitan perception that colonial land (being the principle wealth creating asset and means of upward social mobility) had a low resource value and could therefore be given away to colonists (Kittrell, Reference Kittrell1965, 194).
Wakefield subsequently set out his proposals for a new colonial settlement system that resulted in a more optimal combination of land, labour and capital. The system's foundation was based on land sales, not grants, to capitalists with the resulting funds raised to support the conveyance of a gender balanced class of labourers to the colony and the costs of providing local government (Kittrell, Reference Kittrell1973). The amount of land that could be accumulated was in direct proportion to the colonist's net worth thus preventing the build-up of non-productive land as had happened in NSW (and would soon to occur in WA). Wakefield also envisaged that colonists without financial means would work for several years to save up enough capital to become landowners. As they, in turn, would require labour (and have an incentive to sponsor the passage of migrants) the ‘system’ would become almost entirely self-perpetuating (Kittrell, Reference Kittrell1973). By increasing the price of colonial land to some non-zero amount (the ‘sufficient price’), its resource value also increased. In addition, under English Common Law, the sale of land came with clear ownership rights and unlike land grants there was no obligation to improve it. In effect, Wakefield identified that the economic benefits achieved from selling colonial land exceeded those achieved from keeping land vested in the crown and led to a clearer set of property rights (Alston et al., Reference Alston, Libecap, Schnieder, Garfinkel and Skaperdas2008: 160). His insights resulted in a new model of colonisation, which was first proposed for SA in 1829 and saw settlement occur in 1836.
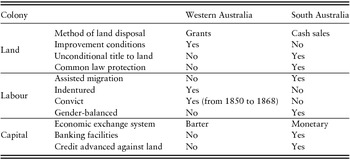
Key details of the design principles that guided the establishment of SA are summarised in Table 1 and contrasted against the methods of colonisation used in the establishment of WA. The details in the table highlight how the colonisation methods affected property rights over land, but also key labour and capital market institutions. Wakefield's scheme responded to the perceived deficiency of the Mercantilist approach; that it led to the under-exploitation of colonial assets because many outcomes were left to chance. His alternative was to link the sale of land for cash to the supply of labour and the creation of a cash-based economy.
Comparison of colonisation methods at settlement

Several studies of SA's history have already noted the impact of Wakefield's systematic colonisation on economic development in the 19th century (see, for example, Pappe (Reference Pappe1951) and Richards (Reference Richards1986)). A number of studies of WA's colonial period have also noted the impediments to economic development posed by its system of property rights linked to land grants (for example, see Roberts (Reference Roberts1924) and Statham (Reference Statham and Stannage1981)).Footnote 1 However, to our knowledge, no previous study has exploited the potential to contrast the institutional environments of the two colonies to gain insights on the impact of institutions on economic performance.
This study also provides an important opportunity to highlight the significance of Wakefield's new colonisation framework – and the SA experiment – in the history of political economy. Wakefield garnered considerable support from contemporary intellectuals, such as Mill (Reference Mill1848: 965–6), who in Principles of Political Economy noted the importance of Wakefield's scheme for economic development in new colonies:
Before the adoption of the Wakefield system, the early years of all new colonies were full of hardship and difficulty: the last colony founded on the old principle [of granting land], the Swan River settlement [i.e. WA], being one of the most characteristic instances. In all subsequent colonisation, the Wakefield principle has been acted upon, though imperfectly, a part only of the proceeds of the sale of lands being devoted to emigration: yet wherever it has been introduced at all, as in South Australia, Victoria and New Zealand, the restraint put upon the dispersion of the settlers, and the influx of capital caused by the assurance of being able to obtain hired labour, has, in spite of many difficulties and much mismanagement, produced a suddenness and rapidity of prosperity more like fable than reality.
Having established a network of radical MPs and influential intellectuals upon his release from gaol, Wakefield became a subject matter expert on colonial affairs and gave evidence to a number of parliamentary enquiries in the 1830s. Wakefield's scheme also attracted the attention of Karl Marx who was sceptical of Wakefield's assertion that potential settlers who had insufficient capital to purchase land would only be temporarily disenfranchised, noting that capitalist accumulation depends on the existence of a permanent labour class (Marx, Reference Marx1999; Whimpress, Reference Whimpress2008). However, Marx apparently agreed that Wakefield's scheme was positive for the development of a capitalist economy, describing systematic colonisation as a ‘pis aller’ or last resort and noting that Wakefield had inadvertently revealed the secret of capitalism, namely that capital is impossible without wage labour, and wage labour is impossible without the separation of the labourer from the means of production (Whimpress, Reference Whimpress2008). The SA experience, and how it contrasted the experience of WA, established under an alternative institutional model, thus is also an important ‘test’ of early understandings of the drivers of capitalist economic expansion.
3. North's analytical framework and extensions
This paper's comparison of the early economic performance of WA and SA makes use of North's analytical framework. Reflecting North's association with new institutional economics (Reference LloydLloyd, n.d.), a core analytical category in this framework is the purposeful individual. North's early work described institutions as designed and efficient solutions to the co-ordination problems faced by individuals (for examples, see North and Davis, (Reference North and Davis1971)). In doing so, it contrasted the old institutional (OIE) approach in which ‘the individual is socially and institutionally constituted [that is] moulded by cultural or institutional circumstances’ (Hodgson, Reference Hodgson2000, 327). However, the ‘latter day’ North became more OIE, giving prominence to how institutions shape the behaviour of individuals, and this is also reflected in the design of the current study. From 1990, North linked together history (time), economics, political science, sociology and other social sciences and highlighted how norms and beliefs constitute and regulate the actions of individuals (see Zouboulakis, Reference Zouboulakis2005).
North defined institutions as humanly devised constraints that shape human interaction, whether they be formal rules or informal codes of conduct (Hodgson, Reference Hodgson2006). A theme that runs through all of North's (Reference North1990: 97) work is that institutions form the incentive structure and define the choice set for purposeful individuals. Trade promoting institutions are perceived to mobilise resources (e.g. capital), and help address collective choice and information asymmetry problems that make it difficult for individuals to solve contracting problems (North, Reference North1990: 100). As is well known, North's analysis – linked to Coase – emphasises the links between institutions, the level of transaction and production costs and, in turn, potential gains from trade (North, Reference North1990). Poorly constructed institutions are identified as a source of higher transaction costs, increased information asymmetry and uncertainty; all of which reduce the potential for and likelihood of trade and exchange.
A key question addressed by North was why did some societies develop formal and informal institutions that promoted the type of trade and exchange that characterises Western capitalist economies, whilst other did not? North's (Reference North1990) account of institutions emphasises the ‘bit-by-bit’ acquisition of knowledge gained from learning by doing. For the purposes of the current paper, an especially significant part of this process concerns the transformation of formal rules and informal behavioural norms (that is, institutions) into societal and economic structures (North, Reference North1994: 363). The process also implies that institutional change is a slow, path dependent process, with current institutions having long-term, dynamic effects on the set of institutions, economic behaviours and outcome in a given society.
Whilst North's ideas have appealed to many on an intuitive level, the task of assessing their relevance to the economic performance of particular nations has proved difficult. In part, this is due to the complexity of institutions. During the early 2000s, much of the literature on institutional economics focussed on a single institutional type, such as property rights or capital markets. However, this approach ignored the influence of many other institutions – and the nature of their interactions – and, as a result, it had a tendency to assign a higher weighting to the importance of the chosen institution in the determination of economic development. Adopting a matrix or portfolio is a more logical approach to the analysis of the economic effects of institutions, and one that is more consistent with North's theory. This is because institutional influences on an economy will occur through a number of formal and informal institutional components – and the relationships between these institutions and other aspects of the economic environment are important to comprehend.
A number of institutional typologies are available to help guide the identification of institutions in an institutional matrix. For example, Parto (Reference Parto2005: 31) identifies three general but overlapping categories of institutions: form-based institutions, which encompass formal and informal codes and practices and are reflected in the design and operation of State and other organisations; behavioural institutions, which regulate the types of activities that individuals can pursue (see, for example, North (Reference North1990: 5), Scott (Reference Scott2001) and Rutherford (Reference Rutherford1994: 182)) and constitutive institutions, which encompass the mental models, constructs or definitions that influence how individuals want to act (Olson, Reference Olson2000).
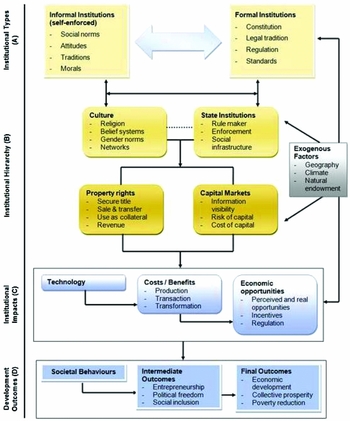
Empirical work on the effect of institutions on economic performance needs to also take account of the availability of data to construct measures of different institutions in the relevant time periods. Compromise and imprecision are necessarily involved. This is reflected in the selection of institutions for the matrix of institutions given in Part B of Figure 1 (below), and in the aspects of each broad ‘type’ of institution that we include in our empirical analysis. The diagram shows that we attempt to capture four inter-related institutions: property rights, capital market institutions, State institutions and cultural institutions. Property rights are conceptualised as the set of formal and informal rules, laws and customs that define usage rights to maintain, improve and physically transform land and other resources; the right to earn income from the resource; rights and obligations relating to the acquisition and disposal of the resource and the right to call upon enforcement by the State (Eggertson, Reference Eggertson1990). Capital market institutions include a market to transfer savings from those agents with an excess to those with a deficit with pricing based on the risk, cost and flows of information about financial transactions. Effective State and political institutions for capitalist economies are likely to feature: a constitution, the rule of law, an independent judiciary and representative political institutions. Cultural beliefs – and supporting education institutions – that legitimise and encourage the pursuit of individual material reward, equality, a gendered division of paid and unpaid work, landownership, and so on, are further key components of capitalist economies.
The institutional matrix.

Figure 1 also illustrates the links between the institutional matrix and economic development that we perceive. As can be seen, Development Outcomes (D) cannot be attributed to one single institution (A). Working backwards, Figure 1 shows that development outcomes depend on a dynamic interaction between the institutional impacts (C) resulting from the institutional matrix (B) of property rights, capital markets, State institutions and culture. Strong property rights are commonly perceived to be fundamental to capitalist economic structures. Outside sources of funding are also required for the mass-production of commodities, which creates a key role for capital market institutions. State-based institutions have been identified as essential for successful economic transformations through planning and institution building. As noted above, capitalist economies are situated in a supporting web of cultural attitudes, norms and beliefs. There are, of course, external factors such as geographic location, climate and natural resource endowments, the structure of the labour force and technological factors that also influence institutional evolution and economic development. The effects of these factors have been included in our overall analysis.
4. Data, measures and approach
The major challenge that confronts historical studies of the role of institutions on economic performance is the limited availability of relevant, reliable and comparable data both on economic performance and the range of institutional and other factors relevant to its determination. This study confronted all these problems and, in many respects, it represents an attempt to assemble and make good use of the statistical data on WA and SA in their colonies’ Blue Books and later their Statistical Registers. These statistical collections were the product of efforts of the British Colonial Office (CO) to collect data from across Britain's empire as part of its centralised framework of governance and control (Australian Bureau of Statistics, 1989). After 1822, the method of collection was standardised and became colloquially known as the Blue Books (Australian Bureau of Statistics, 1989: 7). Each colony's Blue Book (because it was blue) collected the same type of data irrespective of geographic location across the British Empire and therefore allow for a direct comparison between WA and SA. From about 1850 onwards, following the granting of responsible government (to all colonies except WA until 1890), a new type of annual report emerged, first known variously as Statistics, Statistical Returns or Statistical Register (Australian Bureau of Statistics 1989: 7). The scope of these reports was substantially larger than previous data collections and covered almost all aspects of economic, financial, demographic and social life in the colonies. The reports were disseminated for local and imperial consumption, and helped inform policy decisions.
In WA, the Blue Books were published from 1837 (not 1829) to 1895, after which they were succeeded by the Statistical Register of WA. Data covering the initial years 1829 to 1836 is not readily available, however, the British Parliamentary Papers on Australia and New Zealand 1800–1899 contain certain data covering the period to 1836 and have been used where appropriate. In SA, the Blue Books were used from 1837 to 1844 after which the statistical content was expanded to a publication initially called South Australia: Statistics from 1845 to 1849; then South Australia: Statistical Returns to 1875 and finally the Statistical Register of South Australia from 1876.
Whilst the aim of the Blue Books and the Statistical Registers was to impose a uniform framework on the gathering of important information about colonial economic development, colonies the world over were anything but consistent in what they measured and how they reported it. This is particularly evident when one contrasts the data between WA and SA. The former is patchy in the formative years and subsequent editions don't lend a high level of confidence as to the accuracy of certain sets of sets of data, but this improves as the colony developed. On the other hand, the SA statistical data stands out as being of extremely high quality for the entire period. The common characteristic of both sets is the wealth of information available on each colony. As such, they offer a uniquely rich economic and institutional portrait of the colonial period.
In addition to the Blue Books and Statistical Registers, data on the two colonies is available from the Census that were conducted at regular intervals throughout the 19th century following standard imperial practice: WA from 1861 and decennially thereafter; and from 1844 in SA on a quinquennial basis until 1871, after which it became decennial. However, whilst these sources provide data that is directly comparable between WA and SA they are not consistent with the Blue Books and Statistical Registers published in the same year. This is probably due to differences in the timing of each data collection exercise.
This study uses secondary sources to resolve inconsistencies or fill in the gaps found in the primary documents. The most important of these sources was Australian Historical Statistics vol. 10, which provides comparable data on WA and SA (Vamplew, Reference Vamplew1987). The publication South Australian Historical Statistics (Vamplew et al., Reference Vamplew, Richards, Jaensch and Hancock1983) provides significant supplementary data on colonial SA. Data on the capital markets, particularly banking, was generally not included in the primary sources until the end of the 19th century. In his two ground-breaking publications, Foundation of the Australian Monetary System 1788–1851 and The Australian Monetary System 1851–1914, Butlin (Reference Butlin1968, Reference Butlin1986) made extensive searches of the archives of the main Australian trading banks. The financial data used in Butlin's study is mostly complete and, once transcribed to an electronic format, became a valuable asset for our study.
An important preliminary task for this examination involved the construction of a database containing time series data on the aggregate institutional and economic measures for each colony for the period 1829 to 1900. The task involved manually transcribing the data from the different relevant primary and secondary sources, as well as conducting a large number of calculations to standardise a plethora of imperial measures into consistent workable units (e.g. bushels or ounces to tons, etc.). It also required the conversion of imperial currency (pounds, shillings and pence) into a decimal format to allow statistical manipulation of monetary statistics (Microsoft Excel® has trouble coping with pounds, shillings and pence).Footnote 2
The creation of measures of the institutional and other factors relevant to economic performance posed a number of particular challenges given the absence of strong guiding principles on the quantitative measurement of institutions and organisations. Institutional analyses of economic history use a wide range of different measures, which reflect the different contexts and concerns of their studies. For example, Acemoglu, Johnson and Robinson use military records on deaths of service personnel in overseas colonies to determine whether institutions were extractive or settler orientated. Conversely, Prados de la Escosura and Smits use temperature data, latitude and percentage of land area with 100 km of sea coast to assess colonial institutions in the same way. The measures of institutions employed here are likewise unique in terms of institutional analysis; and selected on the basis of relevance to the circumstances of (and data available for) WA and SA.
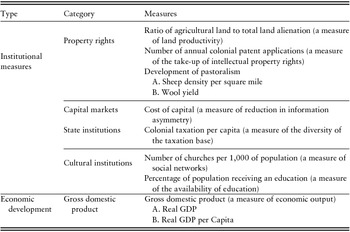
Table 2 lists all of the institutional and economic measures examined in our overall examination of the institutional on the economic development of WA and SA. In this article, we discuss a small subset of the total number of measures that form part of the institutional framework, based on the available colonial data. Property rights are ‘measured’ by variables relating to the ratio of Agricultural Land to Total Land Alienation (a proxy for land productivity), the number of Annual Colonial Patent Applications (a measure of the take-up of intellectual property rights) and the Development of Pastoralism (a measure of sheep farming productivity). Capital market institutions are measured, in part, by the Cost of Capital (a measure of reduction in information asymmetry – and a key North measure of institutional effectiveness). For state-based institutions, there is a measure of the cost of colonial administration (an inverse measure of political maturity). Measures of the cultural environment include the number of churches per 1,000 of population (a measure of social networks); and the percentage of population receiving an education.
Selected measures derived from the colonial data

The key measure of economic performance used in this study is a version of GDP. The construction of this measure posed a significant challenge due to gaps in the available data for the full period under study. However, what sectoral data that exists from the Blue Books and Statistical Registers was aggregated. The nominal GDP measures for both colonies were then deflated using a series of comparable retail prices from each colony, and then divided by the population base to obtain a Per Capita GDP estimate.
The approach that can be taken to the task of assessing the links between the (measured) institutional matrix and the economic performance of each colony is also limited by the available data. Descriptive methods are the only possible alternative, as there is not sufficient data on all the variables likely to be relevant to economic performance to support the application of econometric techniques. Reflecting this, in the following section, the key aspects of each of the four institutions are first summarised, and these are placed into context with an historical narrative to explain how the institution functioned, how it was changed (internally or externally – by Britain) and how it contributed to economic development. This section also includes an account of the development of an effective institutional matrix in each state, and explores how the timing of this development was correlated with the rate of economic progress in the two colonies.
5. Findings
The available measures of the institutions identified in colonial WA and SA indicate substantial differences that are likely to have had an appreciable influence on the pace of their economic development. The systems of property rights were a key source of difference. In WA, the grant system was instituted, which allowed colonists to amass 40 acres of colonial land for every £3 of assets invested. Cash was not included in the asset test for land grants and thus only colonists with the ability to transport large amounts of physical capital, such as (and preferably) agricultural assets, were able to secure colonial land.Footnote 3 As was noted earlier, an alternative approach to land rights was adopted in SA. In this colony, land could only be purchased by sale for cash and, thus, colonists could only amass land up to their available capital.
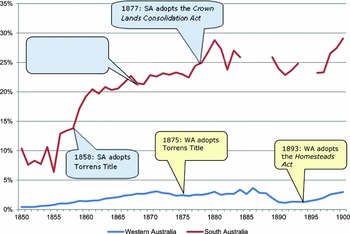
The WA system of property rights resulted in an extreme concentration of land ownership amongst a small number of dispersed settlers in the initial years of foundation and this hindered the early development of agriculture. As shown in Chart 1, the ratio of agricultural land to the total of alienated land barely exceeded 3 per cent across the century: For example, in 1850 the total amount of land alienated was slightly less than 1.7 million acres with only 7,500 acres under crop. By 1900, 6.8 million acres had been alienated and only 200,000 acres were given over to farming (this led to an over-reliance on SA surplus food stocks). This statistic highlights how grant accumulation exceeded the financial capacity of the colony to develop the land. A number of other deficiencies with the initial property rights structure contributed to this adverse outcome. The grant system was inherently insecure, with the colonist required to improve granted land up to a certain threshold within 10 years and failure to meet these requirements resulting in forfeiture of the grant. Without labourers to work the land,Footnote 4 and with a dispersed population, the chances of not fulfilling the terms of a grant were high, which is likely to have added to the risk, and reduced the incentives, associated with land development.
Ratio of agricultural land to total land alienation.

In SA, land was sold from inception. This meant that the colonists could only purchase as much land as their available cash resources would allow, and this mechanism was designed to concentrate settlement in a combinable (but not necessarily efficient or optimal) supply of capital and labour. The sale, rather than granting of land, also brought common law rights to the title of property, an innovation in Australian land tenure (up to that point in the 19th century) that was free of improvement conditions and arbitrary confiscation. In theory, with secure ownership rights, settlers in SA appear to have had greater incentives to develop their land to its full potentialFootnote 5 and this contributed to a much larger amount of land devoted to agriculture in the colony (Chart 1).
The revenue from land sales in large part paid for a regular stream of migrants to SA during the first 50 years of settlement. In contrast to WA, which was affected by a masculinity ratio that averaged 1.61 from 1837 to 1900, the sex ratio was almost at unity in SA by the end of the century, contributing to natural population growth and thus furthering the prospects of economic expansion. A sex ratio close to unity was a key goal of Wakefield's theory of systematic colonisation (Kittrell, Reference Kittrell1965). A number of institutional innovations that were introduced in SA during the 19th century provided further support for the development of its economy. These included measures to reduce search and information costs that increase security of land title, and allow farmers easier access to the land through sale on credit. For example, in 1858, SA introduced the Torrens Title, a system of land title in which a register of land holdings was maintained by the state, which replaced the cumbersome need for property deeds that frequently resulted in ownership disputes (South Australia, 2008). In 1869, SA adopted a system of land tenure that allowed farmers to buy land on credit (Leadbeater, Reference Leadbeater2011). Chart 1 shows clearly that WA lagged behind SA in adopting these institutional innovations for a significant period of time. SA was also amongst the group of colonies that exerted significant institutional pressure on Britain to introduce a standardised land lease. When this became available in 1851, SA was a rapid adopter of pastoral and mining leases that also led to a lowering of transaction costs incurred in exploiting land-based resources but also resulted in a weaker property rights (Productivity Commission, 2002).
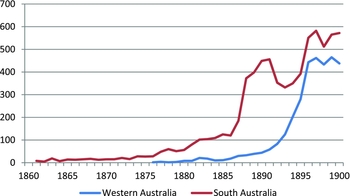
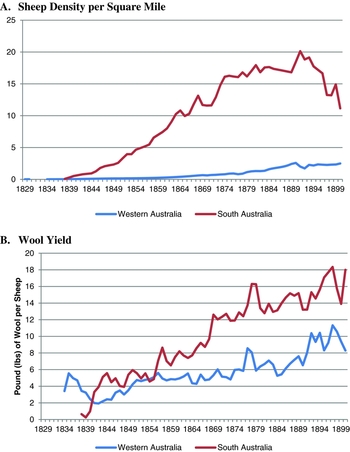
It is important to also note that SA was much more active in protecting the property rights of innovators through the granting of patents as shown in Chart 2. This appears to have contributed to the development of new techniques and processes, particularly in agriculture where labour costs were exceptionally high, which are likely to have further contributed to the colony's superior economic performance. Such innovations included the selective use of sheep cross-breeding, adopted earlier in SA than in WA, which contributed to higher yields of wool production (see Chart 3) and added substantially to the colony's net income.
Number of annual colonial patent applications, 1860–1900.

Development of pastoralism, 1829–1900.

Previous economic historians (e.g. Statham, Reference Statham and Stannage1981) have emphasised that geographic and climatic factors were the differentiating factors that account for WA's slow start in agriculture (the primary economic activity at foundation). However, these factors were somewhat similar in Perth and Adelaide. For example, both settlements were established on coastal plains (of limited fertility) facing the Western horizon with a chain of hills running north to south, and at a similar distance eastward from the coast, beyond which are located substantial fertile plains. In climatic characteristics, both settlements share a Mediterranean climate, comparable annual temperatures as well as statistically identical hours of daylight and sunshine (important for photosynthesis). Rainfall is, however, low in both colonies but more so in SA. Between 1876 and 1901, the annual average rainfall received in Adelaide was, on average, 7.87 inches lower than Perth but was slightly less variable. Therefore, if we eliminate the geographic and environmental differences between the colonies on the development of the agriculture, then the institutional argument appears to be the more likely explanatory variable.
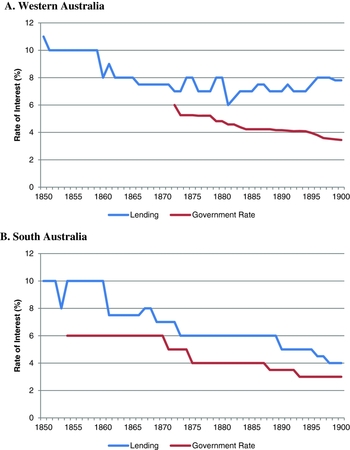
The systems of property rights set up in the two colonies also had significant implications for the development of their capital market institutions. WA's property rights effectively starved the colony of money since cash was not an eligible asset that qualified its owner to a grant of land. As a result, the first colonists were undercapitalised and barter became the chief mode for exchange during the 1830s (Butlin, Reference Butlin1986). The uncertain property rights attached to a land grant also effectively disbarred its use as a form of loan collateral, which restricted the use of credit throughout the economy. Accordingly, banks, when they commenced operations, were conservative, risk averse and, not surprisingly, short of liquidity. As a result, throughout the period, the interest rates applying to private borrowing in WA remained relatively high (see Chart 4).
The cost of colonial capital, 1850–1900.

Banking operations commenced upon SA's foundation but were somewhat undercapitalised despite vigorous competition (Butlin, Reference Butlin1986). Nevertheless, with its colonial economy based on cash commodities: farming, pastoralism and, after 1842, mining there was a significant amount of cash circulating throughout the colony. In addition, land in SA, with its title guaranteed by the common law, was an eligible form of loan collateral. This is reflected in the trend on commercial lending rates, which fell from around 12 per cent in 1839 to 4 per cent by 1900 (average 7.3 per cent for the period) as shown in Chart 4. Government lending rates also fell from 1855 and the spread between public and private lending narrowed to about 1 per cent by 1900 indicating that international lenders (the largest providers of foreign direct investment) rated SA's sovereign and commercial credit risk as low vis-à-vis WA. This allowed the SA government to borrow heavily on the London Money Market (LMM) to fund infrastructure and provide many public goods including telegraphic connection to Britain and local railway transportation.
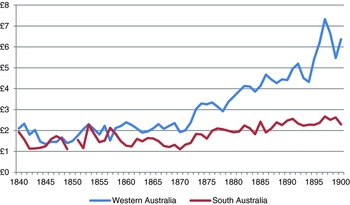
The limited economic development of WA also affected the ability of its State institutions to support the development of critical economic and social infrastructure. WA did not achieve self-government for more than 60 years after foundation because its internal tax base was insufficient to cover the cost of administration and thus the British taxpayer was called upon to fund the difference until 1882 (Appleyard, Reference Appleyard and Stannage1981). In 1837, there were two revenue categories: licences for pastoral grazing and taverns, and customs duties – established in 1831 as a revenue raising measure (Fraser, Reference Fraser1983). Twelve years later, the volume of shipping at the settlement allowed for harbour fees to be levied in order to maintain the facilities. However, even by 1886, there were only six revenue sources, with wharfage, stamp duty and probate taxes being added in the previous 2 years. As shown by Chart 5, WA was heavily dependent on taxation (as opposed to fees) to fund its government and provide public services.
Colonial taxation per capita, 1840–1900.

In contrast, SA achieved self-government in 1857 a mere 20 years after colonial formation; aside from a period in the early 1840s, the British taxpayer was not called upon to fund administration. Taxation per capita was significantly lower in this colony compared to WA, and averaged about £1 16s 0d for the entire period. As the century progressed, the data show that the proportion of revenue collected from taxation fell from a high of 91 per cent to just under 30 per cent as government charged fees for the providing certain public functions e.g. tavern licences, port dues, pilot charges, tolls, railway and telegraph dividends. Unlike WA, public revenue in SA appears to have been ‘easy’, as Adam Smith would have said, in as much as it was based on a mix of customs, excise and profits from State-owned enterprises. Taxation was both evenly distributed and certain. It grew as the population increased and tended not to interfere in market incentives or necessarily restrict economic activity. In addition, the characteristics of SA's public revenue was deemed by the LMM as excellent collateral as reflected in the declining course of interest rates (shown in Chart 4) and helped to support the government's borrowing commitments as explained in the previous section.
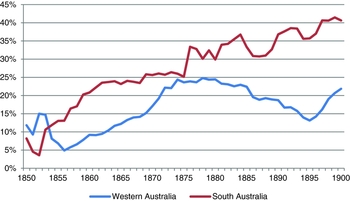
The slow pace of economic development in WA also impeded the reach of religion.Footnote 6 For example, the number of churches per 1,000 of population, named church penetration, shows a lead-lag pattern as the population ebbed and flowed and the level of state aid fluctuated. In contrast, church penetration throughout SA was considerable with the data showing approximately three churches to every 1,000 residents across the century. This stable trend tended to create denser social networks (Granovetter, Reference Granovetter2005). An important benefit stemming from religion in the early colonial period was the provision of education. In WA, however, State aid for religion was very much a part of the cultural fabric until 1895 and, because there was little competition for congregatory contributions, there was little incentive for denominations to offer services such as Sunday school, improved teaching standards or a modern curriculum. School enrolments in WA were around 10 per cent of the population at 1850, they rose to about 25 per cent by the 1880s before falling sharply shortly afterwards as gold-rush immigration of swamped the population growth figure (Chart 6). By the end of the century, enrolments were almost back at 25 per cent of the population.
Percentage of population receiving education, 1850–1900.

In SA by comparison, the early abolition of State aid forced denominations to offer value-adding services such as education for the children of churchgoers in order to boost patronage. From 1850 to 1900, the trend in school enrolment (as shown in Chart 6) generally rose from about 5 to a little shy of 40 per cent; education spending was higher and the cost of public education was lower in SA than it was in WA. In some ways, ‘systematic colonisation’, and the ideals of its sponsors, appeared to have achieved a competitive market in religion, as championed by Smith (Reference Smith and Cannan1976).
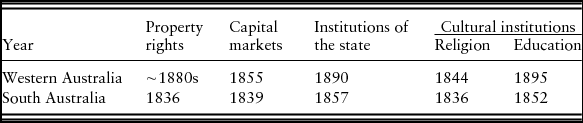
Our discussion emphasises the need for an institutional matrix and for each constituent part to be in place for sustained economic development to occur. Table 3 shows broadly when the four key institutions for each colony came together in the 19th century. For property rights, the table depicts the dates when cash (and its equivalents) became the principal means of acquiring land in each colony, as opposed to free grants (labelled Property Rights). This is an important step in the formation of a growth-enhancing institutional matrix because, as noted above, sales of land result in security of tenure through common law protection and funded the conveyance of labour to the colony. Security of ownership enables land to become a tradable commodity (unlike the grants) and this encourages the possessors of land to maximise its value. In other words, land sales create stronger property rights. In WA, the grants associated with the settlement of the colony effectively ended in 1834 (whereby sales replaced grants). However, other grants, including those in lieu of salary to military personnel and to other interested parties, continued until 1880 (according to the blue books). It is difficult to determine exactly when grants ceased to form part of the property rights mix in WA but it seems likely to have occurred post-1880 and before Federation. In SA, on the other hand, land could only be acquired by the payment of cash from the date of the colony's foundation. As noted earlier, this was an important spur to its economic development.
Key dates of the colonial institutional matrices

In terms of Capital Markets, Table 3 marks the dates when at least two banks had been established in the respective colonies. This is significant because competition for deposits and loans encourages banks to find ways of reducing information asymmetry and transaction costs (i.e. interest rate spread). In WA, this occurred in 1855 but the commercial rate of interest remained stubbornly high for the remainder of the century as banks struggled to cope with the information asymmetry caused by a dispersed population. In SA, two banks began competing from 1839 with commercial lending rates declining steadily, and the spread between government and non-government borrower narrowing significantly, over the course of the 19th century.
The dates in Table 3 also show that State-based institutions became growth promoting when colonial governments achieved legislative independence from Britain. In WA, this did not occur until 1890, whereas it was achieved in 1857 in SA. An alternative position could be the year when the colonial governments borrowed on the LMM to fund local infrastructure. In WA, this occurred in 1872 and for SA it was 1855. Access to the LMM was available when the colony could meet the cost of its administration from local revenue. By either measure SA benefitted economically before WA.
Finally, the dates relating to culture in Table 3 show when religious and denominational educational institutions ceased being recipients of state support. The removal of these barriers is indicative of a maturing cultural environment. In WA, state aid ceased in 1844 (15 years after foundation) whereas it was 1836 in SA (upon foundation). In SA, denominational schools functioned without government subsidy from 1862, whilst this did not occur in WA until 1895. There are other institutional alternatives for education. One could be when children of the appropriate age were required to attend school for a mandatory number of days, 1871 in WA against 1875 in SA. Another view could be that education, as an institution, possesses a tertiary sector (i.e. a university or some other form of post-secondary training). On this measure, WA did not achieve this level until 1909 whereas SA achieved it in 1874.
There was rarely a sharp disruption to mark the transition from the period with an institutional barrier to a period when it was removed because history flows in a continuous stream. Changing the institutional structure is, however, associated with antecedent causes. The pressure for change may come from the awareness that certain gains from trade are going unrealised under the ex-ante institutional structure. There may also be a transfer of knowledge or some learning about economic opportunities occurring in neighbouring locations that spark a change. WA's adoption of SA's technical innovation in crop harvesting is an example of this type of transfer (Fitzpatrick, Reference Fitzpatrick1949). Following such an event is a period of ex-post facto transitioning from the old to the new institutional environment, in which the change is ‘bedded down’ and becomes operational. From this time, the effects of institutional change become realisable (and detectable), for better or worse. In WA's case, its institutional matrix finally became growth enhancing around 1890 with self-government and public debt extending the colony's transport and communications network, connecting its most productive yet remote areas to its markets.
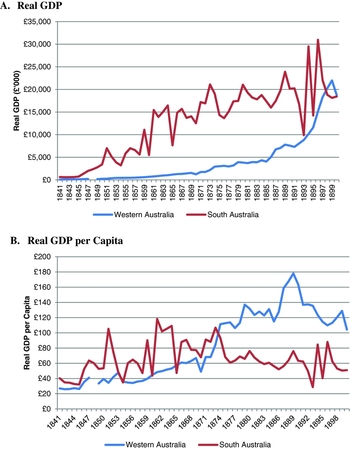
The evidence for economic performance is given by Real GDP in Chart 7A. This shows SA leaping from the blocks only to be caught up by the dogged WA by the end of 1900: the tortoise and the hare. This is the story of real growth in WA, which began with the discovery of substantial gold but growth really expanded after 1890 once responsible government was granted, the last piece of the institutional puzzle. Indeed as Paltseva and Roine (Reference Paltseva and Roine2011) show, a strong institutional setting is a pre-condition for exploiting natural resources in a manner that increases the size of the economy. SA's economy appears far larger than WA's, by a factor of 7 in 1875, and this strong growth began during the mid-1840s, not 10 years after the colony's settlement. The graph of SA's Real GDP in Chart 7A exhibits considerable variation particularly from 1861 onwards. This could be due to economic phenomena, such as an increase in global market integration, (i.e. shipping tonnage, telegraph transmissions, letter and newspaper distribution, etc.) or measurement errors in original data, or a combination of both. This disparity in size between the two economies began to narrow quite rapidly by around 1890 after a severe contraction in SA due to the contagion effects from the Victorian real estate crisis. The economy of WA was not contaminated by the economic slump in the eastern colonies (due to a distinct lack of inter connectedness) as mining became its principal industry, and by 1895 it temporarily became the larger of the two economies.
Estimates of economic performance, 1841–1900.

A per capita GDP measure of economic performance is useful for comparisons of developed economies with stable populations. Applied here to two colonies with unstable populations, the measure seems to show the tortoise overtaking the hare to win the economic race much earlier in the century than first thought. The data in Chart 7B suggests that SA's superior economic performance was recorded only for the years up until 1871 after which WA gains the lead. Indeed, judging from the Chart 7B, WA per capita GDP grew at a log-difference average of 2.33 per cent per annum and exceeded SA's during the mid-1870s. However, WA struggled to match the rate of population growth in the way the other Australian colonies prior to the late 1880s after which its significant resource base was ‘discovered’ and large-scale immigration commenced in response. The slow growth in population prior to the late 1880s tended to inflate per capita GDP and, as such, the data in Chart 7B is not a strong indication of the relative economic performance of the two colonies. As noted earlier, all other indicators of economic performance reveal the slow pace of the development of the WA colony through to the latter part of the 19th century.
6. Conclusion
As Douglass North emphasised, institutions offer incentives and deterrents to engage in economic activity; they promote material prosperity and they can take it away; they can be relevant to society or they can hold back its progress; and with the correct cultivation, institutions can command public loyalty but with neglect they can exert the most corrosive and insidious effects on social cohesiveness.
The evidence assembled in this article show that WA's institutions were poorly designed from foundation and were slow to react to changing economic circumstances. As a consequence, the colony was a late adopter of technology, was not a noted innovator and suffered high costs of capital. In contrast, by adopting Wakefield's programme of systematic colonisation, SA attracted a large number of migrants; achieved a relatively high population density (which reduced transaction costs); achieved a masculinity ratio of close to unity (which facilitated population growth); had dense social networks and was a noted innovator. Its institutional matrix contributed to a strong economic performance built on the back of crop and livestock farming, throughout most of the 19th century, whilst WA's economic lagged until the last decades of the century.
The evidence also demonstrates that mode of colonisation adopted for the two colonies had long-term, dynamic effects on their economic development. The colonisation method affected both the nature of each colony's original institutional matrix and also its ability to adapt to changing external conditions. As such, the experience of colonial WA and SA convey important lessons for the study of institutional transfer, namely that it is important to examine whether economies have inherited appropriate institutions that allow them to grow, and also whether they possess flexible institutions to change and adapt at relatively low-cost when the need arises (Mokyr, Reference Mokyr2009: 414). A defective land tenure system, a barter economy, a relatively autocratic government and a small, dispersed and relatively educated population hamstrung WA's economic development. Consequently, when institutional change occurred, the colony was playing catch-up, to correct deviations originating in the poorly conceived approach to colonisation. Wakefield's programme of systematic colonisation, on the other hand, bequeathed SA a compact middle class, and an educated and non-conformist population that went onto introduce many progressive institutional innovations such as the Torrens Title, widely adopted across British Commonwealth countries (Hogg, Reference Hogg1920) and in some states of the US, and the granting of female suffrage (the first Australian colony to do so).
As a final comment, the ‘institutional’ explanation of the different economic performances of colonial WA and SA presented in this paper contrast the accounts available in traditional studies, which are fixed firmly on differences in natural resources. Whilst the two colonies did have different resource endowments, it is difficult to identify how this contributed to SA's rapid rate of agricultural development in the 19th century against WA. For example, the available meteorological data for each colony shows that, if anything, the climate was more favourable in Perth in rainfall terms than Adelaide, and WA had larger bodies of water, although the share of land available for agriculture and livestock grazing was larger in SA. There is a stronger case for an argument that geographical factors were important in explaining the different pace of mining development in the two colonies. WA faced large obstacles due to the distances from its gold mines and ports and the lack of water at the mines. However, by the time of the gold discoveries of the 1890s, WA's institutional matrix had come together thereby enabling the colony to overcome many constraints on its development to take advantage of these newly discovered resources. In the preceding years, as the evidence in this paper has shown, WA's ability to exploit its resource base in agriculture was hampered by a deficient institutional matrix and it lagged behind its neighbour, SA, by a considerable margin. That is, its institutions mattered. And they mattered to both colonies.