I. INTRODUCTION
In recent years, 316L stainless steel is a widely used engineering material in environments such as petrochemical, chemical, nuclear, and food industries due to its excellent corrosion resistance and its biocompatibility. However, structural application of this material with a coarse grained state is limited by its relatively low mechanical strength and poor abrasion resistance properties. Reference Lacombe, Baroux and Beranger1 It is well known that nanocrystalline materials have attracted considerable scientific interest due to their superior mechanical properties (hardness, strength, and wear resistance) different from conventional coarse-grained polycrystalline counterparts. This is consistent with the classical Hall–Petch relationship Reference Hall2,Reference Petch3 that the refinement of the grain size can improve the mechanical strength. Therefore, a reasonable approach to enhance the mechanical strength of the 316L stainless steel is refinement of its grain size by the recently developed severe plastic deformation (SPD) Reference Valiev, Islamgaliev and Alexandrov4–Reference Song, Kim and Kim6 technique.
To date, many methods based on SPD have been developed, such as high pressure torsion (HPT), Reference Radiguet, Etienne, Pareige, Sauvage and Valiev7–Reference Valiev, Sergueeva and Mukherjee11 equal channel angular pressing, Reference Balyanov, Kutnyakova, Amirkhanova, Stolyarov, Valiev, Liao, Zhao, Jiang, Xu, Lowe and Zhu12–Reference Kim19 surface mechanical attrition treatment (SMAT), Reference Li, Wang, Zhang and Shen20–Reference Wang, Lu and Lu23 and fast multiple rotation rolling (FMRR), Reference Chui, Sun, Sun, Yang and Shan24 to refine the grain to nanometer size to improve the properties of materials. According to the study of Chen et al., Reference Chen, Lu, Lu and Lu25 a nanocrystalline 316L stainless steel was prepared by SMAT, and the nanocrystalline 316L sample exhibits a yield strength as high as 1450 MPa. But we should notice that the outstanding property of the nanocrystalline sample depends on its thermal stability. In addition, the thermal stability of the nanostructured materials has been studied in different works, Reference Valiev, Islamgaliev and Alexandrov4,Reference Tong, Han, Wang, Lu and Lu26 but it is lacking to deal with 316L stainless steel with the nanostructured surface layer prepared by FMRR. So it is essential and meaningful to study the thermal stability of the nanocrystalline layer.
In this paper, a nanostructured layer was obtained on the surface of 316L stainless steel by means of FMRR. The thermal stability was investigated in detail at different temperatures.
II. EXPERIMENTAL PROCEDURE
A commercial 316L stainless steel plate (200 mm × 100 mm × 8 mm) was selected as a sample material. The chemical composition of the steel is (wt%): C 0.019, Cr 17.07, Ni 11.95, Mo 2.04, Mn 1.68, Si 0.35, Cu 1.14, S 0.07, and balance Fe. The plate sample was subjected to FMRR, and the set-up and procedure have been described previously. Reference Chui, Sun, Sun, Yang and Shan24 In the FMRR, in the present work, under a static pressure of P, an array of rotational tool tips can fastly rotate and roll on a sample surface at a rotational speed of ω. The sample being treated moves steadily at a linear velocity of υ in one of the horizontal directions back and forth, thus a full surface treatment can be completed. To test the thermal stability of the nanostructured surface layer of 316L stainless steel, the samples after FMRR treatment were annealed at 300, 400, 500, and 600 °C for 60 min in a tube furnace in a hydrogen atmosphere.
The microstructure of the surface layer on the FMRR and annealed samples was characterized by transmission electron microscopy (TEM) on a JEOL JEM-2100 (Tokyo, Japan). The TEM sample was obtained by several procedures: cutting, mechanical polish, dimpling, and ion thinning from one side. X-ray diffraction (XRD) analysis was performed with Cu Kα radiation in a Rigaku D/max-2500 x-ray diffractometer (Tokyo, Japan) and at a 2θ scanning rate of 4°/min to check the phase constituent on the surface layer.
Additionally, the Vickers microhardness of the samples was measured by a DHV-1000 microhardmeter (Shenzhen, China) with an applied load of 0.49 N for 10 s.
III. RESULTS AND DISCUSSION
A. Microstructure characterization of surface
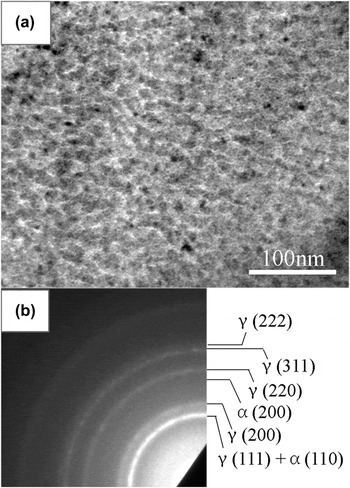
As shown in Fig. 1, it is a TEM bright field image and the corresponding selected area electron diffraction (SAED) pattern obtained from the top surface of 316L stainless steel after FMRR treatment for 60 min. The FMRR treated sample exhibits an equiaxed microstructure with the average grain size about 12 nm. The SAED pattern is composed of continuous and concentric rings, indicating that the grains have been refined to nanoscale with different crystallographic directions. In addition to rings of the austenitic structure, additional rings of the α-martensite structure are visible. This is also confirmed by XRD.
TEM bright field image (a) and corresponding SAED pattern (b) of the top surface layer of FMRR sample.

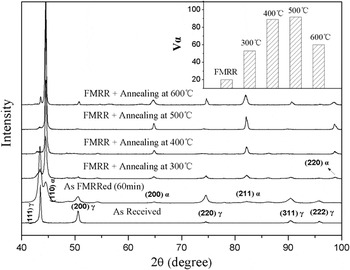
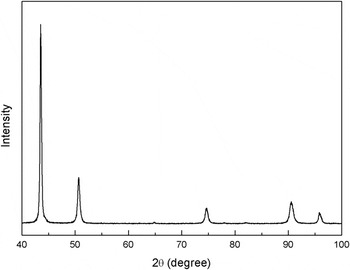
Figure 2 shows XRD patterns of the samples before and after FMRR treatment and in the as-annealed state. The inset shows the volume fraction of α-martensite (V α) calculated at different annealing temperatures. It can be found that the as-received sample consists of austenitic, while the FMRR one contains both the γ austenitic and the α-martensite phase. This illustrates that FMRR treatment could form deformation-induced α-martensite on the surface layer of 316L stainless steel. It has to be noted that the strain-induced martensitic transformation has been well investigated in stainless steels. Reference Tsakiris and Edmonds27–Reference Rajanna, Pathiraj and Kolster29 Comparing the diffraction peaks of both samples before and after FMRR treatment, it can be distinctly observed that the diffraction peaks for the FMRR specimen are much broader than those of the as-received specimen. In general, the broadening of the diffraction peaks is a combined result of grain refinement, microstrain, and instrument error. Here, instrument error-induced peak broadening can be ignored, since all patterns were obtained by using the same x-ray diffractometer. Hence, broader diffraction peaks of the FMRR specimen can be attributed to the effects of grain refinement and microstrain.
XRD patterns of the as-received sample and the FMRR sample and the annealed samples subjected to FMRR. Inset is the volume fraction of martensite (α, martensite; γ, austenite).

Additionally, with an increase in annealing temperature from 300 to 500 °C, the peaks belonging to the α-martensite phase tend to increase, indicating a higher proportion of martensite. However, the intensity of the austenitic and the α-martensitic peaks changes after annealing at 600 °C for 1 h. The stainless steel only contains both of austenite and α-martensite. Therefore, the volume fraction of α-martensite was calculated from the following equation Reference Fultz and Howe30 :
 $${V_{\rm{\alpha }}} = 1 - {{0.65({I_{311{\rm{\gamma }}}} + {I_{220{\rm{\gamma }}}})} \over {{I_{211{\rm{\alpha }}}} + 0.65({I_{311{\rm{\gamma }}}} + {I_{220{\rm{\gamma }}}})}}\quad ,$$
where I represents the integrated intensity for reflecting plane. Using the (211) reflection for α-martensite, V α was determined to be about 20% just after FMRR treatment and it reached a maximum value of 92% after annealing at 500 °C. When the annealing temperature increases to 600 °C, the α-martensite content no more increases. Instead, the fraction of α-martensite is reduced to about 60%.
B. Thermal stability
The thermal stability is an important issue for structural applications. To investigate the thermal stability, the 316L stainless steel samples subjected to FMRR were annealed from 300 to 600 °C for 60 min.
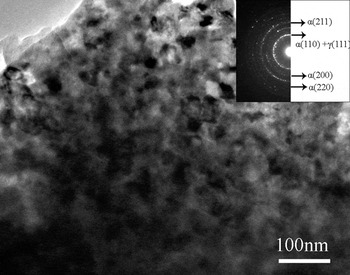
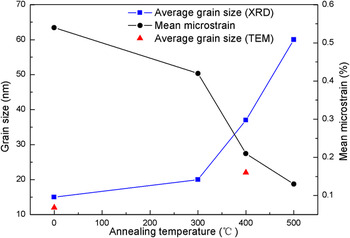
Figure 3 shows a TEM bright field image and the corresponding SAED pattern obtained from the top surface of the annealing sample at 400 °C after FMRR treatment. Equiaxed grains can be still clearly seen in the annealing sample. Although the grain size increases, it is still nanocrystalline and the average grain size is only about 22 nm. It exhibits a high thermal stability. From the SEAD pattern, it can be observed that the phase constituent is mainly α-martensite. This is consistent with the results of XRD analysis in Fig. 2. According to the Scherrer and Wilson equation, Reference Klug and Alexander31 the grain size and mean microstrain on the surface layer of samples are calculated by using a XRD Pattern Processing and Quantification Program referred to as Jade 5 developed by MDI materials Data Inc. Variation of the average grain size (derived from XRD and TEM) and mean microstrain with the annealing temperature are shown in Fig. 4. An evident increase in grain size during annealing is noticed, from 15 nm in the FMRR treated sample to about 60 nm at 500 °C. Meanwhile, the mean microstrain decreases with the increase in annealing temperature, which can be attributed to a stress relaxation. Reference Fultz and Howe30 The reduction of microstrain and growth of grains can be used to explain the decrease of full width at half maximum of the peaks with the increase in annealing temperature. It is noticed that the grain size determined from TEM observation is a little smaller than that from the XRD calculation. This might originate from the fact that XRD analysis averages the structure information of a surface layer of about 5 μm, while the TEM sample is a very thin film (less than 1 μm thick) at the sample surface. Reference Wang, Yu and Dong32
TEM bright field image and the corresponding SAED pattern of the annealed sample at 400 °C after FMRR treatment.

Variations of the average grain size and mean microstrain of the surface layer determined by the mean of XRD analysis with the annealing temperature.

According to XRD results, the volume fraction of α-martensite markedly increases with the increase in annealing temperature (below 600 °C). Especially annealing at 500 °C, the martensite content reaches a maximum value of 92%. An analogous increase in α-martensite phase was observed for the annealed nanocrystalline stainless steel and ultrafine-grained austenite steel synthesized by SMAT Reference Roland, Retraint, Lu and Lu33 and HPT Reference Etienne, Radiguet, Genevois, Le Breton, Valiev and Pareige34 , respectively. Martensite was not produced during annealing for the original sample as shown in Fig. 5. Hence, the increase in α-martensite phase should depend on the microstructure of samples. The difference in both original and FMRR samples is the nanostructure and microstrain, which may affect the variation of martensite content in the process of annealing. The volume of fraction of α-martensite significantly increases in the FMRR treated sample from 20% to 53% at 300 °C, while the grain size only slightly increases from 15 to 20 nm (derived from XRD analysis). So, the nanostructure has little or no effect on the increment of martensite content. However, the microstrain evidently decreases in the process of annealing. Therefore, the stress relaxation may induce the martensite transformation, leading to the increment of martensite content. The detail mechanism still needs to be investigated deeply. With further increase in annealing temperature, the amount of α-martensite begins to reduce from 92% to 60%, which can be ascribed to the reversion transformation from martensite to austenite under thermal treatment. This reversion transformation has already been abundantly investigated in Refs. Reference Zhang, Jing, Lou, Shen and Cui35 and Reference Di Schino, Salvatori and Kenny36, and it can be explained by the diffusion mechanism or shear mechanism.
XRD pattern of the as-received sample after annealing at 500 °C.

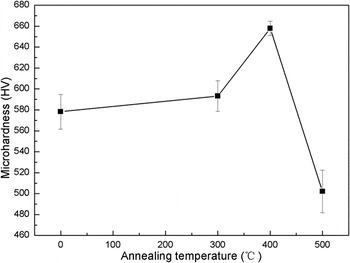
To further determine the thermal stability of the nanocrystalline layer, the microhardness was also measured on the top surface layer after various annealing treatments. Figure 6 shows the curve of microhardness of the top surface layer with the annealing temperature. The microhardness of original sample is about 160 HV. After FMRR treatment, the value of hardness increases to 578 HV, which is more than three times higher than that of the original sample. It can be attributed to grain refinement, α-martensite transformation, and work-hardening. Annealing at 300 °C, the microhardness slightly increases, and it reaches a maximum value as the temperature increases to 400 °C. However, the hardness decreases significantly with a further increase in annealing temperature. The variation of microhardness can be explained as follows. As shown in Fig. 4, the increase in grain size and the stress relaxation always occur during the annealing. They have a negative influence on the hardness. On the other hand, the volume fraction of α-martensite increases markedly with the increase in annealing temperature from 300 to 500 °C, which can improve the microhardness. Therefore, the increase in microhardness from 300 to 400 °C results from the dominance of transformation since its content significantly increases from 20% to 89%. At 500 °C annealing, the stress relaxation has finished and the grain size increases to 60 nm. At the same time, the amount of α-martensite only slightly increases. Hence, the influence of stress relaxation and grain growth on hardness is much greater than that of α-martensite increment. So, both factors result in not only remarkable reduction in the value of hardness but also lower than that of the FMRR sample without annealing. In spite of this, the annealing sample at 500 °C is three times as hard as the original sample.
Curve of microhardness of the top surface layer with the annealing temperature.

IV. CONCLUSION
A nanocrystalline surface layer has been successfully fabricated in 316L stainless steel by FMRR. The average grain size of surface layer is refined to about 12 nm. At the same time, deformation-induced α-martensite transformation occurs on the surface layer. The microhardness increases markedly from about 160 HV for original sample to about 578 HV for FMRR treatment sample, which can be explained by grain refinement, α-martensite transformation, and work-hardening. After annealing treatment, the average grain size increases gradually from 20 nm at 300 °C to 60 nm at 500 °C. The nanostructure induced by FMRR exhibits a high thermal stability. On the other hand, the volume fraction of α-martensite increases greatly with the increase in annealing temperature from 300 to 500 °C, and it begins to reduce at 600 °C due to the reversion transformation from martensite to austenite. The microhardness increases first and reduces afterward from 300 to 500 °C, which reaches a maximum value of about 660 HV at 400 °C.
ACKNOWLEDGMENTS
This work was supported by the Natural Science Foundation of the People's Republic of China (no. 30870610, 30800221), China Postdoctoral Science Foundation (no. 200804401138), and Research Fund for Doctoral Program of Shaanxi University of Technology (no. SLGQD13 (2)-14).