1. Introduction
There is a large body of research that demonstrates that distributional vectors are a powerful tool for modeling word similarity (Turney et al. Reference Turney and Pantel2010; Erk Reference Erk2012; Clark Reference Clark2015). For many tasks, the knowledge of word similarity alone is all that is needed; other tasks require some form of “grounding,” a mapping from textual distributions to some other representation, such as a visual vector (Feng and Lapata Reference Feng and Lapata2010; Bruni et al. Reference Bruni, Boleda, Baroni and Tran2012; Lazaridou, Bruni, and Baroni Reference Lazaridou, Bruni and Baroni2014) or a distribution over geographic locations (Wing and Baldridge Reference Wing and Baldridge2011). In cognitive science, word vectors are mapped to semantic primitives to explore perception of concepts. Through studying patients with category-specific deficits, several cognitive scientists have proposed that people mentally represent concepts as a collection of semantic primitives or feature norms (Tyler et al. Reference Tyler, Moss, Durrant-Peatfield and Levy2000; Randall et al. Reference Randall, Moss, Rodd, Greer and Tyler2004). As word vectors are connected with word usage, researchers have mapped word vectors to these primitives to explore the connection between usage and concept (Johns and Jones Reference Johns and Jones2012). Other research has explored mappings between word vectors and different kinds of semantic primitives (or properties) to explore what information is conveyed through word use (Johns and Jones Reference Johns and Jones2012; Rubinstein et al. Reference Rubinstein, Levi, Schwartz and Rappoport2015; Herbelot and Vecchi Reference Herbelot and Vecchi2015; Fagarasan, Vecchi, and Clark Reference Fagarasan, Vecchi and Clark2015; Gupta et al. Reference Gupta, Boleda, Baroni and Padó2015).
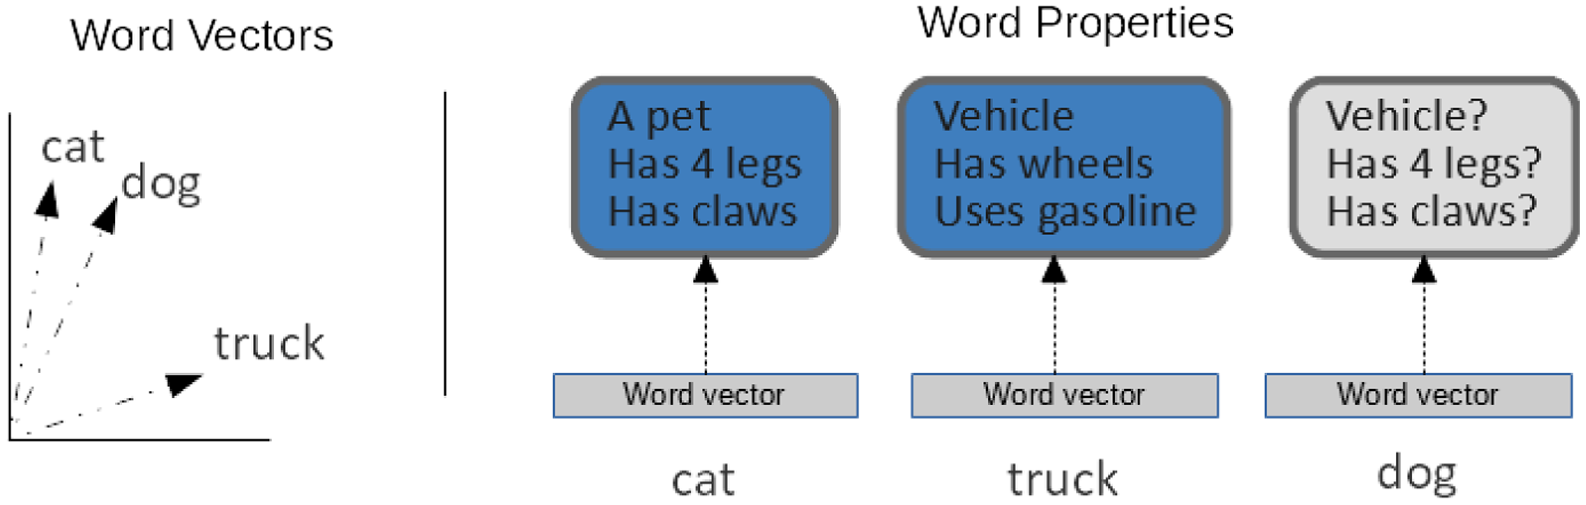
We focus on the latter kind of mapping: the task of property inference, the prediction of properties for a word based on its distributional vector. In other words, connecting word usage (via word vectors) to real-world characteristics. We present a toy example of this task in Figure 1. In this example, we try to predict the properties of the word dog using what we know about the words cat and truck. We associate various cat properties to the word cat, for example, is a pet, has four legs, has claws, etc. We analogously associate various truck properties to the word truck. For the word dog, we look to similarity in usage (where usage is modeled as a word vector) to predict its properties. As the word dog is used much more similarly to the word cat than the word truck, we infer that dog must have more cat-like properties, for example, is a pet, has claws, is an animal, meows, etc., than truck-like properties.
Property inference toy example.

Property inference has mainly been addressed with the aim of better understanding the linguistic information that distributional vectors contain. For example, do word vectors reflect taxonomic properties of the word? Social significance of the word? Physical properties of the object represented by the word? Rubinstein et al. (Reference Rubinstein, Levi, Schwartz and Rappoport2015) used property inference to examine if distributional vectors express more taxonomic or attributive properties. Herbelot and Vecchi (Reference Herbelot and Vecchi2015, Reference Herbelot and Vecchi2016) used this task to analyze how well distributional vectors capture the proportion of category members to which properties apply. Făgărăsan et al. (2015) explored how well distributional vectors reflect definitional conceptual properties. Gupta et al. (Reference Gupta, Boleda, Baroni and Padó2015) explored how well distributional vectors reflect geographic and demographic properties. While we explore properties as a way to extract insight from word vectors, other research explores generating definitions of a word from its word vector as an alternative way to describe the semantic content of a word (Noraset et al. Reference Noraset, Liang, Birnbaum and Downey2017).
Beyond an exploration of the characteristics of distributional models, property inference can in principle be useful to many tasks within computational linguistics. Inferred properties can provide partial meaning information for unknown words, and it can assist in information extraction by allowing a better description of entities through their properties.
But if we want to use property inference as a basis for further inference tasks, it is important to know which methods perform best on what kind of data. However, the existing papers mentioned above use completely different property inference methods with no comparison between them. They also use different property collections.
In this paper, we perform the first systematic comparison of existing approaches to property inference. We introduce the use of label propagation for the task, which is a semi-supervised machine learning approach that infers the target value of an input by aggregating the target values of similar inputs. We show that it is well suited for the task and that achieves state-of-the-art performance. We further propose modifications of existing methods that are based on known characteristics of distributional models and that we find to improve performance.
We also introduce two new property datasets to the property inference task. Most property inference research has tried to predict properties that are salient to humans as definitional properties of objects. We expand the scope of the task by introducing two new datasets, one that has properties encoding social categories and one that focuses on hypernyms as properties. By analyzing a variety of property datasets, we explore the effect of differences in property datasets on model performance.
The results of our work can be used for several downstream tasks. One downstream task is to make machine learning models more interpretable. We live in a day and age where accurate machine learning models are readily available and are entrenched in our daily life. Companies use machine learning models to interact with customers, analyze documents, and gauge public reaction. However, these models often do not provide explanations for their predictions. This could be problematic as it is important to understand why a model rejected a loan application or why a model determined that public reaction was negative. Our work can be used to provide such justification by translating hidden layers and other components of machine learning models into sets of human-interpretable properties.
Our work can also be used to better generate embeddings that capture semantic qualities. Turton, Vinson, and Smith (Reference Turton, Vinson and Smith2020) use property inference methods to predict properties from word embeddings and then use these predicted properties as a new embedding representation. By incorporating stronger property inference methods, we can produce embeddings that better capture semantic qualities. These embeddings can then be used to make strides in other tasks, such as lexical entailment (Vulić and Mrkšić 2017).
Finally, our work can help cognitive scientists generate sets of feature norms. Feature norms are widely used by cognitive scientists to model cognitive processes (such as word-picture interference Vieth, McMahon and de Zubicaray Reference Vieth, McMahon and de Zubicaray2014 and recognition memory Montefinese, Zannino and Ambrosini Reference Montefinese, Zannino and Ambrosini2015) as well as study neurological disorders like aphasia (Vinson and Vigliocco Reference Vinson and Vigliocco2002; Vinson et al. Reference Vinson, Vigliocco, Cappa and Siri2003). However, feature norms are difficult to generate as they require eliciting information from participants and then normalizing this information. Our work can be used to expand feature norm datasets.
2. Related work
We focus on property inference based on manually constructed resources that link conceptsFootnote a to their properties. Like previous work, we focus on weighted binary properties: each property either does or does not apply (like “an animal” or “is green”), but it is associated with a value that indicates its importance to the concept. We make this more concrete later when we introduce the property datasets.
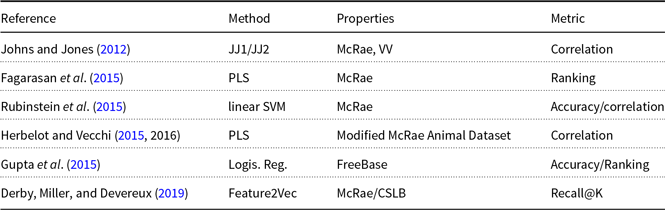
We study approaches that learn a mapping from distributional representations to property values and then use this mapping to infer properties for concepts that have distributional representations but no known properties. As we describe next, existing work on property inference has used a wide variety of methods. Table 1 provides a brief description of these methods. But there has been no comparison across them. In this paper, we explore which methods work best in this task, and under what circumstances.
Reference table for previous work. “Properties” are the property datasets used. “Metrics” are the quantitative approach used to evaluate the results. “Correlation” refers to correlating gold values with predicted values (using either Pearson correlation or Spearman’s
 $\rho$
). “Accuracy” refers to treating property inference as a binary classification task (using either F1 or accuracy). “Ranking” refers to using a ranking metric like MAP or normalized rank score

The oldest and simplest method that we explore is that of Johns and Jones (Reference Johns and Jones2012). Their goal was to formally model the psychological process of how a person can learn word meaning from context. Their model is based on Hintzman (Reference Hintzman1986, Reference Hintzman1988), who posits that people learn word meaning by transferring properties from familiar words to unfamiliar words that fit the same contexts.
Johns and Jones’ model predicts the value of a property for a novel concept simply as a weighted sum of values that familiar concepts have for this property, weighted by the distributional similarity of each familiar concept to the novel one. Let F be a set of familiar concepts, and e a novel concept. For property q and concept
 $c \in F$
, let
 $v_q(c)$
be the value of property q for concept c and let
 $\vec{c}$
be the distributional vector for c. Then the predicted value of q for e,
 $v_q(e)$
, is
 \begin{equation*}\displaystyle v_q(e) = \sum_{c \in F} v_q(c) \cos(\vec{c}, \vec{e} )^{\lambda_1}\end{equation*}
where
 $\lambda_1$
is a hyperparameter. A large value of
 $\lambda_1$
means that the influence of less similar concepts c is largely ignored. We call this method JJ1 for one-step Johns and Jones. They also propose a two-step version of their method (JJ2) that first extends property annotation to a large set U of un-annotated concepts using JJ1, then predicts the value of a property q for the novel concept e from similarity to concepts in both F and U:
 \begin{align*}v_q(e) &= \sum_{c \in F} v_q(c) \cos(\vec{c}, \vec{e} )^{\lambda_2} + \sum_{u \in U} v_q(u) \cos(\vec{u}, \vec{e} )^{\lambda_2}\end{align*}
where
 $\lambda_2$
is the hyperparameter for the second step.
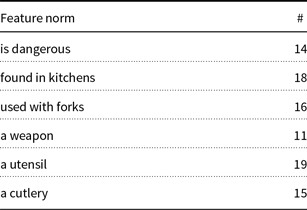
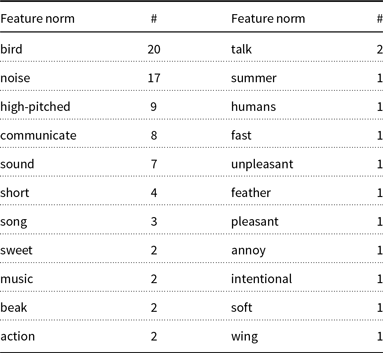
The property datasets that Johns and Jones used were two feature norm datasets, one by McRae et al. (Reference McRae, Cree, Seidenberg and McNorgan2005) and one by Vinson and Vigliocco (Reference Vinson and Vigliocco2008). Feature norms are definitional features elicited from human participants. As we also use these datasets below, we look at them in some more detail. The McRae et al. feature norms focus on concepts for concrete objects. Vinson and Vigliocco additionally have concepts for nominal and verbal forms of events. Examples of the McRae et al. and Vinson–Vigliocco feature norms are in Tables 2 and 3.
McRae et al. feature norms for the concept knife. # is the number of participants out of 30 who responded that knife had that feature norm

Vinson–Vigliocco feature norms for the verb chirp. # is the number of participants out of 30 who responded that the verb chirp had that feature norm

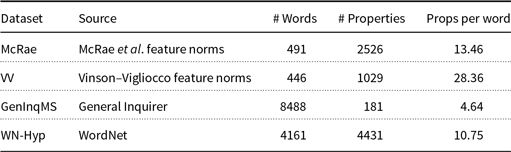
Dataset statistics for the property datasets. “# Words” is the number of words in the datasets. “# Properties” is the number of unique properties in the dataset. “Props per words” is the average number of properties per word

While the motivation for Johns and Jones was to explain human concept learning, the remaining approaches come from computational linguistics. Făgărăsan et al. (2015) mapped a distributional vector to a feature norm vector using partial least squares regression (PLS). PLS is useful when there is a high degree of correlation between predictor variables (here, dimensions of distributional vectors) and between response variables (here, properties). PLS projects the predictor variables and the response variables to a new space in a way that takes into account the relations between the two sets of variables (Ng Reference Ng2013). PLS is trained on a predictor matrix X and a response matrix Y. The two matrices are decomposed into
 $X = TP^\intercal$
and
 $Y = UQ^\intercal$
such that the covariance between T and U is maximized. P and Q are orthogonal. Linear regression is performed from T to U to find a
 $\beta$
such that
 $U = T \beta$
. The resulting model can then be used to predict the property vector f(x) for a distributional vector x using
 $f(x) = xP\beta Q^\intercal$
.
Evaluating on the McRae et al. feature norms, Făgărăsan et al. found that a two-word window space with positive pointwise mutual information (PPMI) and singular value decomposition (SVD) dimensionality reduction performed best under a mean average precision (MAP) evaluation.
Rubinstein et al. (Reference Rubinstein, Levi, Schwartz and Rappoport2015) used property inference to determine if word vectors reflect more taxonomic or attributive properties. They used linear support-vector machine (SVM) classification and regression to predict a small subset of the McRae et al. feature norms from word vectors. Like SVM classification, SVM regression maps the data into a kernel-induced space (Drucker et al. Reference Drucker, Burges, Kaufman, Smola and Vapnik1996). It then performs linear regression in that space. Also, like SVM classification, SVM regression depends only on a subset of the training data, as it ignores training data that is close to the prediction.
SVM regression learns a function
 $g: \mathbf{R}^n \to \mathbf{R}^n$
with training data
 $(x_1, y_1), \dots, (x_n, y_n)$
that is a linear function of the similarities between x and the training points
 $x_i$
(modeled by a kernel function
 $K(x,x_i)$
). It has the form:
 \begin{equation*}g(x) = \displaystyle \sum_{i=1}^N a_i K(x, x_i) + b\end{equation*}
The
 $a_i$
represent the contribution of sample i in the predicted property value. The b is a constant expressing bias. Learning of the function g is constrained by a hyperparameter
 $\epsilon$
that governs how far the predicted
 $g(x_i)$
is allowed to deviate from the gold
 $y_i$
. Learning of g is further constrained by the second hyperparameter, a regularization constant C that constrains the values that the
 $a_i$
are allowed to take on. Rubinstein et al. used a linear kernel in their experiments.
Herbelot and Vecchi (Reference Herbelot and Vecchi2015, 2016) used PLS on a variant of the McRae et al. feature norms where annotators rated how many members of a given concept have a given property. We note that they also incorporate an animal dataset (Herbelot Reference Herbelot2013), which maps 72 animal concepts to a fixed set of 54 properties. The goal is to create a dense property dataset where each concept has some value for each property. As our focus is on sparse properties, we do not explore this dataset in our analysis.
Gupta et al. (Reference Gupta, Boleda, Baroni and Padó2015) used logistic regression to learn referential properties, such as longitude and latitude, of cities and countries from distributional vector representations. The property dataset they use is derived from Freebase (Bollacker et al. Reference Bollacker, Evans, Paritosh, Sturge and Taylor2008), a former online database that contained structured information on entities (geolocation, member-of relations, etc.). Gupta et al.’s property dataset represents properties as either a numeric quantity, for example, Germany has the property “geolocation::latitude::52.52,” or as a categorical value, for example, Germany has the property “adjectival form::German.” Given that the nature of these properties are more akin to filling a slot rather than atomic features, we do not use this dataset in our task.
Derby et al.Footnote b Reference Derby, Miller and Devereux(2019) developed a property prediction method, Feature2Vec, based on property embeddings. Properties were embedded into a word vector space and comparison between a word vector and property embedding was used to predict if that word has that property. They evaluated their method on the McRae feature norms and the Centre for Speech, Language and the Brain concept property norms (Devereux et al. Reference Devereux, Tyler, Geertzen and Randall2014), which replicate and expand the McRae feature norms. For property prediction, the results for their model was in the same ballpark as PLS.
We should also mention another strand of research that aimed to learn properties from textual data but used patterns to extract properties directly; these methods have met somewhat mixed success (Almuhareb and Poesio Reference Almuhareb and Poesio2004; Devereux et al. Reference Devereux, Pilkington, Poibeau and Korhonen2009; Baroni and Lenci Reference Baroni and Lenci2010).
3. Properties
We chose four property datasets for our experiments that express different types of semantic information and have different characteristics. The first two are feature norm datasets (McRae et al. Reference McRae, Cree, Seidenberg and McNorgan2005 and Vinson and Vigliocco Reference Vinson and Vigliocco2008) that are small in size and are constructed from elicitation by subjects. The McRae feature norms capture semantic representations of concrete objects while the Vinson–Vigliocco feature norms explore the connections between objects and events. In particular, the Vinson–Vigliocco feature norms distinguish between concrete objects (e.g., a bear), nouns related to events (e.g., a growl), and verbs related to events (e.g., growling). The next one is derived from General Inquirer (GI) (Stone Reference Stone1997). This dataset contains a larger vocabulary and places words within a relatively small set of categories that captures sentiment and social significance information. Finally, we derive a property dataset from WordNet (Fellbaum Reference Fellbaum1998), which is also features a larger vocabulary, but the properties are derived from a large taxonomic hierarchy.
Two property datasets we explore are the McRae et al. feature normsFootnote
c
(McRae) and the Vinson–Vigliocco feature norms (VV). In line with previous research, we encode the properties of a word as a vector in
 $\mathbf{R}^n$
. For McRae and VV the encoding is as follows: For a property q, the property value for a concept c is the percentage of participants that said c has q. Properties that were not mentioned for a concept have a value of 0.
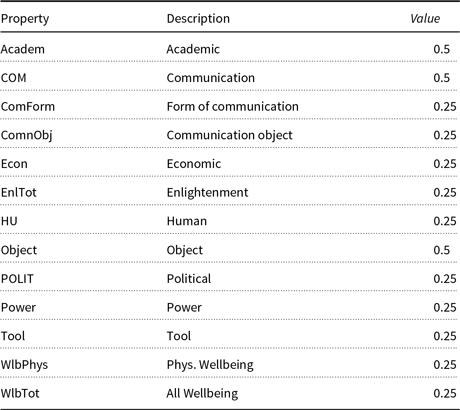
The other two datasets are new to the task. The first is constructed from GI (Stone Reference Stone1997). GI is a dataset historically used in sentiment analysis. In this dataset, part-of-speech tagged word senses are placed into categories that indicate sentiment and social significance, for example, there is a category for positive word senses and for word senses dealing with politics. We construct a property dataset that we call General Inquirer Mean Sense (GenInqMS) from GI as follows.Footnote d Each lemma–part-of-speech (POS) pair in GI has all of the properties of all of its senses. For example, “argue-v” will have the property “Ngtv” (negative words), because one of its senses in GI, ARGUE#1 (to have an argument), is in the Ngtv category. The property weight is the fraction of senses that have that property. For example, “argue-v” will have a property value of 0.5 for “Ngtv” as one of its two senses has that category (the other being ARGUE#2, which represents the “to present reasons” sense of argue). Table 5 shows an example.
Some of the GI property values for the noun board. Property is the GI category. Description is a description of what social aspect the category represents. Value is the fraction of noun word senses for board in GI that are in the category

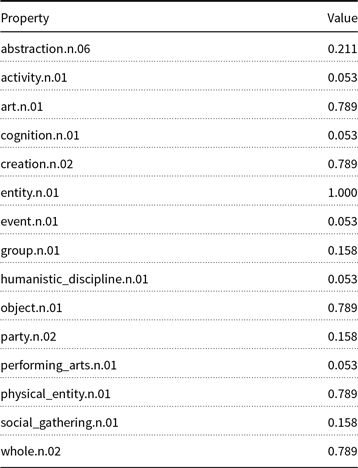
The second new dataset, WN-Hyp (for WordNet hypernyms), is derived from WordNet hypernymy relations. The concepts in this dataset are the noun and verb lemmas listed in WordNet (Fellbaum 1998), with part-of-speech tag attached. Due to the large number of lemmas and synsets in WordNet, we only use words that appear at least 800 times in the BNC as compiled by Kilgariff (1997). As properties, we use WordNet synsets. A property q will have a nonzero valueFootnote e for a lemma–POS pair w if q is a hypernym of a synset containing w. This includes non-direct hypernyms, for example, “fruit.n.01” is a property of “lime-n” even though “fruit.n.01” is not a direct hypernym of any synset containing the word lime. We weight properties by synset frequency in the Semcor corpus (Miller et al. Reference Miller, Leacock, Tengi and Bunker1993; Langone, Haskell, and Miller Reference Langone, Haskell and Miller2004), which is an English corpus where words are tagged with their WordNet synset. The value of q for w is the percentage of occurrences of w in SemCor whose synsets have q as a hypernym. Lemma–POS pairs that did not appear in SemCor were removed. Table 6 shows an example from WN-Hyp.
Some of the WN-Hyp property values for the noun dance. Property is a WordNet synset. Value is the fraction of occurrences of dance in SemCor that have this synset as a hypernym

WordNet is often used in hypernymy detection, which is a task related to property inference and has a large body of literature of its own, for example, Bernier-Colborne and Barriere (2018), Nickel and Kiela (Reference Nickel and Kiela2017), Pinter and Eisenstein (Reference Pinter and Eisenstein2018), Roller, Erk, and Boleda (Reference Roller, Erk and Boleda2014), and Ustalov et al. (Reference Ustalov, Arefyev, Biemann and Panchenko2017). Our focus is solely viewing WordNet synsets as taxonomic properties within an overall property prediction endeavor.
We note that the property values in GenInqMS and WN-Hyp should not be interpreted as the “importance” of the property to a given word, but rather the frequency of the property among all uses of the word. Like in distributional modeling, we consider the representation of a word to be a mixture of all its senses, that is, a mixture of properties relevant to all its senses. For WN-Hyp, the weight of a property reflects the relative frequency of the sense that the property goes with. For GenInqMS, we do not have corpus frequency information so we assumed equal frequency for all senses, but a property can still gain more weight if it is appropriate to multiple GI senses.
We perform an analysis of GenInqMS and WN-Hyp to evaluate their quality. To do this, we explore the connection between semantic relations (e.g., co-hyponymy, hypernymy, and meronymy) and the number of shared properties. If our datasets reflect semantic information about a concept, then co-hyponyms should share the most number of properties (co-hyponyms should be semantically similar and thus have overlapping sets of properties), followed by hypernyms (hyponyms generally have the properties of their hypernyms), then meronyms (part–whole relations share few properties), then pairs that have no relation at all (random pairs should share minimal properties). To do this, we leverage BLESS (Baroni and Lenci Reference Baroni and Lenci2011), a semantic relation dataset. This dataset contains a pairs of words with the semantic relation that connect them, for example, animal-alligator is a pair of words and this pair is marked with the hypernymy relation. We focus our analysis to relations between nouns and the following relations: co-hyponymy, hypernymy, meronymy, and no relation (random-n in dataset).
As GenInqMS and WN-Hyp have real-value property values, we measure the number of shared properties using a sum of the min value for each property:
 \begin{equation*}Shared(a, b) = \sum_i \min(a_i, b_i)\end{equation*}
To correct for number of properties, we also provide the Jaccard similarity:
 \begin{equation*}Jaccard(a, b) = \frac{\sum_i \min(a_i, b_i)}{\sum_i \max(a_i, b_i)}\end{equation*}
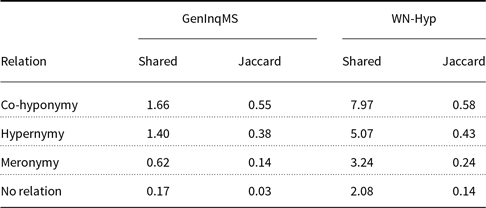
For each value, we calculate the average across all pairs and present the results in Table 7.
Number of shared properties and Jaccard similarity for pairs of words in the BLESS dataset. We applied an independent sample t-test between successive relations and found each link is strongly statistically significant (
 $p < 0.001$
)

We see that co-hyponymy pairs have the highest number of shared properties followed by hypernymy pairs, then meronymy pairs, then finally pairs of words with no semantic relationship. In addition, we ran an independent sample t-test between each pair of relations (co-hyponymy to hypernymy, hypernymy to meronymy, and meronymy to no relation) and determined that each link is strongly statistically significant (
 $p < 0.001$
). This provides evidence that GenInqMS and WN-Hyp contain reliable property information.
4. Methods
In this paper, we compare both existing and new methods on the task of property inference. Of the techniques used in previous research, we evaluate both one-step and two-step Johns and Jones (JJ1, JJ2), SVM regression (SVM), and Partial Least Squares Regression (PLS).
Both for PLS and for SVM regressions, we also experiment with a different kernel, one based on cosine similarity ( cosine PLS , cosine SVM ). Cosine similarity is known to favor co-hyponymy (Baroni and Lenci Reference Baroni and Lenci2011), sister terms in a hierarchy that tend to share many properties.
For SVM regression, the exchange of kernels is straightforward. For PLS, Rosipal et al. (2002) created a kernel version. Standard PLS learns a linear function from predictors to responses, while kernel PLS allows for a nonlinear relationship. In standard PLS, the matrices T and U can be derived from
 $XX^\intercal$
because covariances are a function of
 $XX^\intercal$
. In kernel PLS, we instead derive T and U from a matrix K where
 $K_{i,j} = K(x_i, x_j)$
for rows
 $x_i, x_j$
of X. Standard PLS is just kernel PLS with a linear kernel as can be seen by noting that
 $XX^\intercal$
is the kernel matrix K where
 $K_{i,j} = x_i \cdot x_j$
.
Another method we explore is label propagation. Label propagation is a machine learning method where the predicted properties for a word are an aggregate of the properties of its neighbors. In particular, the predicted value of property q for word w,
 $v_q(w)$
, is a weighted sum of that property weight across all words:
 \begin{equation*}\displaystyle v_q(w) = \sum_{w^{\,\prime}} W_{w,w^{\,\prime}} v_q(w^{\,\prime}) \end{equation*}
where
 $W_{w, w^{\,\prime}}$
is a measure of the similarity in usage between w and
 $w^{\prime}$
. If
 $W_{w, w^{\,\prime}} = cos(\vec{w}, \vec{w^{\,\prime}} )^{\lambda_1}$
for some
 $\lambda_1$
, then this formula is equivalent to Johns and Jones. Unlike Johns and Jones, label propagation repeats application of the above formula until the predicted property values converge.
In addition to the natural connection to Hintzmann’s work (1986, 1988) due to the parallel to the Johns and Jones method, label propagation can be seen as cognitively plausible under a “theory theory” analysis of word learning (Murphy Reference Murphy2004). Under theory theory, people do not learn concepts by connecting them to a single entity (as in prototype and exemplar theory) but instead people learn concepts by combining knowledge from several related concepts. For example, people were able to easily understand the operation and function of tablet computers (such as iPads), because they were able to draw from their knowledge of laptops, smartphones, touchscreens, and related technology.Footnote f Label propagation can be seen through a theory theory lens as predicted property values for a novel word come from a sum of property values across all words where the summands are weighted by their relation to the novel word.
The particular label propagation approach we use is modified adsorption (Talukdar and Crammer Reference Talukdar and Crammer2009) (ModAds). Modified adsorption differs from the original label propagation algorithm in that it incorporates something like a failsafe mechanism that checks if propagation “makes sense.” If we already have good knowledge of a word’s properties, then it is unnecessary to add to the word’s meaning representation, and the mechanism just returns the meaning representation we already have. Alternatively, if a word is completely different from every word we have knowledge of, say it is technical jargon in an unfamiliar field, then it does not make sense to determine that word’s properties. Then the mechanism just returns an empty meaning representation, that is, it does not attach any properties to the word. By incorporating these mechanisms, modified adsorption has greater flexibility when making predictions.
Modified adsorption models the above situations by breaking up the propagation process into three separate possibilities: “inject” (sticking with the known meaning), “continue” (propagating the meaning from similar words), and “abandon” (giving up and returning an empty meaning representation). In particular, for each word w, there are probabilities
 $p^{inj}_w$
,
 $p^{cont}_w$
, and
 $p^{abnd}_w$
that measure the probability of each possibility happening when encountering w.Footnote
g
With these probabilities and working within our property inference framework, the value of property q for word w,
 $v_q(w)$
, is defined as the function that minimizes the following conditions:
-
1. Inject:
 $p^{inj}_{w} \Vert v^{known}_q(w) - v_q(w) \Vert$
where
$v^{known}_q(w)$
is the known valueFootnote
h
of q for w. In other words, if a person decides to stick with the known meaning of a word (with probability
$p^{inj}_{w}$
), then the predicted value
$v_q(w)$
should match the known value
$v^{known}_q(w)$
.
-
2. Continue:
$p^{cont}_{w} \sum_{w^{\,\prime}} W_{w, w^{\,\prime}} \Vert v_q(w) - v_q(w^{\,\prime}) \Vert$
where
$W_{w, w^{\,\prime}}$
is related to the similarity in usage between w and
$w^{\prime}$
(defined below). In other words, if a person decides to derive the meaning of a word (with probability
$p^{cont}_{w}$
), then the derived meaning should match the meaning of similar words. -
3. Abandon:
$p^{abdn}_{w} \Vert v_q(w) - r_w \Vert$
where
$r_w$
is 1 for known words and 0 for unknown words. In other words, if a person decides to give up on figuring out the meaning of a word (with probability
$p^{abdn}_{w}$
), then the predicted value
$v_q(w)$
of an unknown word should be 0 to be as uninformative as possible.


As a machine learning algorithm, these formulas are summed to form a loss function and
 $v_q(w)$
is found by minimizing the loss. These three formulas are weighted by hyperparameters
 $\mu_{inj}$
,
 $\mu_{cont}$
, and
 $\mu_{abdn}$
.
Similar to two step Johns and Jones, we use modified adsorption as a semi-supervised approach. That is, we include an extra set of words into the training set that lack any property information but do contain usage information (word vectors). For our purposes, these extra words act as a secondary passage from the words we know to the words we want to know. For example, we may be given a weird hand tool that we cannot connect with the tools that we are familiar with, but, if we are also given a large set of other unknown tools that have similarities to both the tools we know and the unknown tool, we can put the pieces together to understand the purpose of the tool. We note that incorporating extra words into the training set is a natural extension to label propagation-based methods but is not natural to apply to direct vector to property methods such as PLS and SVM.
The “continue” possibility depends on a graph
 $W_{w,w^{\,\prime}}$
that measures the similarity in usage between each pair of words. We explore three different ways of constructing the graph. The first, which we call
ModAds NN
, is a k-nearest-neighbor graph (see Talukdar and Crammer Reference Talukdar and Crammer2009). For nodes u and v, the weight of the edge from u to v is 1 if v is one of the k most similar words (by cosine similarity between the word vectors) to u.
A k-nearest-neighbor graph weighs all of the k-nearest neighbors equally. However, closer neighbors should share more properties than further neighbors. We can capture this by forming a weighted sum of nearest-neighbor graphs. Suppose we have
 $k_i$
-nearest-neighbor graphs
 $G_i$
for
 $1 \le i \le n$
. We assume
 $k_i < k_j$
for
 $i < j$
, though the
 $k_i$
do not have to be consecutive. Suppose further that we have graph weights
 $\alpha = (\alpha_1, \ldots, \alpha_n) \in \mathbf{R}^n$
for the nearest-neighbor graphs. Then we define a new graph
 $G_{\alpha}$
for use in ModAds by defining the weight on the edge from u to v as:
 \begin{equation*}w_{uv} = \displaystyle \frac{\displaystyle \sum_{i} \alpha_i w_{uv}^{(i)}}{\displaystyle \sum_{i} \alpha_i}\end{equation*}
where we write
 $w_{uv}^{(i)}$
for the weight of the edge
 $w_{uv}$
in the i-th nearest-neighbor graph
 $G_i$
.
One version that we explore,
ModAds equal
, gives all nearest-neighbor graphs equal weights. We also explore another version,
ModAds decay
, where the contribution of a nearest-neighbor graph
 $G_i$
decays exponentially the more neighbors it includes. To do that, we set the weight for the i-th nearest-neighbor graph to be
 $\alpha_i = 2^{-i}$
.
We also test a modification that applies to all models in which property values of zero are shifted to a negative number. A word has a positive value for a property when there is some evidence that the word has the property, for example, a participant’s response. However, in some property datasets, these positive values can be close to 0, therefore not providing a good separation from properties that do not apply. In order to prevent machine learning algorithms from confusing small property values with zero property values, we shift properties with a zero property value to be a negative number, namely the negative of the average of the positive property values. We explored shifting the zero property values (denoted shifted) for all methods except JJ. As JJ is a weighted sum of property values, shifting zero values would make the method unusable.
5. Experimental framework
Data To measure distributional similarity, we use a count-based distributional model from Roller et al. (Reference Roller, Erk and Boleda2014). It uses a two word context window and is generated from the ukWaC (Baroni et al. Reference Baroni, Bernardini, Ferraresi and Zanchetta2009), Google Gigaword (Graff et al. Reference Graff, Kong, Chen and Maeda2003), Wikipedia (Baroni et al. Reference Baroni, Bernardini, Ferraresi and Zanchetta2009), and BNC (BNC 2007) corpora. The corpora are lemmatized and POS-tagged and only the content words (nouns, proper nouns, adjectives, and verbs) with frequency greater than 500 are retained. As a result, the targets and contexts in this space are 132,000 lemma–POS pairs with POS tags ranging over common noun, proper noun, verb, adjective, and adverb. A two-word window model was chosen as it models similarity more than relatedness (Agirre et al. Reference Agirre, Alfonseca, Hall, Kravalova, Paşca and Soroa2009). PPMI was applied and SVD was used to reduce to 500 dimensions. We chose PPMI over PMI as negative PMI values are not a reliable measure. Negative PMI values indicate that two words do not cooccur more than random chance, which requires many orders of magnitude more data to capture accurately (Jurafsky and Martin Reference Jurafsky and Martin2009). There is work that suggests adding a nonnegative constant to the cooccurrence counts before applying PPMI (Levy and Goldberg Reference Levy and Goldberg2014). However, the actual benefit of this addition is inconclusive, so we do not incorporate this approach into our work.
For semi-supervised algorithms that use an additional set of unlabeled words along with the training and test words (JJ2, ModAds), we use all nouns, verbs, adjectives, and adverbs that appear at least 800 times in the BNC corpus (1997), for a total of 4161 lemma–POS pairs.
Evaluation We perform 10-fold cross-validation to compare models. As each model has hyperparameters that need to be tuned, one of the nine training subsamples is used as a development set for that fold.
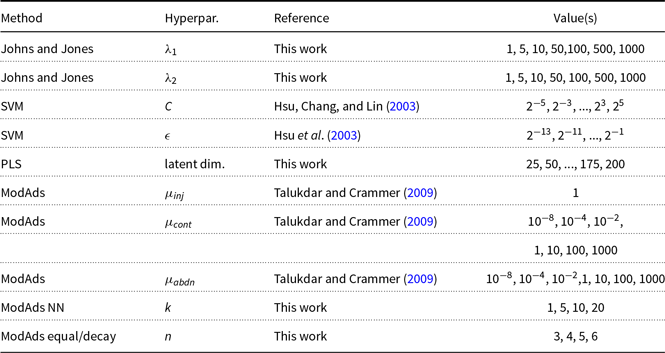
In Table 8, we display the grids we used to tune the hyperparameter settings. For linear SVM shifted on WN-Hyp, we used a smaller grid search with
 $\epsilon$
in
 $2^{-7}, ..., 2^{-1}$
due to technical issues, but inspection of results indicates that optimum is reached within that grid. For ModAds equal and ModAds decay, we optimized
 $n \in \{3, 4, 5, 6\}$
with
 $k_1 = 1, k_2 = 5, k_3 = 10, \dots, k_n = 5\cdot 2^{n-2}$
. For replicability purposes, we will make the best performing hyperparameters for each model publicly available.
Hyperparameter settings for our experiments. A list of numbers in the “Value(s)” column represents the grid used in the grid search. “Reference” provides the source for the value(s)

Our metrics for model performance are Spearman’s
 $\rho$
and MAP.Footnote
i
Spearman’s
 $\rho$
measures the correlation between rankings of gold and predicted property values, so it shows to what extent a model captures the relative weight of a property for a concept. In contrast, MAP measures the extent to which a model ranks properties that apply above properties that do not apply to a concept.
We compute Spearman’s
 $\rho$
separately for each concept and average over the results. In other words, this is a macro Spearman’s
 $\rho$
. For MAP, we calculate average precision for each conceptand then compute the MAP across all concepts.
To better ground the results of our evaluation, we provide two baselines, Property Frequency and Property Sum. For Property Frequency, the predicted value of a property for a given word is the number of words in the training data that have that property. For Property Sum, the predicted value for a property is the sum of the values for that property among all words in the training data.
6. Quantitative results
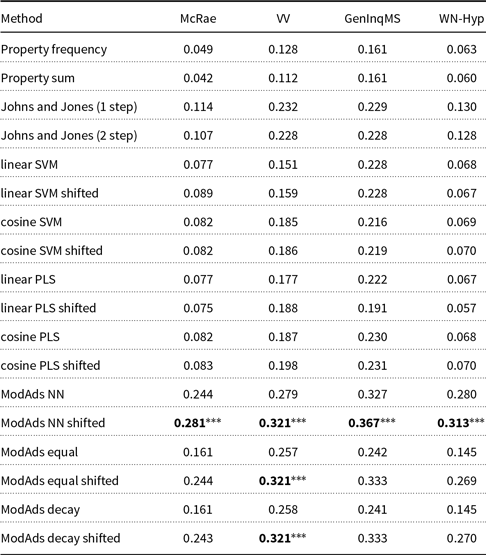
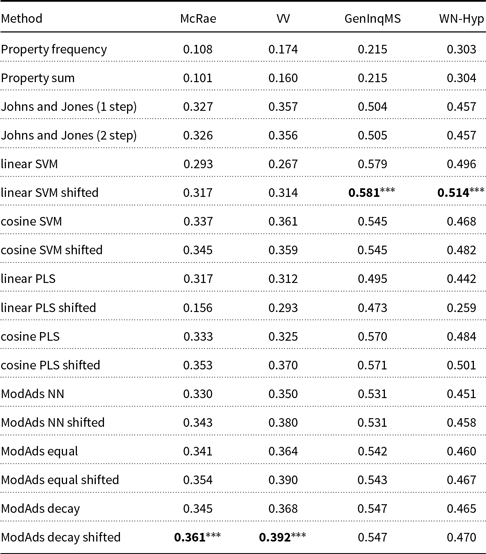
The results of our evaluation are in Tables 9 and 10. In general, ModAds approaches outperform other methods by a wide margin. By Spearman’s
 $\rho$
, shifted ModAds NN achieves the best performance across all datasets. On the MAP evaluation, shifted ModAds decay shows the best performance on the two feature norm datasets, while shifted linear SVM has the best performance on the other two datasets, GenInqMS and WN-Hyp.
Overall Comparison of Property Prediction Methods via the Spearman’s
 $\rho$
Evaluation. Statistical comparison was performed using a paired t-test between the best performer(s) and the second best performer. Notes: ***
 $p<0.01$
, **
 $p<0.05$
, *
 $p<0.1$

Overall Comparison of Property Prediction Methods via the MAP Evaluation. Statistical comparison was performed using a paired t-test between the best performer and the second best performer. Notes: ***
 $p<0.01$
, **
 $p<0.05$
, *
 $p<0.1$

Concerning the cosine kernel, PLS with cosine kernel outperforms PLS with a linear kernel across all datasets and under both evaluations. For SVM, the results are more mixed under a Spearman’s
 $\rho$
evaluation. Under a MAP evaluation, using a cosine kernel over a linear kernel with SVM greatly increases performance for McRae and VV but greatly decreases performance for GenInqMS and WN-Hyp.
Shifting zero values generally increases performance under a MAP evaluation, but the effect of shifting on performance is mostly negligible under Spearman’s
 $\rho$
.
Under Spearman’s
 $\rho$
, ModAds with a single kNN graph outperforms a mixture of kNN graphs, but the situation is reversed using MAP. Using Spearman’s
 $\rho$
, there is little difference between having all
 $\alpha_i$
be equal versus having them decay. However, under a MAP evaluation, decaying
 $\alpha_i$
perform slightly better than equal
 $\alpha_i$
.
The very simple JJ1 approach consistently outperforms linear SVM and linear PLS and is at a similar level as the cosine variants of SVM and PLS but is outperformed by ModAds. Under both evaluations and across all property datasets, JJ2 performed at the same level or worse than JJ1.
To make the patterns in our results clearer, we look at two factors: the effect of evaluating with Spearman’s
 $\rho$
versus MAP, and the differences between the property datasets. Spearman’s
 $\rho$
measures to what extent a model is correct in predicting the relative magnitudes of property values. MAP, on the other hand, tests to what extent a model ranks the properties that apply to a concept above the properties that do not apply. The property datasets fall into two groups. The first group contains the McRae and VV feature norm datasets, which have human participants provide a small number of definitional properties for each concept – properties that they found noteworthy or salient in some way. So the property values on these datasets do not reflect what a participant considers true about a concept, but rather what a participant considers noteworthy, such that many true properties receive a value of zero. For example, the property has_a_tail is not listed for the concept tiger, but it is listed for other concepts such as squirrel and zebra. The second group, GenInqMS and WN-Hyp, can be characterized as categorization-based, where taxonomy creators placed a concept in all the categories that applied.
With these points in mind, we turn back to our results. ModAds shows very good performance on both evaluation measures and most datasets. One possible reason for this is that it directly implements Hintzman’s idea of property transfer through contextual similarity – like JJ, which in spite of its simplicity does surprisingly well. We think that one important reason why ModAds surpasses JJ is its ability to both expand and restrict the pool of available evidence. ModAds is a semi-supervised approach and as such can use a larger pool of evidence. This also holds for JJ2, which however does not profit from its access to more words than JJ1 sees. But the larger pool of words in ModAds is counterbalanced by its use of a nearest-neighbor graph: Properties for a word are learned only from a small number of most similar words, ignoring evidence from less closely related words. This cutoff of more distant neighbors is most pronounced in ModAds NN, which uses a single nearest-neighbor graph, while the mixture of nearest-neighbor graphs in ModAds equal and ModAds decay acts as a smoothing operation that allows for some inference based on more distant neighbors.
Measured in terms of Spearman’s
 $\rho$
, ModAds outperforms all other approaches across all four datasets. Interestingly, it is ModAds NN that has the best performance under Spearman’s
 $\rho$
. So our hypothesis is that for the task of estimating relative magnitude of property values (as measured by Spearman’s
 $\rho$
), the semi-supervised nature of the approach is beneficial in that the model can draw on more evidence, but that the noise introduced by the additional evidence must be counterbalanced by only drawing on a few highly similar neighbors. Note that under a MAP evaluation, ModAds decay and ModAds equal have better performance than ModAds NN. So the additional smoothing that they introduce seems to be helpful for distinguishing properties that do apply from properties that do not apply, while for a more fine-grained evaluation in terms of Spearman’s
 $\rho$
the smoothing introduces too much noise.
Under a MAP evaluation, we do not have a single winning model: ModAds performs best on the McRae and VV dataset, while SVM and PLS shine on the GenInqMS and WN-Hyp datasets. As we said above, the feature norm datasets McRae and VV omit some properties which, while true, were less noteworthy to the participants. This can cause issues with SVM and PLS, as they rely on knowing not only to what extent a property applies, but also to what extent it does not apply. This is less of an issue with ModAds. As a random walk model, it can smooth property values to better handle missing values. In contrast, because of the construction of GI and WordNet, a zero property value in GenInqMS and WN-Hyp does specifically mean that the concept does not have that property. Thus, SVM and PLS approaches can function well.
The use of a cosine kernel instead of a linear kernel in SVM and PLS mostly leads to an increase in MAP. A notable exception is for SVM regression applied to GenInqMS and WN-Hyp, where a linear kernel outperforms a cosine kernel and in fact produces the best results on these datasets under MAP. This suggests that it is possible to find a linear mapping between distributional vectors and properties without needing to employ the use of word similarity. PLS considers all properties jointly rather than separately as SVM does. The MAP results for PLS indicate that cosine similarity seems to help discover the latent structure connecting distributional vectors and property vectors.
Zero value shifting improves performance under MAP on all datasets except for GenInqMS. A possible reason for this lies in a general property of shifting, namely that zero value shifting is redundant if positive property values are well separated from zero property values. GenInqMS, unlike the other property datasets, has a strong separation between positive property values and zero. For McRae and VV, the property values are the percent of participants that said a given concept has that property. This results in McRae and VV property values being spread out between 0 and 1. For WN-Hyp, property values are based on the percentage of times a word has a given sense in the Semcor corpus and thus also has property values that are spread out. In contrast, property values in GenInqMS are calculated as the fraction of a word’s senses that have a given property. As concepts in GI have few senses (1.15 senses on average), the denominator of these fractions are small and, thus, very few property values approach zero. In fact, the value 1 makes up 88.5% of positive property values in GenInqMS. As very few positive property values appear in the gap between 0 and 1, the positive property values are well separated from 0.
The above results suggest the following guidelines as to which approach to use for a given property dataset. When the goal is to capture the relative strength of a property, modified adsorption with a k-nearest-neighbor graph and shifting zero values is the best approach regardless of the attributes of your property dataset of interest. However, if the goal is to separate likely properties from unlikely properties, the attributes of the property dataset affect the results. For property datasets where a zero value is not necessarily a negative result (such as an elicitation-based dataset), zero shifting provides immediate benefit as does modified adsorption with decaying influence. In contrast, for property datasets where zero values do convey negative data (such as strict word categories), traditional classifier approaches (SVM and PLS) work best and zero shifting is largely optional.
7. Qualitative results
In Section 6, we undertook a quantitative analysis to compare the various methods. In this section, we will analyze the results of specific methods to gain insight into how these methods work and how to interpret the results.
7.1. Analysis of category effects on model efficacy
7.1.1. Part of speech
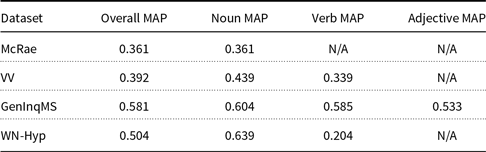
First, we will explore the connection between part of speech and model effectiveness. In Table 11, we present the MAP of the best-performing models, split by part of speech. For VV and WN-Hyp, we see that models are much more effective at predicting properties for nouns than verbs. What this indicates is that feature norms and taxonomic properties may not be effective at encoding a verb’s features. In contrast, for GenInqMS, we see a minor drop in MAP between the two parts of speech. What this indicates is that sentiment and social significance may be effective representations for verbs. This makes sense as the feature norms and taxonomic properties of the words money (a noun), buy (a verb), and financial (an adjective) are quite different, but each of these words are placed well within economic transactions, a social event. Under GI, all of these words have the Econ@ (economic) and WltTot (wealth domain) properties. Similarly, church (a noun), pray (a verb), and spiritual (an adjective) all correspond to different kinds of concepts, but all have the Relig (religious) property in GI.
Mean average precision for best performing models separated by part of speech

7.1.2. Verb type analysis
We mentioned in Section 7.1.1 that GI has less of a drop in average precision from Noun MAP to Verb MAP compared to other property datasets. In this section, we explore this further by analyzing what kinds of verbs are difficult for each dataset.
The verb types we analyze come from Semin and Fiedler (Reference Semin and Fiedler1988). We chose this categorization as GI has word lists for each of these verb types, which allow us to map verbs from VV, GenInqMS, and WN-Hyp to these verb types. The first verb type is descriptive verb (DAV), which are descriptive action verbs. These refer to a particular activity with a physically invariant feature that has a clear start and end, for example, call, kiss, talk, and stare. The second verb type is interpretive verb (IAV), which are interpretive action verbs. These refer to interpretations of an observable event, for example, help, cheat, inhibit, and imitate. The third verb type is SV, which are state verbs. These refer to mental or emotional states, for example, like, hate, notice, and envy.
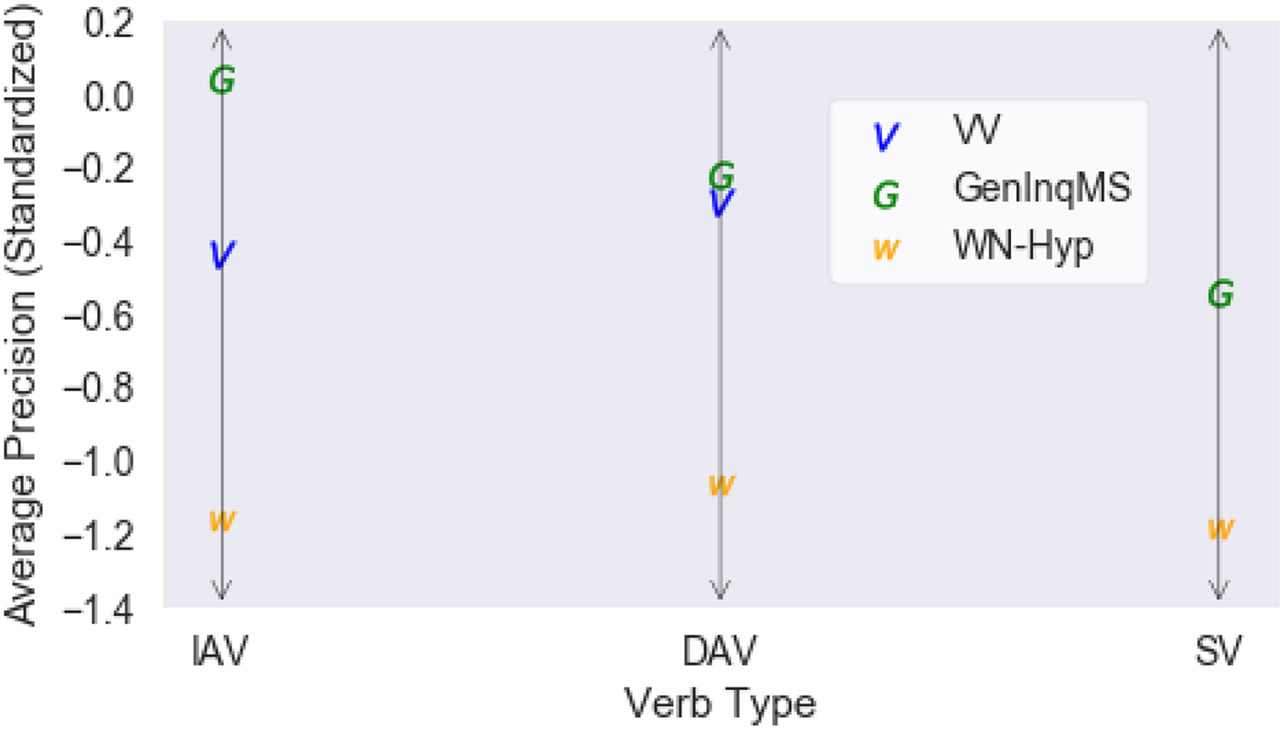
In order to compare verb type difficulty across datasets, we used z-score to standardize the average precision scores for each dataset. We then take the average standardized average precision score for each dataset and verb type to derive a value we can use to compare verb types and property datasets on an even footing. For example, if the average GenInqMS standardized AvgPrec score for the DAV verb type is 1.0 (very above average) and the average VV standardized AvgPrec score for the same verb type is
 $-1.0$
(very below average), then we can say that it is relatively easier to predict descriptive action verbs under the GenInqMS properties than the VV properties. To maintain comparability between datasets, we use AvgPrec results from the same model, ModAds decay shifted, as it was shown to perform very well across datasets. We also do not include the McRae property dataset in this analysis as it does not have verbs.
We present the results of this analysis in Figure 2. First, we find that WN-Hyp has much worse relative average precision scores across the board compared to VV and GenInqMS. This is unsurprising as WN-Hyp has a much greater difference between Overall MAP and Verb MAP (68% decrease) than VV (13% decrease) or GenInqMS (1% increase). Second, we see that GenInqMS has a higher AvgPrec for IAVs than DAVs, whereas VV has the opposite results. A possible explanation of the GenInqMS case is that GI has categories that deal with social circumstance and sentiment, which can be more readily applied to IAV verbs (which generally have a stronger connotation component), but not DAV verbs (which generally do not) (Semin and Fiedler Reference Semin and Fiedler1988). In contrast, VV properties are perceptual and so may be more amenable to DAV verbs (which are associated to a clear observable event) than IAV verbs (which are more rooted in perspective). The third observation is that GenInqMS has a lower average precision for SV than the other verb types. A possible explanation for this is that SV verbs are not associated to an observable event, like DAV and IAV are by definition, and thus are harder to represent via word vectors. Word vectors are representations of usage and we use words to describe our observations. Without a strong observational component, it may be hard for a distributional model to get the right context information to produce a quality vector for SV verbs.
Comparison of average precision scores by property dataset and verb type. VV includes less than 5 SV verbs, so is omitted from this figure.

7.1.3. Distribution of properties
In this section, we generalize the discussion in the previous section by broadening our scope beyond verb types to all categories of words. To do this, we analyze the factors that contribute to property inference being more difficult to some word categories than others. For this analysis, we define a word category to be all words that have a given property, for example, for GenInqMS, the word category DAV is the list of all words that have the property DAV and, for McRae, the word category “made_of_metal” is the list of all words that have that property.
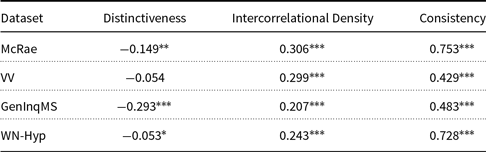
To analyze contributing factors, we will explore the correlation between category MAP and various metrics that have been explored in feature norm research. Additionally, we propose a new metric, consistency, which we will show is strongly correlated with average precision. These metrics are as follows:
-
1. Distinctiveness: Distinctiveness measures how much a property distinguishes a word (Devlin et al. Reference Devlin, Gonnerman, Andersen and Seidenberg1998; Garrard et al. Reference Garrard, Lambon Ralph, Hodges and Patterson2001). For example, the property “associated with polkas” is very distinguishing of a word like accordion as very few words have that property. The distinctiveness of a word category is calculated as the inverse of the number of words in that category.
-
2. Intercorrelational density: Intercorrelational density measures the extent that a word’s properties are correlated to a given property (McRae, De Sa, and Seidenberg Reference McRae, De Sa and Seidenberg1997, McRae et al. Reference McRae, Cree, Westmacott and Sa1999). For example, if a word has the property “an animal,’ intercorrelational density measures how many of that word’s other properties are often used with animal words, such as “eats” and “has ears.” High intercorrelational density means the other properties of the word are often seen with the target property (“an animal” in the example above). Intercorrelational density for a word and property is measured as the sum of the shared variance between that property and other properties of that word. To derive an intercorrelational density for a word category, we take the average of the intercorrelational densities for words in that category.
-
3. Consistency: We propose a new measure called consistency, which measures how much the words in word category share properties. For example, words in a bird word category have a high consistency as birds share many properties, for example, have wings, fly, and have beaks. In contrast, a “used by humans” category has low consistency as there is less in common between a trombone and a submarine. Consistency between two words is measured by the Jaccard similarity between each word’s set of properties, that is, the number of properties in common divided by the number of properties in the union. We then calculate a consistency score for a word category by averaging the consistency score across every pair of words in the category. To contrast with intercorrelational density, that one measures correlation between properties and consistency measures overlap between words.
We then correlate the MAP for a word category with these metrics. We remove every category that has less than five members. We present the results of this analysis in Table 12. We see that, except for GenInqMS, distinctiveness has a relatively weak negative correlation with category MAP. This indicates that the size of the category has little effect on the MAP. In contrast, intercorrelational density has a much stronger correlation. This makes sense as high intercorrelational density means that many properties appear in the same words, which means that predicting said properties should be easier.
Correlation between average precision and several measures of property distribution. Notes: ***
 $p<0.01$
, **
 $p<0.05$
, *
 $p<0.1$

From the table, we see that consistency has a much higher correlation across the board. What these high correlations indicate is that MAP for a word category is intimately connected to how contained the category is. If a word category has a low consistency, then the words in that category must have a wide variety of properties that are not shared between the words. This could result in the machine learning model not having a consistent idea of what makes up the category, which could lead to inaccuracy. In contrast, high consistency means that words in the category rarely have properties outside of a shared set. Thus, property inference is much simpler for these words.
7.2. Analysis of predicted properties
In this section, we explore what kinds of properties get predicted and how they relate to the gold properties. For each dataset, we analyze the top predicted properties for a selection of words as predicted by the best-performing model.
7.2.1. McRae feature norms
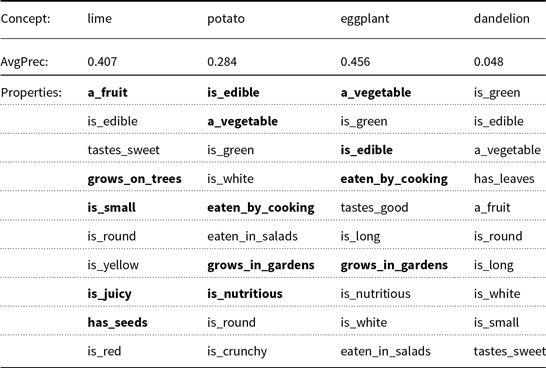
The first property dataset we will look at is the McRae feature norms. Under the MAP evaluation, the winning method was modified adsorption with a decaying transfer matrix and shifted zero value properties (ModAds decay shifted). In Table 13, we present the top 10 properties for lime, potato, eggplant, and dandelion. These represent one fruit (lime), two vegetables (potato and eggplant), and one non-fruit non-vegetable plant (dandelion). In the fruit and vegetables, we see that colors are highly ranked. The fruit is predicted to be yellow and red (though, noticeably not predicted to be green) and the vegetables are predicted to be green and white. These colors are expected of these food types, that is, most fruits are yellow and red and most vegetables are green and white. However, these colors are not accurate for lime and potato as limes are not red and potatoes are not green. This may be the result of ModAds using similarities between lime and other words instead of drawing information from the vector for lime itself. Methods like linear SVM and linear PLS make predictions by applying trained weights to input vectors directly. Thus, they could find the “green” part of the lime vector and predict that lime corresponds to something green. In contrast, ModAds makes predictions using only similarities between words. Thus, lime is not predicted to be green as limes are much more similar to non-green fruits than green things, or, more specifically, the word lime is used more similarly to words for non-green fruits than words for things that are green. Thus, ModAds decay shifted predicts the word lime will have general fruit-like properties instead of lime-specific properties.
Top 10 properties for lime, potato, eggplant, and dandelion

We can explore how ModAds decay shifted does with concepts that do not fit neatly into the semantic categories by analyzing the concept dandelion. Dandelions are neither a fruit or a vegetable. However, the method predicts that dandelion is both a fruit and a vegetable. The method predicts dandelions have some fruit properties (a_fruit and tastes_sweet) as well as some vegetable properties (a_vegetable and is_green). Thus, the method appears to place objects without a clear category into a combination of the closest categories.
7.2.2. Vinson–Vigliocco feature norms
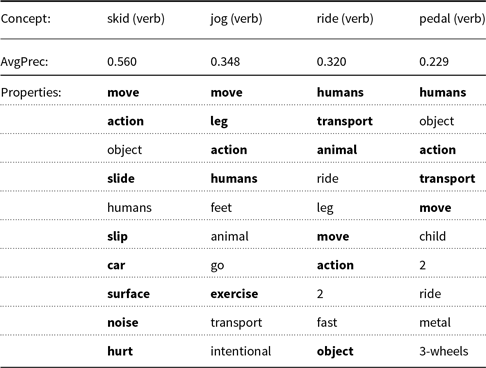
The second property dataset we will look at is the Vinson–Vigliocco feature norms. Under the MAP evaluation, the winning method was again ModAds decay shifted. In Table 14, we present the top 10 properties for the verbs skid, jog, ride, and pedal. All of these concepts relate to transportation and movement but have very different average precisions. The difference in average precision may be related to how the property dataset was constructed rather than the method itself. This can be seen by predicted properties. For example, the method predicts that pedal has the properties “child”, “ride”, “metal”, and “3-wheels”. None of these are gold properties for pedal, but are not inappropriate as pedals are used when riding, pedals are generally made of metal and children use pedals on their tricycles. Even the properties “2” and “object” are not too strange in the context of the Vinson–Vigliocco feature norms as “2” is often given as a property for paired objects and “object” is often given as a property for actions that interact with an object (see ride for example). In comparison, the gold properties that the method missed are not clearly better than the incorrect ones predicted. For example, pedal, in its set of gold properties, includes “intentional”, “exercise”, “travel”, and “balance”. While these are certainly appropriate, they are not noticeably better than “metal”, “ride”, and “object”. Thus, the average precision seems to reflect the variability of what is considered a gold property rather than a defect of the method itself.
Top 10 properties for the verbs skid, jog, ride, and pedal

The variability in what is considered a gold property is most likely an artifact of how the dataset was designed. For each concept, 20 people were asked to provide a list of properties. A property is considered gold if at least one person provided it. Thus, “walk” is a gold property of ride, because one person suggested it. The variability in elicited properties can cause vastly different quantitative evaluations even though the real-world quality of the predicted properties does not differ. We should note that the McRae feature norms have less of an issue with this as McRae et al. used a cutoff to remove rare properties.
7.2.3. General Inquirer Mean Sense
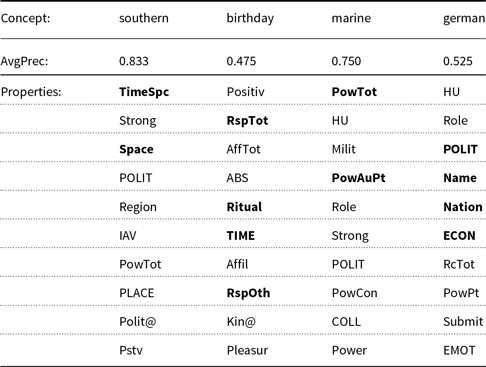
The third property dataset we will look at is the General Inquirer Mean Sense dataset. The best-performing method under the MAP evaluation is SVM with a linear kernel and shifted zero value properties (linear SVM shifted). In Table 15, we present the top 10 properties for the adjective southern and the nouns birthday, marine, and german. These were chosen to highlight the disconnect between the curators of GI (the gold properties) and the usage of the word in text (the predicted properties). The curators tended to choose properties that reflected an objective social categorization of a concept. For example, southern is given the properties of “TimeSpc” (time and space) and “Space.” However, southern is also predicted to have the properties “Strong,” “POLIT” (political), and “Region,” which reflect more of a reference to a particular political area. Similarly, the gold properties for birthday reflect a ritual providing respect (“RspTot” and “Ritual”), but the predicted properties reflect the positive, affection-related feelings associated to birthdays (Positiv and AffTot). We also see how marine and german have gold properties associated with abstract position in society (marines are involved with power and Germans are a political entity), whereas the predicted properties reflect these concepts as personal attributes, for example, marines are humans in the military and Germans are humans and a social role. In essence, linear SVM shifted predicted properties that not only reflect the abstract role a concept plays in society, but also our day to day interaction with those attributes.
Top 10 properties for southern, birthday, marine, and german

7.2.4. WordNet hypernyms
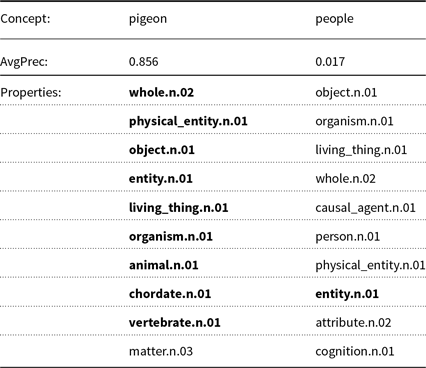
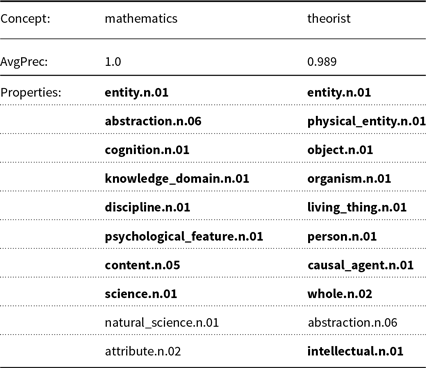
The final property dataset we will discuss is the WordNet Hypernyms dataset. The best-performing method under the MAP evaluation is linear SVM shifted. In Table 16, we present the top 10 properties for the nouns pigeon and people and in Table 17, we present the top 10 properties for the nouns mathematics and theorist. Unlike the other property datasets, the properties in this dataset form a strict hierarchy. This hierarchy plays a strong role in the accuracy of the predicted properties. Properties that are higher in the hierarchy (i.e., more general synsets) tend to do well as seen in the top properties of pigeon, mathematics, and theorist. However, properties that are lower in the hierarchy (i.e., more specific synsets) are predicted to be lower ranked, for example, for the word pigeon, the property “bird.n.01” is ranked 13th and the property “gallinaceous_bird.n.01” is ranked 22nd. Thus, this method excels at ranking correct general properties over incorrect general properties, but this method does not excel at ranking correct specific properties over incorrect specific properties.
Top 10 properties for pigeon and people

Top 10 properties for mathematics and theorist

An additional influence of hierarchy in the performance of the method on the WordNet Hypernyms property dataset is that the noun properties are strictly divided between abstract properties (descendants of the synset “abstraction.n.06”) and physical properties (descendants of synset “physical_entity.n.01”). However, often times it is not clear whether a concept is abstract or physical, which causes difficulty in a method’s ability to predict properties. For example, people was predicted to be a physical entity, which makes sense as people refers to a collection of physical entities. However, groups are treated as abstract entities in the WordNet hierarchy. Given the strict separation between abstract and physical properties, a wrong guess about a concept causes the method to only predict properties in the wrong category. However, nouns (both concrete and abstract) that are associated with abstract concepts do not seem to have an issue with the abstract/physical divide. For example, the properties for the words mathematics and theorist were predicted accurately, even though both words are connected to abstract concepts (mathematics and theories).
8. Conclusion
In this paper, we have studied supervised and semi-supervised models that infer properties from distributional vectors. We have proposed the use of label propagation (specifically, modified adsorption) for the task, and we have proposed two modifications that apply to several models, namely the use of a cosine kernel and the shifting of zero property values to negative values to achieve better separation between properties that do and that do not apply.
We find that modified adsorption, in particular shifted modified adsorption based on a single nearest-neighbor graph, is best at predicting a ranking of property values (based on a Spearman’s
 $\rho$
evaluation). Under a MAP evaluation, which focuses on the distinction of properties that do apply from those that do not, the differences between property datasets become more apparent. In terms of MAP, modified adsorption (in particular shifted modified adsorption with an overlay of multiple nearest-neighbor graphs with exponentially decaying weights) has the best performance on feature norm datasets, where it is necessary to smooth over property values that should be positive but are zero because of missing information. SVM, in particular with shifting and with a linear kernel, works best on the categorization-based datasets that we derived from the GI and from WordNet. We further find that using a cosine kernel instead of a linear kernel mostly improves performance. Shifting zero values to negative values in property datasets is also helpful, in particular for datasets that contain small positive values.
A future direction for property inference research is improving the construction of property datasets. Getting good property sets is hard. We have chosen two that have quite nice property lists, but they are only a small fraction of the things we know about a concept. One direction for future work is to explore semi-automatic approaches to property dataset creation that will allow researchers to produce larger and higher quality property datasets.
Some concepts are harder to describe in terms of features than others, and verbs are clearly harder than nouns, as can also be seen in the Vinson and Vigliocco feature norms. One direction of future work is to explore the property representation of verbs. One approach may be trajectories for events, an idea proposed by Gärdenfors (Reference Gärdenfors2014).
Supplementary material
To view supplementary material for this article, please visit https://doi.org/10.1017/S1351324921000267