
Introduction
MoS2 remains one of the most extensively studied two-dimensional materials in the transition-metal-dichalcogenide (TMDC) family.[Reference Manzeli, Ovchinnikov, Pasquier, Yazyev and Kis1] Structurally, these novel materials are stacked together by Van-der-Waals forces.[Reference Novoselov, Mishchenko, Carvalho and Castro Neto2] Among the many remarkable properties shown by TMDCs, the existence of a tunable band gap, from indirect (1.3 eV, bulk) to direct (1.8 eV, monolayer) for MoS2[Reference Zhao, Ghorannevis, Chu, Toh, Kloc, Tan and Eda3], is one of the attractive property.[Reference Ross, Wu, Yu, Ghimire, Jones, Aivazian, Yan, Mandrus, Xiao, Yao and Xu4] Therefore, many electronic[Reference Manzeli, Ovchinnikov, Pasquier, Yazyev and Kis1] and optoelectronic applications[Reference Lee, Zhang, Zhang, Chang, Lin, Chang, Yu, Wang, Chang, Li and Lin5] are envisioned for such materials. Several growth techniques, classified as either top-down or bottom-up approaches, have been elaborated for 2D materials fabrication. However, the existing challenge of synthesis of scalable and high-quality TMDCs such as MoS2 persists.
Popularized by the discovery of graphene,[Reference Geim and Novoselov6] top-down techniques which include liquid phase exfoliation[Reference Liu, Kim, Kim, Ye, Kim and Lee7] and micromechanical exfoliation,[Reference Radisavljevic and Kis8] produce flakes of typical small lateral size (<10 µm).[Reference Gabor, Peto, Dobrik, Hwang, Biro and Tapaszto9] Several large-area fabrication techniques have been elaborated to pave the way for the fabrication of scalable and controllable 2D materials. These methods consist of powder vaporization[Reference Dumcenco, Ovchinnikov, Sanchez, Gillet, Alexander, Lazar, Radenovic and Kis10–Reference Li and Zhu13] of elements and compounds such as Mo, W, MoO3, and MoCl5, metal-organic chemical vapor deposition,[Reference Kang, Xie, Huang, Han, Huang, Mak, Kim, Muller and Park14] atomic layer deposition,[Reference Tan, Liu, Teng, Guo, Low and Loh15] thermolysis,[Reference Liu, Zhang, Lee, Lin, Chang, Su, Chang, Li, Shi, Zhang, Lai and Li16] and physical vaporization techniques such as pulse laser deposition,[Reference Serna, Yoo, Moreno, Xi, Oviedo, Choi, Alshareef, Kim, Minary-Jolandan and Quevedo-Lopez17] molecular beam epitaxy,[Reference Fu, Zhao, Zhang, Li, Xu, Jang, Yoon, Song, Poh, Ren, Ding, Fu, Shin, Shin, Pantelides, Zhou and Loh18] and magnetron sputtering.[Reference Tao, Chai, Lu, Wong, Wong, Pan, Xiong, Chi and Wang19] A common feature of all these methods involved high-temperature growth process, preferably in a sulfur-rich environment. A literature review on large-area growth approach of TMDCs is summarized in Table S.1.
Previously, we developed a growth strategy using a magnetron sputtering technique to produce large-area few-layer MoS2 films.[Reference Samassekou, Alkabsh, Wasala, Eaton, Walber, Walker, Pitkänen, Kordas, Talapatra, Jayasekera and Mazumdar20] We showed that a room temperature growth using a stoichiometric target followed by an annealing at close to 450–500 °C led to well-defined Raman peaks, along with sharp interface with the substrate. While simple, careful investigations also revealed the presence of substantial chemical and structural disorder in our films.[Reference Samassekou, Alkabsh, Wasala, Eaton, Walber, Walker, Pitkänen, Kordas, Talapatra, Jayasekera and Mazumdar20, Reference Wasala, Zhang, Ghosh, Muchharla, Malecek, Mazumdar, Samassekou, Gather-Ganim, Morrison, Lopez, Carozo, Lin, Terrones and Talapatra21] Compared with the spectroscopic features of single crystal and chemical vapor deposition grown MoS2,[Reference Najmaei, Liu, Zhou, Zou, Shi, Lei, Yakobson, Idrobo, Ajayan and Lou11] well-defined exciton peaks were missing in optical absorption along with broad and weak E12g Raman peaks. Since sulfur has a strong role in promoting such features, we hypothesized that the sputtered films suffer from inhomogeneous sulfur distribution and vacancies. This motivated the current study of fabricating and investigating the properties of MoS2 thin films in a sulfur-rich environment.
In this work, we report the evolution of the spectroscopic and transport properties of sputtered MoS2 annealed in a sulfur-rich environment at various temperatures. We show that the sulfurization process generates sharp exciton peaks, strong Raman modes, promotes semiconducting behavior (transport and optical), and better photo-conducting behavior. Some of the experimental results were directly correlated to electronic structure calculations. Broadly speaking, our work provides clear evidence that a novel hybrid PVD-CVD process leads to high-quality MoS2 thin films.
Experimental and theoretical methods
The sulfurization process was conducted via an ex-situ process involving a CVD-type process as shown in Fig. S.1. MoS2 films were deposited on quartz and sapphire substrates using a high vacuum magnetron sputtering system (base pressure 1 × 10⁻⁹ Torr). Transparent quartz was chosen over Si/SiO2 to enable optical absorption and large-area transport measurements. The first method (referred as M 1) refers to our earlier studies which consisted of sputtering a commercially available stoichiometric MoS2 target at a rate of 7 secs/layer, followed by a post-deposition annealing treatment at 485 °C under high vacuum conditions.[Reference Samassekou, Alkabsh, Wasala, Eaton, Walber, Walker, Pitkänen, Kordas, Talapatra, Jayasekera and Mazumdar20, Reference Wasala, Zhang, Ghosh, Muchharla, Malecek, Mazumdar, Samassekou, Gather-Ganim, Morrison, Lopez, Carozo, Lin, Terrones and Talapatra21] M 2 method consisted of sputtering MoS2 at a rate of 25 secs/layer followed by a post-deposition annealing treatment at various temperatures under sulfur and argon environment. Most of the samples were fabricated using this method and it is the focus of this work. The third method, M 3, examined a high-temperature sulfurization (850 °C) of room temperature sputtered Mo thin film. This method has been explored in the literature and employed here for comparison (see Table S.1).
The stoichiometry of the films was verified by electron energy dispersive spectroscopy (EDS). X-ray diffraction (XRD) and X-ray reflectivity (XRR) patterns were assessed using a high-resolution Rigaku Smart Lab X-ray diffractometer equipped with a channel-cut Ge (220) crystal to obtain a highly monochromatic Cu Kα1 radiation (see Supplementary material for additional details). Film thickness was inferred using XRR and Ellipsometry measurements. The absorption spectra were obtained using a Shimadzu UV3600 broadband optical spectrometer in the 190–1500 nm range. Raman measurements were performed with Nanophoton Raman-11 spectrometer using a 532 nm laser. Electronic transport and photo-conducting measurements were obtained by means of a LabVIEW program and a 2400 Keithley source. First-principles calculations[Reference Towns, Cockerill, Dahan, Foster, Gaither, Grimshaw, Hazlewood, Lathrop, Lifka, Peterson, Roskies, Scott and Wilkins-Diehr22] were performed using the augmented plane wave + local orbitals (APW + lo) method as implemented in the WIEN2k package[Reference Blaha, Schwarz, Madsen, Kvasnicka and Luitz23] using the generalized gradient approximation (GGA) by Perdew–Burke–Ernzerhof.[Reference Pedrew, Burke and Ernzehof24] Van-der-Waals interactions[Reference Grimme, Antony, Ehrlich and Krieg25] were incorporated. Kramers–Kronig consistent optical properties were also computed using the WIEN2k package.
Results and discussion
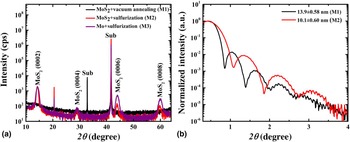
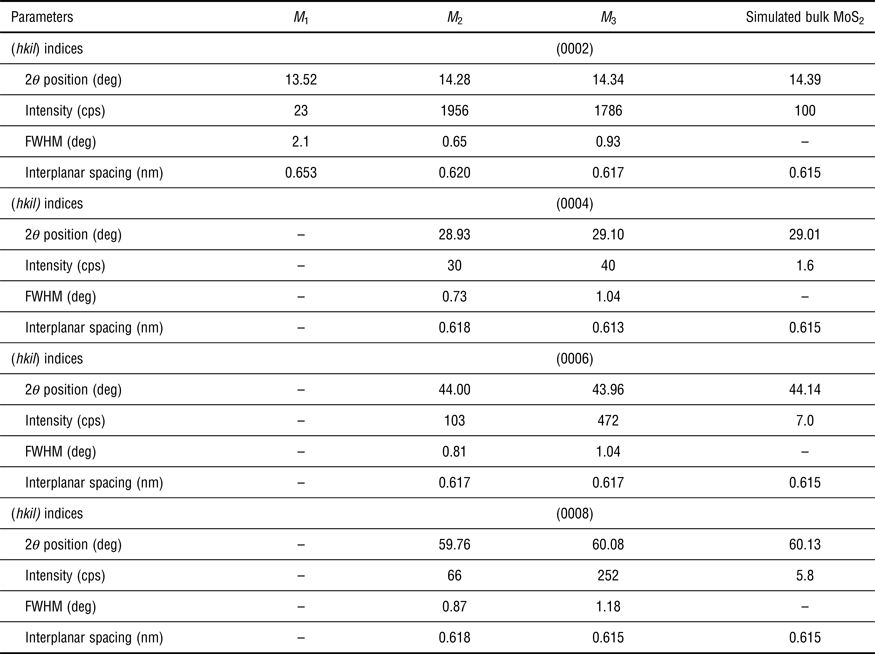
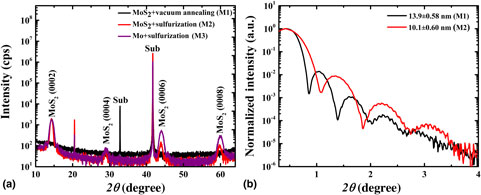
The XRD data in Fig. 1 demonstrates the effect of different growth conditions on 12 nm thick MoS2 films. The three different synthesis methods mentioned earlier (M 1, M 2, and M 3) are compared in Fig. 1(a). M 1 referred to the vacuum annealed process while M 2 and M 3 referred to the sulfurized MoS2 and Mo process, respectively. Both sulfurized conditions (sample type M 2 and M 3 annealed at 850 °C) reveal only (000l) peaks up to (0008) which was suggestive of a strong crystalline, oriented growth whereas unsulfurized M 1 samples showed only a weak (0002) peak. The extracted XRD features (peak position, intensity, and full-width-at-half-maximum (FWHM)) and lattice parameters are tabulated in Table I. The interplanar spacing, which corresponds to half the lattice parameter, was extracted for all (000l) MoS2 reflections. For reference, the data were compared with a simulated MoS2 bulk structure with relative intensities presented for several (000l) reflections. The 2θ peak position of the (0002) MoS2 reflection was very close to the bulk value (14.4°) for the sulfurized samples, indicative of better crystallization with the sulfurization process. Unsulfurized samples showed a lower 2θ value implying a larger out-of-plane lattice parameter, which was reported in our prior work.[Reference Samassekou, Alkabsh, Wasala, Eaton, Walber, Walker, Pitkänen, Kordas, Talapatra, Jayasekera and Mazumdar20] The (0002) peak showed a dramatic increase in intensity by nearly a factor of 100 after high-temperature sulfurization. The increase in intensity is concomitant with a narrow FWHM as shown in Table I.
(a) XRD pattern of many-layer 12 nm-MoS2 thin films grown on sapphire under different conditions. (b) XRR measurements for the sulfurized MoS2 (M 2 type) compared with vacuum annealed MoS2 (M 1).

MoS2 2θ peak position as a function of growth conditions.

The XRR measurements for the sulfurized MoS2 (M 2 type) was compared with vacuum annealed MoS2 (M 1) in Fig. 1(b). The oscillatory pattern revealed that sharp substrate–film interface was achieved in sulfurized MoS2.[Reference Samassekou, Alkabsh, Wasala, Eaton, Walber, Walker, Pitkänen, Kordas, Talapatra, Jayasekera and Mazumdar20] A fit to the XRR curve can provide layer-specific information such as thickness, surface and interfacial roughness, and density. The extracted thickness and rms roughness values are shown in Fig. 1(b). More detailed information is provided in Fig. S2. Quantitatively, the sulfurized MoS2 film showed similar surface roughness (~0.6 nm) as vacuum-annealed MoS2 which is extremely encouraging. Therefore, we concluded that the sulfurization process did not degrade the sharp interfacial and surface properties of sputtered MoS2 films while promoting high bulk properties. Similarly, large atomic force microscopy scans of sulfurized MoS2 thin films demonstrated uniform low-roughness films with rms values of less than 1 nm, consistent with XRR analysis. Similar morphology was observed in 3–4 layer MoS2 with a peak to valley height of nearly 2 nm which demonstrated that sulfurization of sputtered MoS2 films can be used to grow high-quality few-layer MoS2 (see Fig S.4 for details). Scanning electron microscopy (SEM) scans across different growth techniques revealed uniform films as shown in Fig. S.3 except for small sulfur particulates at the surface of sulfurized samples (M 2 and M 3), which were confirmed by electron EDS. The stoichiometry of the films for the three different growth conditions was summarized in Table S.2. AFM scans of sulfurized samples also demonstrated features consistent with sulfur patches observed in SEM measurements.
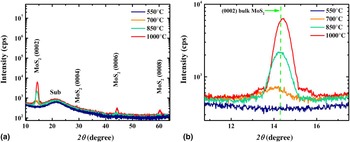
The effect of sulfurization temperature on the XRD pattern of many-layer (12 nm) MoS2 deposited on fused quartz is shown in Fig. 2(a) and 2(b). The as-deposited films were sulfurized for 1 hr under sulfur and argon environment at temperatures ranging from 250 to 1000 °C. XRD data of four representative temperatures are shown. We observe that the (0002) peak, which is the strongest MoS2 diffraction peak, was very weak or not observed for sulfurization temperatures below 650 °C. This was suggestive that low temperatures were not effective, whereas sulfurization at 850 and 1000 °C resulted in the appearance of higher (000l) MoS2 peaks with low FWHM, indicative of strong crystalline structure at higher temperatures. Figure 2(b) illustrated the variation of (0002) peak position as a function of sulfurization temperature with detailed quantitative analysis shown in Table S.3. The peak position of the (0002) MoS2 reflection progressively reached the bulk value (c = 12.3 Å) at 850 °C while the sample at 1000 °C appears to have lower (but close) than bulk lattice parameter. While it was inconclusive from this data alone, it indicated that very high sulfurization temperatures (above 850 °C from this study) might be detrimental to the MoS2 structure and consistent with some other characterizations shown in later discussions. The structural characteristics of samples grown on different substrates (Si/SiO2, quartz, and sapphire) are compared in Table S.4.
(a) XRD pattern of many-layer sputter deposited MoS2 on fused quartz sulfurized at different temperatures as indicated. (b) Variation in many-layer MoS2 (0002) peak position as a function of sulfurization temperature.

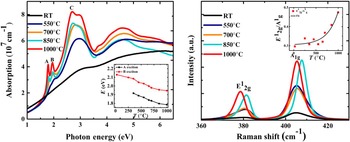
In Fig. 3(a) we show the absorption spectra of several 12 nm MoS2 thin films as a function of sulfurization temperature. The most noteworthy change was the appearance of strong A, B (both around 2 eV as indicated) and C (around 2.7 eV) excitons as the temperature increased. A substantial change of excitonic energy position, intensity, and linewidth was also observed with increasing sulfurization temperature. These excitons correspond to the direct transition at K point in the Brillouin zone, from the split-valence band maximum (due to the spin-orbital splitting) to the conduction band minimum.[Reference Mak, Lee, Hone, Shan and Heinz26] In-plane orbitals, such as S px and py, Mo dxy, and dx 2−x 2, which are responsible for valence band states at K point[Reference Padilha, Peelaers, Janotti and Van de Walle27] are more sensitive to defects in the form of sulfur vacancies. The absence of sharp excitons in vacuum-annealed MoS2 thin films is another strong evidence of sulfur vacancies in the films. The evolution of MoS2 A–B excitons as a function of sulfurization temperature is shown in the inset figure (raw data shown in Table S.5). A clear red-shift of excitonic energy position at higher growth temperatures is noted which is consistent with the lattice relaxation observed in XRD measurements. Even though we did not directly measure the in-plane lattice constant, the data hint that the relaxation of lattice parameters to bulk values preserved the volume (see Fig. S.7a). Band gap analysis also showed that the band gap value of 1.3 eV is obtained only for samples sulfurized at 700 °C or above (Fig. S.7b) and much lower for low temperature or unsulfurized samples.
(a) Absorption of 12 nm-MoS2 thin films on fused quartz. The inset demonstrates the evolution of MoS2 A–B excitons as a function of sulfurization temperature. (b) Temperature dependent Raman spectra of 12 nm-MoS2 thin films. The inset reveals the ratio of the Raman modes as a function of sulfurization temperature.

Figure 3(b) demonstrates our findings from Raman spectroscopy. Sulfurization treatment up to 1000 °C resulted in clear increased intensity and lower FWHM. A quantitative analysis of the Raman data is shown in Table S.6. The inset of Fig. 3(b) shows the intensity ratio of the two vibrational modes with increasing sulfurization temperature. The trend in peak intensity and FWHM is clear and strong. In particular, the increase in E12g/A1g intensity ratio is most significant at temperatures above 700 °C, particularly at 850 and 1000 °C, consistent with XRD and optical measurements, thereby proving, yet again, the replenishment of sulfur vacancies at higher temperatures.
While the analysis of intensity and FWHM was more straightforward, the variation in the Raman peak positions as a function of sulfurization temperature was not, particularly at 850 and 1000 °C that showed the highest XRD and Raman intensity. Most distinct were the changes in the A1g peak positions at 850 °C and the E12g peak position at 1000 °C that were different from nearby temperatures even though bulk-like frequency difference (~26 cm−1) was observed at both temperatures, unlike the differences at lower sulfurization temperatures (see Table S.6). A monotonic shift in peak position was observed for E12g peak in the 450–700 °C temperature window, while A1g mode changed monotonically throughout apart from 850 °C (see Fig. S.5). The fitted linear slopes over these ranges were −0.004 and −0.0008 cm−1/K for the E12g and A1g modes, respectively. In comparison, Lanzillo et al. [Reference Lanzillo, Birdwell, Amani, Crowne, Shah, Najmaei, Liu, Ajayan, Lou, Dubey, Nayak and O'Regan28] had much higher values (−0.015 and −0.013 cm−1/K) through temperature dependent Raman measurements. The weak variation in the peak positions, therefore, showed a residual strain effect, at best, and not observed in the entire temperature range.
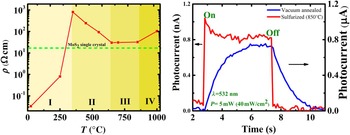
Figure 4(a) demonstrates the evolution of resistivity as a function of sulfurization temperature. Ohmic (linear) contacts were verified through Current–Voltage (I–V) measurements as shown in Fig. S.6a. The resistivity curve shows a non-monotonic behavior with sulfurization temperature and can be divided into four regions as shown in Fig. 4(a). In region 1 (RT-350 °C), the introduction of large sulfur atoms in vacuum-annealed, nearly metallic, MoS2 introduces strong scattering that increases the resistivity to above the bulk value at 350 °C. The temperature in this range is not high for the sulfur atoms to reach equilibrium positions in the MoS2 lattice. In region II (350–650 °C), the higher temperatures provide the sulfur atoms higher thermal energy to attain equilibrium crystal positions, promoting higher crystalline order, which gradually reduces the resistivity towards the bulk value. Region III (650–850 °C) provides the optimum window for growth with stable and near bulk resistivity values. Temperatures close to 1000 °C (Region IV) show a slight increase in resistivity and may indicate the presence of structural disorder due to high temperatures. Qualitatively, a similar trend was observed down to few-layer MoS2. The optimum resistivity value of a 12 and 5 nm MoS2 thin film is 32.07 and 83.64 Ωcm, respectively. The increase in resistivity for thinner MoS2 could be, in part, explained as due to the change in the electronic nature in few-layer MoS2 thin films. Hall measurements also revealed a dramatic increase in mobility and reduction of carrier concentration with sulfurization. An optimally sulfurized MoS2 thin film (12 nm) recorded a mobility value of μ = 37.6 ± 14.1 cm2/V/s and a carrier density n = (7.1 ± 2.51) × 1015 cm−3, comparable with those reported by Nazir et al. [Reference Nazir, Khan, Lermolenko and Eom29] whereas vacuum annealed samples showed very low mobility <1 cm2/V/s and high bulk carrier concentration n ~1021–1022 cm−3.
(a) Variation in 12 nm-MoS2 thin film resistivity as a function of sulfurization temperature. (b) Photoconductivity measurements on a vacuum annealed (blue) and sulfurized sample (red).

In Fig. 4(b), we compared the photo-conductivity behavior between the optimally sulfurized (M 2 type, T = 850 °C) and unsulfurized (M1 type, vacuum annealed) MoS2. The photo-current was measured by shinning a manually-controlled laser pulse of 5 mW power (wavelength = 532 nm) and taking the current versus voltage (I–V) data taken at intervals of 100 ms. Despite our limited resolution, the difference in the sample response was clear. A sharp, symmetric response (fall and rise time below 100 ms) is observed for the sulfurized samples compared with a slow, asymmetric photo-response for vacuum annealed samples (rise time = 1.1 s and fall time = 1.6 s). Again, this highlights the importance of sulfurization in sputtered samples. In Fig. S6(b), we showed the response of some other sulfurized samples with manually controlled pulse-width and cycle.
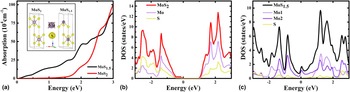
The conclusions from various measurements presented above share a common physical origin, i.e., sulfur vacancies are responsible for (a) weak crystal structure (b) lack of clear excitonic peaks and low band gap (c) weak Raman modes, particularly E12g, (d) metallic transport behavior, and (e) weak photo-conducting behavior. To approximately interpret the electronic properties of sulfur deficient MoS2 we have performed first-principles optical absorption and density of states calculation of a hypothetical MoSx (x = 1.5) compound and compared with stoichiometric MoS2. Since we assume an ordered structure for MoS1.5, the properties cannot reproduce the effect of a disordered crystal structure (weak XRD and Raman). Nonetheless, the physical insight can be highly revealing. In the inset of Fig. 5(a), we showed the unit cell of the two structures. The sulfur deficient MoS1.5 structure was created by removing a sulfur atom from one of the two Mo atoms in the MoS2 unit cell (denoted by atom 2 in Fig. 5(a) inset). Initially, the bulk MoS2 structure was volume relaxed to obtain a = 3.16 Å and c/a = 3.965 which was very close to experimental values of a = 3.14 Å and c/a = 3.905. Using this structure, we obtained an indirect band gap of nearly 1.0 eV which was lower than the experimental value (1.3 eV), but similar to other GGA calculations.[Reference Bhattacharyya and Singh30] The Kramers-Kronig consistent optical absorption spectra of stoichiometric MoS2 and sulfur deficient MoS1.5 is shown in Fig. 5(a). As clear, the sulfur-deficient MoS1.5 did not show a gapped behavior whereas stoichiometric MoS2 showed a 1.0 eV band gap. This data is consistent with Fig. S.7 where we showed that the bulk band gap was obtained when the sulfur deficiency was completely removed (samples annealed above 650 °C), whereas vacuum annealed sample (modelled as MoS1.5) showed a very small gap value (0.3 eV). The lack of the gapped behavior in MoS1.5 is confirmed in the electronic density of states calculations as shown in Fig. 5(b). The stoichiometric structure showed the 1.0 eV gap, while a metallic ground state was obtained in the sulfur-deficient structure with an electronic contribution at Fermi level from the Mo atom from which the sulfur atom was removed (Mo 2). Results shown in Fig. 5(b) is consistent with experimental transport results. The resistivity and Hall measurements of RT-vacuum annealed sample (M 1) showed a nearly metallic behavior which was consistent with the computed density of states of MoS1.5 whereas optimally sulfurized samples showed a resistivity consistent with a semiconducting behavior. Sulfur deficiency also resulted in a sluggish photo-response behavior (due to scattering from vacancy sites) which improved drastically when the vacancies are removed.
(a) Simulated absorption spectra of MoSx (x = 2, 1.5). Inset shows the crystal structure of MoS1.5 and MoS2 on which the calculations were performed. (b) Density of states calculations of MoS2. (c) Density of states calculations of MoS1.5.

Conclusion
In conclusion, we systematically investigated the evolution of structural, optical, and transport properties in MoS2 as a function of sulfur deficiency. We showed that an ex-situ sulfurization at high temperatures of magnetron sputtered MoS2 (nominal composition) provided the highest quality of thin films due to the replenishment of the sulfur vacancies. Sputtered MoS2 followed by a high-temperature sulfurization revealed a drastic enhancement of structural, interfacial, and electronic properties as demonstrated by diffraction, spectroscopic, and electronic transport techniques. High crystalline order and sharper interfaces were noted in the case of sulfurized samples. Sharp MoS2 A–B exciton peaks were noted with increasing sulfurization temperature along with a high bulk order. Evidence of sulfur vacancies was also provided in Raman spectroscopy measurements where a strong increase in the Raman signal was noted for samples sulfurized at high temperatures. We also conclusively demonstrated that sulfur vacancies in MoS2 thin films were responsible for the decrease in DC resistivity and slow photo-response. Our work provides atomic-level insights into the structure–property relationship of large-area TMDC films. Moreover, the proposed joint-process of PVD and CVD for the synthesis of large-area high-quality MoS2 thin films could be extended to other 2D materials with the incorporation of slight modifications leading to a plethora of applications.
Supplementary material
The supplementary material for this article can be found at https://doi.org/10.1557/mrc.2018.167
Acknowledgments
Dipanjan Mazumdar would like to thank startup funds at Southern Illinois University (SIU) and support through the NSF-REU grant (DMR 1461255). The Raman data shown here was performed at the Frederick Seitz Materials Research Laboratory, University of Illinois at Urbana-Champaign. We also thank the support provided by the SIU Advanced Coal Energy Research Center (ACERC) grant. This work used the Extreme Science and Engineering Discovery Environment (XSEDE) which is supported by National Science Foundation grant number ACI-1548562. Computational resources were provided at the San Diego Supercomputer Center (comet) through allocation DMR160135. We additionally thank Nicole Wolter of SDSC for her assistance and Milinda Wasala for assistance with AFM measurements.