I. INTRODUCTION
The study of radiofrequency design for test (RF DFT) techniques has become fundamental to reach the required quality standards for System-on-Chip (SoC), and to tackle the high test costs of RF chips (mainly due to the usage of expensive RF automated test equipment (ATE) and long test time). Hence, by adding additional on-chip circuitry, the cost of the test can be reduced [1–3].
The aim of RF DFT sensors is usually to convert high-frequency dynamic parameters either into DC or baseband signals that can be handled more easily. According to [4–6], they must be robust against process and mismatch variations, and have an accurate conversion gain, wide linearity and dynamic range, low-integrated output noise, and high input impedance. A small area and a low power overhead are also desired for a higher integration capability.
On a test perspective, those extra design blocks will always degrade the test efficiency when compared with the ideal probe measurement. By analogy, the sensor ‘parasitic’ may be seen as a ‘noise’ source in the ideal probing signal path. Therefore, by taking a signal-to-noise ratio approach, a figure of merit can be established.
II. CASE STUDY
To validate our methodology, we chose a narrowband 11.7 GHz LNA (designed in a SiGe:C BiCMOS technology) to act as our Circuit under Test (CUT) [Reference Voinigescu7, Reference Liang, Niu, Cressler, Taylor and Harame8].
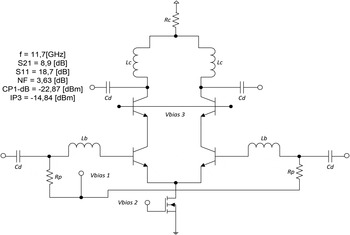
The low noise amplifier (LNA) circuit schematic used is shown in Fig. 1, where L b and L c are surface-mounted inductors and C d are metal insulator metal (MIM) decoupling capacitors. For the sake of simplicity, the biasing circuit was omitted. From the simulation standpoint, the whole circuit occupies a 110 547 µm2 surface (0.11 mm2) and accounts for six bipolar junction transistor (BJT) transistors, four surface-mounted inductors, four MIM capacitors, five complementary metal-oxide semiconductor (CMOS) transistors, and six thin film resistors.
LNA circuit schematic.

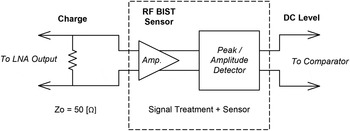
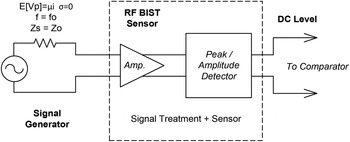
In our analysis, the circuit is considered ‘functional’ when all of the following specifications are inside their ±3σ interval: S 21 (forward power gain), S 11 (input return loss coefficient), NF (Noise Figure), CP 1−dB (1-dB compression point), and IP3 (third-order intercept point). As the CUT is a low-noise amplifier, so a linear analog circuit, the other parameters were not considered in statistical modeling. Due to its strong statistical correlation with the defined specifications, we decided to estimate the dispersion of the output AC peak voltage. To properly monitor this parameter, we need to convert the AC magnitude into a DC level signal, which is realized by employing the RF amplitude detector described in [Reference Meyer9].
It must be highlighted that both the circuit and the sensor were not in fact produced. All the results in this framework were entirely based on simulations in CADENCE environment. Also, this analysis was solely focused on the defect coverage enhancement provided by the sensor. Therefore, any open parameters concerning the test itself (required power, response time, etc.) were discarded due lack of information on ATEs.
III. STATISTICAL MODELING
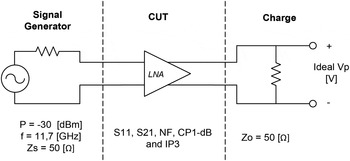
First, a sample of N = 1000 circuits was generated through Monte Carlo's simulation with respect to the technology process and mismatch variations (in the CADENCE SPECTRE RF environment). Figure 2 shows the simulation schematic.
Ideal measurement simulation schematic.

As a result, each one of the five targeted specification parameters along with the test measure are now represented by an N-size statistical sample set (random variables).
However, in order to have a representative sample set for the test efficiency evaluations, our circuit sample needs to be resized to N = 106, giving thus a parts per million (ppm) precision. Given that the Monte Carlo's simulation time is proportional to N and that the first simulation lasted 4 h, a million size sample set simulation would take almost 6 months to be accomplished. Thus, some statistical manipulations are needed.
A) Non-parametric density estimation
By using the Parzen–Rosenblatt window method [Reference Stratigopoulos, Tongbong and Mir10], which consists of a kernel density estimator (KDE), it is possible to estimate the marginal distribution function of each random variable of interest (the five specifications and the measurement). This way, new samples can be generated respecting the probability distributions provided by the first simulation samples. In this case, the KDE employed can be described by the following function:
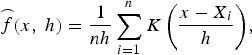 $$\mathop{f}\limits^\frown \lpar x\comma \; h\rpar =\displaystyle{1 \over {nh}}\sum\limits_{i=1}^n {K\left({\displaystyle{{x - X_i } \over h}} \right)}\comma \; \eqno\lpar 1\rpar$$
where  $\mathop{f}\limits^\frown \lpar x\comma \; h\rpar$ in the estimated marginal density function X i is the i–ith sample of the random variable to be estimated, h is the window factor, and K is a kernel function. In fact,
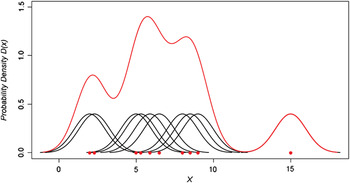
 $\mathop{f}\limits^\frown \lpar x\comma \; h\rpar$ is found by replacing each sample of the random variable by the kernel function rescaled by a factor h (Fig. 3).
KDE procedure example.

In our case, an optimized bandwidth estimator based on the Epanechnikov kernel function was employed to minimize the integrated mean square error of each estimated function (the same is proposed in [Reference Stratigopoulos, Tongbong and Mir10]):
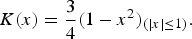 $$K\lpar x\rpar =\displaystyle{3 \over 4}\lpar 1 - x^2 \rpar _{\lpar \left\vert x \right\vert \leq 1\rpar } .\eqno\lpar 2\rpar$$
B) Copula function
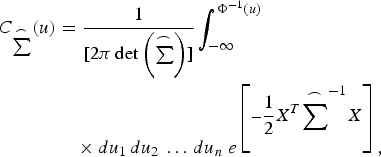
Previously, a KDE method was used to estimate the marginal distribution function of each random variable. In order to take into account the existing correlations between the different variables, a multivariate joint distribution function is built by using a Gaussian Copula function (due to the normal curve resemblance of each marginal distribution) [Reference Nelsen11]:
 $$\eqalign{C_{\mathop{\sum }\limits^\frown } \lpar u \rpar & = \displaystyle{1 \over {\lsqb 2\pi \det \left( \mathop{\sum }\limits^\frown \right) \rsqb }} \vint_{ - \infty }^{\Phi ^{ - 1} \lpar u\rpar } \cr & \quad \times {du_1 \, du_2 \, \ldots \, du_n \; e^{\left[{ - \displaystyle{1 \over 2}X^T {\mathop{\sum }\limits^\frown }^{ - 1} X} \right]}\comma}} \eqno\lpar 3\rpar$$
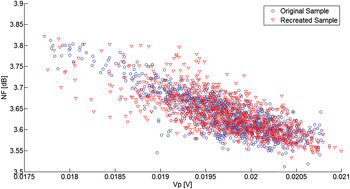
where  $\mathop{\sum }\limits^\frown$ is the Pearson's correlation matrix between each random variable to be correlated. ϕ denotes the standard normal cumulative distribution function and x is the vector containing all the random variables to be correlated [Reference Ramzan and Dabrowski3]. Figure 4 gives us an example of the Copula function accuracy.
Scatter plot of V p and NF of the original sample (blue circles) and of a recreated sample of the same size (red triangles).

Finally, this method allowed us to generate an N = 106 sample within a reasonable time frame (approximately 1 h into the MATLAB environment). Following the same steps, we generated a sample set of the same size for the measurement including the RF DFT sensor (as shown in Fig. 5).
RF DFT sensor measurement simulation schematic.

IV. DATA ANALYSIS
Now that we have the sample sets with the desired accuracy, the specification boundaries (±3σ) are imposed to detect the number of ‘defective’ circuits (defined as D i for the ideal measurement and as D s for the sensor measurement).
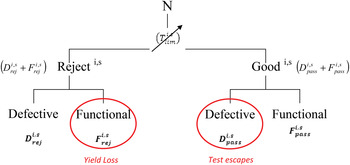
In addition, if taken into account the measurement quality by establishing a cost relation between the ‘functional’ circuits that fail the test ( $F_{{\rm rej}}^{i\comma s}$) and the ‘defective’ circuits that pass the test (
 $D_{{\rm pass}}^{i\comma s}$), the optimal test limits (
 $T_{{\rm lim}}^{i\comma s}$) can be calculated (Fig. 6).
Measurement quality schematic.

In our analysis, we take for granted that, from a quality perspective, it costs 10 times more to sell a ‘defective’ circuit than to reject a functional one 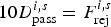 $10D_{{\rm pass}}^{i\comma s}=F_{{\rm rej}}^{i\comma s}$ [Reference Wegener and Kennedy12]. Hence, Table 1 is built for illustration.
D i,s, F reji,s, D passi,s, and T limi,s (for N = 106).

D i,s, the number of defective circuits of the ideal measure setup (i) and of the sensor measure setup (s); F reji,s, functional circuits rejected by the ideal test setup (i) or the sensor test setup (s); D passi,s, defective circuits not detected by the ideal test setup (i) or the sensor test setup (s).
Furthermore, accordingly to [Reference Sunter and Nagi13], two useful probabilities are defined:
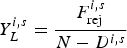 $$Y_L^{i\comma s}=\displaystyle{{F_{{\rm rej}}^{i\comma s} } \over {N - D^{i\comma s} }}\eqno\lpar 4\rpar$$
and
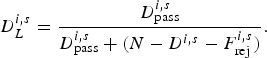 $$D_L^{i\comma s}=\displaystyle{{D_{{\rm pass}}^{i\comma s} } \over {D_{{\rm pass}}^{i\comma s}+\lpar N - D^{i\comma s} - F_{{\rm rej}}^{i\comma s} \rpar }}.\eqno\lpar 5\rpar$$
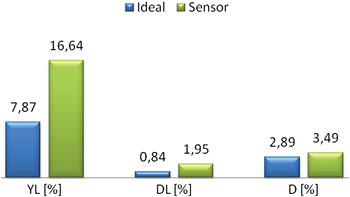
Equation (4) represents the ratio between the number of ‘functional’ circuits that fail the test and the number of ‘functional’ circuits and (5) represents the ratio between the number of ‘faulty’ circuits that pass the test and the number of circuits that pass the test (yield loss and defect level, respectively). According to the definitions provided in (4) and (5), the yield loss and defect level are presented in Fig. 7.
Defective circuits, yield losses, and defect levels for both measurements.

Note that  $Y_L^I$ and
 $D_L^I$ are not 0% since the ideal measurement is not perfectly correlated with all of the target specifications. Also, we can notice that the noise and dispersion added by the ‘real’ sensor considerably degrade both the yield loss and the defect level (with respect to the lower limits of
 $Y_L^S$ and
 $D_L^s$ settled by the ideal measurement).
V. FIGURE OF MERIT
Hence, by generalizing the above procedure, it is possible to establish a basis of comparison among sensor architectures by evoking the ratio between the output random variable (obtained from the schematics shown in Fig. 2) and a new random variable, measured at the output of the same schematic but considering that the sensor is ‘ideal’ (not affected by process dispersion, noise, and ripple):
 $$\tilde F=\displaystyle{{\widetilde{V_{{\rm out}}^R }} \over {\widetilde{V_{{\rm out}}^I }}}\comma \; \eqno\lpar 6\rpar$$
where  $\widetilde{V_{{\rm out}}^R }$ is the random variable representing the ‘real’ sensor output and
 $\widetilde{V_{{\rm out}}^I }$ is the random variable representing the output of the noiseless and dispersionless sensor. By assuming that the sensor is described by a first-order polynomial (which is reasonable, if it is operating in a linear region),
 $\tilde F$ may be rewritten as
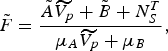 $$\tilde F=\displaystyle{{\tilde A\widetilde{V_p }+\tilde B+N_S^T } \over {\mu _A \widetilde{V_p }+\mu _B }}\comma \; \eqno\lpar 7\rpar$$
where  $\tilde A$ and
 $\tilde B$are the random variables representing the sensor gain and offset, respectively,
 $N_S^T$ is the total integrated noise at the sensor output (when connected to the CUT),
 $\tilde V_p$ is the random variable denoting the measurement at the probing point (ideal V p) and μ A and μ B represent the statistical means of the sensor gain and offset, respectively. Thus, by expressing each random variable by dispersion function
 $\tilde D$ around his statistical mean μ
 $$\tilde F=\displaystyle{\matrix{\lsqb \mu _A+\tilde D\lpar A\rpar \rsqb \lsqb \mu _{V_p }+\tilde D\lpar V_p \rpar \rsqb+\lsqb \mu _B+\tilde D\lpar B\rpar \rsqb +N_S^T \hfill} \over {\mu _A \lsqb \mu _{V_p }+\tilde D\lpar V_p \rpar \rsqb +\mu _B }}.\eqno\lpar 8\rpar$$
Then, by reorganizing (8), we obtain
 $$\tilde F=1+\displaystyle{{\mu _{V_p } \tilde D\lpar A\rpar +\tilde D\lpar A\rpar \tilde D\lpar V_p \rpar +\tilde D\lpar B\rpar +N_S^T } \over {\lpar \mu _A \mu _{V_p }+\mu _B \rpar +\mu _A \tilde D\lpar V_p \rpar }}.\eqno\lpar 9\rpar$$
As those distributions can be roughly represented by the normal law due to their Gaussian-like form, it is straightforward to show that  $\tilde F$ can be approximated as
 $$\tilde F \cong N\lpar 1\comma \; \sigma _F \rpar \comma \; \eqno\lpar 10\rpar$$
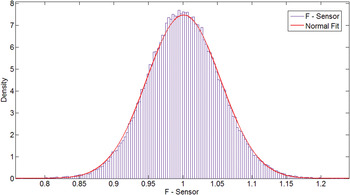
where N(μ, σ) represents a normal distribution with mean μ and standard deviation σ. Note that  $\tilde F$ naturally results in a Gaussian distribution function with a unitary mean and an σ F standard deviance. As an example, Fig. 8 shows the
 $\tilde F$ function given by the analysis of the sensor employed in our case study (and proving the validity of the approximation).
 $\tilde F$ function distribution of our case-study (example).

Lastly, the figure of merit may be expressed by the following constant:
 $$F_m=- 10\log \lpar \sigma _F \rpar .\eqno\lpar 11\rpar$$
The logarithmic operator was employed due to the low order values of σ F. Hence, for an ideal sensor, F m → ∞. Although, in the real case, F m will decrease as the sensor robustness decreases. We note that as F m reaches infinity, the yield loss and defect level probabilities will converge on those from the ideal measurement. Hence, it is possible to see that F m represents the signal-to-noise ratio between the dispersion of the ideal measurement and the total contribution of noise and dispersion at the sensor output.
In order to further evaluate this behavior, a graph was plotted by varying a ‘generic’ sensor dispersion, which was mathematically achieved by adding a Gaussian noise source at the ‘ideal’ sensor output
 $$\widetilde{V_{{\rm out}}^{{\rm sim}} }\lpar \sigma _{{\rm sim}} \rpar =\widetilde{V_{{\rm out}}^I }+N\lpar 0\comma \; \sigma _{{\rm sim}} \rpar .\eqno\lpar 12\rpar$$
Therefore, by varying σ sim (the sum of the simulated dispersion and noise amplitudes at the ideal sensor output approximated by a normal distribution), different values of  $Y_L^{{\rm sim}}$ and
 $D_L^{{\rm sim}}$ may be obtained. In addition, by replacing (12) in (6), the corresponding F m values may be obtained
 $$\tilde F\lpar \sigma _{{\rm sim}} \rpar =1+\displaystyle{{N\lpar 0\comma \; \sigma _{{\rm sim}} \rpar } \over {\lpar \mu _A \mu _{V_p }+\mu _S \rpar +\mu _A \tilde D\lpar V_p \rpar }}.\eqno\lpar 13\rpar$$
Note that the sensor input impedance was considered much greater than the load impedance. Lastly, by plotting the normalized values of  $Y_L^{{\rm sim}}$ and
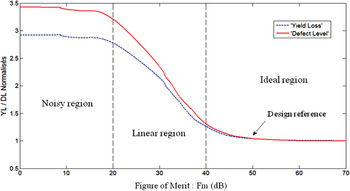
 $D_L^{{\rm sim}}$(with respect to the ideal measurement lower limits) in function of F m, Fig. 9 is obtained.
Normalized yield loss and defect level with respect to F m.

As expected earlier, the curve presents an ‘ideal’ region in which  $Y_L^s \approx Y_L^i$ and
 $D_L^s \approx D_L^i$, a middle region where
 $Y_L^S$ and
 $D_L^s$ decreases almost linearly with respect to F m and a ‘noisy’ region where the dispersion and/or noise are so great (low values of F m) that the test is no longer capable of distinguishing the CUT deviations from the ‘noisy’ sensor (where
 $Y_L^S$ and
 $D_L^s$ becomes constant). Note that for our case study, there is no benefit in increasing the sensor robustness higher than 50 dB, so this value can be used as a prior reference in the early stages of the DFT sensor design. Also, the F m factor may be used to rapidly compare DFT architectures designed exclusively for a given application (CUT).
One may alternatively consider working with a simpler and less precise figure of merit, which can be easier and less time consuming to obtain (Fig. 10).
Alternative figure of merit simulation schematic.

This time, the CUT is replaced by a signal source whose output impedance equals the CUT one (or the system reference impedance) and whose peak amplitude value has a E[V Pin] = μ in and a σ in = 0 (a perfect deterministic signal). Hence, the alternative figure of merit (denoted by  $\tilde F$) is obtained by
 $$\tilde F^{\prime}=\displaystyle{{\widetilde{V_{{\rm out}}^{R^{\prime}}}} \over {\widetilde{V_{{\rm out}}^{I^{\prime}} }}}.\eqno\lpar 14\rpar$$
Likewise,  $\widetilde{V_{{\rm out}}^R }$ is the ‘real’ (noisy) sensor output and
 $\widetilde{V_{{\rm out}}^I }$ is the ‘ideal’ sensor output (noiseless and dispersion less). Hence, by making the same assumptions used beforehand (that the sensor is working in a linear region and that both signals roughly resemble Gaussian distributions), we obtain similar results
 $$\tilde F^{\prime} \cong N\lpar 1\comma \; \sigma _F \rpar \eqno\lpar 15\rpar$$
and
 $$F_{\rm m} ^{\prime}=- 10\log \lpar \sigma _F \rpar .\eqno\lpar 16\rpar$$
First, it must be highlighted that this alternative figure is not as accurate as the first one because it does not take into account the CUT output integrated noise and neither the product between the CUT dispersion and the sensor gain dispersion (the term  $\tilde D\lpar A\rpar \tilde D\lpar V_p \rpar$ from previous analysis).
Second, even with the absence of a CUT, all the compared sensors must be operating in the same conditions (frequency, temperature, supply, fabrication process, etc.) in order to make the comparison valid.
And finally, it is not reasonable to compare values of F m with values of  $F_m^{\rm \prime }$ because they do not result from the same statistical analysis.
VI. CONCLUSION
One of the main difficulties found in RF DFT topologies is the design of robust sensors (with respect to process dispersion) that can accurately measure the CUT vital nodes while being non-intrusive and adding as little noise as possible. In this work, a new methodology is proposed to precisely evaluate the noise and dispersion caused by the use of sensors in DFT topologies. In addition, it can also be used to obtain a prior reference for the early stages of the DFT sensor design, which can greatly reduce the number of interactions to achieve a satisfactory result during the design flow. Lastly, two figures of merit are proposed to compare the robustness of different DFT sensor architectures for a given test topology. Both the proposed figures of merit can be especially useful when evaluating sensor topologies and also provide a user-friendly orientation in the design process. Nevertheless, special attention is still required because they do not take into account any other characteristic that is not related to the sensors dispersions or noise (power overheads, surface costs, and response times).
ACKNOWLEDGEMENTS
The authors would like to thank Olivier Tesson (engineer at NXP Semiconductors) for his corrections and comments; Pedro Wilson A.F. Neto (graduate student at École Supérieure d'Ingénieurs de Caen) for his most valuable discussions; and Almir Mesadri and Vera K. Mesadri for their ever present support.
 Conrado K. Mesadri was born in Curitiba, Paraná, Brazil, on May 7, 1988. In 2006, he started his undergraduate studies in Electric Engineering at the Federal University of Paraná (UFPR), Curitiba, Paraná, Brazil. In 2009, he was granted with a scholarship from the BRAFITEC (an international exchange program between France and Brazil) and he graduated from the Engineering School ENSICAEN, Caen, France. During May 2010 to September 2010, he completed the training period at LaMIPS (Caen, France), a common research laboratory between CRISMAT, PRESTO Engineering and NXP Semiconductors, working on Radiofrequency Built-In-Self-Test (RF BIST) and Analog Design for Test (ADFT) applications. His current research interests include the design of radiofrequency low-power analog circuits, the design of RF BIST/DFT sensors, applied artificial neural networks and state-of-the-art A/D converters.
 Aziz Doukkali received the Ph.D. degree from the University of Montpellier, France, in 1990. During 1990–2000, he joined the research group on superconductive materials at the CRISMAT laboratory of Caen. He was involved in various research activities on the development of thin films by molecular beam epitaxy (MBE). In 2000, he joined the LAMIP. His research activities cover the techniques of failure analysis in near-field microscopy (AFM) and ESD. Presently, he is working in analog design of integrated circuits for wireless communication.
 Philippe Descamps received the Ph.D. degree from the University of Lille, France, in 1992. During 1989–1999, he joined the research group Integrated Systems at the Institut d'Electronique, de Microélectronique et de Nanotechnologies (IEMN), Villeneuve d'Ascq, France, where he was involved in microwave research activities mainly guided by the characterization, simulation, and design, and by the realization of field-effect devices in high-frequency ranges for automotive applications and telecommunication systems. In 1999, he became a full Professor at the Ecole Nationale Supérieure d'Ingénieurs de Caen (ENSICAEN), France, where he currently heads the Mixed Research Laboratory of Microelectronics and Physics of Semiconductors (LaMIPS). He is mainly involved in high frequencies characterization, modelization of microwave components and of the design of integrated circuits for telecommunication applications.
 Christophe Kelma graduated from the Engineering School ENSICAEN (France Normandy) in 1991. He started as an RF Test Engineer in 1992 at Philips Semiconductors. He took the lead of a Test Development and Product Engineering Team for Radio communication ICs in 1996, which aimed at developing the test tools (Wafer and Package) of RF transceivers and industrializing in Production centers. Since 2002, his main focus is on Design for Test and BIST for RF devices, where he proposes new concepts to the different business lines to reduce the test costs. Since 2006, he carries on his activities within NXP as a Senior Principle RF-DFT/Test Expert.