



1. Introduction
Fluidic devices based on networks of jets interacting with each other, as X-junction or cross-slot flows, exhibit a series of complex phenomena, which may collaborate, giving rise to various physical instabilities. The understanding of their dynamical properties may lead to new building blocks of fluidic networks, that can be used for mixing or connecting purposes, such as, for instance, purely hydrodynamic DC–AC converters. While in many engineering applications, instabilities are seen as endangering features to be avoided, resulting in entire parametric regions to be discarded or in the need for efficient control strategies, the example of fluidic devices illustrates a radically different view: symmetry-breaking and dynamic (resulting in self-sustained oscillations) bifurcations can be harnessed for the design of new elementary building blocks for microfluidic circuitry, like DC–AC converters or switching devices, with promising applications in their automation.
Recently Bertsch et al. (Reference Bertsch, Bongarzone, Duchamp, Renaud and Gallaire2020a,Reference Bertsch, Bongarzone, Yim, Renaud and Gallaireb) provided a detailed experimental and numerical description of the self-sustained oscillatory regime induced by the interaction of two impinging jets in microscale feedback-free fluidic devices operating in laminar flow conditions. While this work presents some similarities with the experimental observations proposed by Tesař (Reference Tesař2009) Denshchikov, Kondrat'ev & Romashov (Reference Denshchikov, Kondrat'ev and Romashov1978) and Denshchikov et al. (Reference Denshchikov, Kondrat'ev, Romashov and Chubarov1983), it differs from the latter for the dimensions (micrometre vs. centimetre range) and the operating conditions (laminar vs. turbulent jets). Bertsch et al. (Reference Bertsch, Bongarzone, Duchamp, Renaud and Gallaire2020a) studied the evolution of the self-oscillation frequency when the main geometric parameters of the cavity were changed. The frequency was shown to be proportional to the averaged flow velocity imposed at the symmetric inlets and inversely proportional to the distance between the jets. The oscillatory instability was experimentally seen to be of a supercritical nature with oscillations starting above a precise instability threshold. Although several plausible candidates were proposed by Bertsch et al. (Reference Bertsch, Bongarzone, Duchamp, Renaud and Gallaire2020a), no physical mechanism could be precisely identified from which the self-sustained oscillations would originate.
Cross-slot flows are also known to show hysteresis. Burshtein, Shen & Haward (Reference Burshtein, Shen and Haward2019) experimentally showed that hysteretic behaviours due to symmetry-breaking transitions appear in X-junction flows with proper geometrical parameters, for which no oscillations are observed. There are similarities in the microchannel geometries between the case described by Burshtein et al. (Reference Burshtein, Shen and Haward2019) and Bertsch et al. (Reference Bertsch, Bongarzone, Duchamp, Renaud and Gallaire2020a), with microchannels crossing at right angles in both cases and liquid flows at relatively low values of the Reynolds number. However, in the geometry considered by Burshtein et al. (Reference Burshtein, Shen and Haward2019) all channels have comparable dimension, whereas in Bertsch et al. (Reference Bertsch, Bongarzone, Duchamp, Renaud and Gallaire2020a) there are two facing narrow channels which open into wider channels. In Bertsch et al. (Reference Bertsch, Bongarzone, Duchamp, Renaud and Gallaire2020a) oscillations were observed only in the cases where the wider channels have dimensions at least three times larger than the narrow channels, which differs significantly from Burshtein et al. (Reference Burshtein, Shen and Haward2019). Such a consideration underlines the importance of the distance separating the inlets in cross-slot geometries in the destabilization mechanism.
The present work aims to answer two main questions arising from different observations presented in Bertsch et al. (Reference Bertsch, Bongarzone, Duchamp, Renaud and Gallaire2020a) and Burshtein et al. (Reference Burshtein, Shen and Haward2019): (i) to identify the physical mechanism governing the self-sustained oscillatory regime studied in Bertsch et al. (Reference Bertsch, Bongarzone, Duchamp, Renaud and Gallaire2020a); (ii) to investigate the existence of a range of geometrical parameters in which steady symmetry-breaking conditions could directly interact with this dynamic instability.
With these objectives, we consider here a two-dimensional (2-D) X-junction with straight lateral channels and two symmetric inlets, where a fully developed flow is imposed, separated by a certain distance. Despite the simplistic geometry, a 2-D flow not only allows one to perform a faster computational analysis but it also often makes it possible to capture the main physical features of interest of the three-dimensional (3-D) problem. Since the principal geometrical parameter, the distance between the two jets, is kept in this crude dimensional reduction from three to two dimensions, we may expect that our 2-D analysis reveals the dominant physical mechanism behind the oscillatory instability observed in three dimensions. Steady symmetry-breaking instabilities are also expected in two dimensions (Pawlowski et al. Reference Pawlowski, Salinger, Shadid and Mountziaris2006; Liu et al. Reference Liu, Wang, Wan, Ma and Sun2016), even if of a different nature than the intrinsically 3-D one presented in Burshtein et al. (Reference Burshtein, Shen and Haward2019). An exhaustive stability analysis is here conducted using the tools of the classic linear global stability and sensitivity analysis as well as the weakly nonlinear theory based on amplitude equations, whose fundamental aspects are briefly summarized by Meliga, Chomaz & Sipp (Reference Meliga, Chomaz and Sipp2009a).
In the following we recall from Meliga et al. (Reference Meliga, Chomaz and Sipp2009a) only the salient points: when a steady flow loses its stability, e.g. owing to the variation of a control parameter, it bifurcates towards a new state, that may be either steady or unsteady. If a single eigenmode is responsible for the instability, the weakly nonlinear dynamics close to the threshold will occur in the one-dimensional slow manifold. The only degree of freedom is then the amplitude of the unstable eigenmode, which is governed by an amplitude equation. When multiple eigenmodes are simultaneously responsible for the destabilization of the steady base flow, the dimension of the slow manifold is equal to the number of bifurcating modes, and the normal form involves one degree of freedom per bifurcating mode, leading to a system of coupled amplitude equations. Such cases are known as multiple codimension bifurcations and require the tuning of multiple independent control parameters for the various global modes to be simultaneously neutral. The normal form describes the weakly nonlinear interactions between unstable modes and reduces the dynamics of the whole fluid system to a low-dimensional model.
As stated above, in our numerical investigation we opt for a fully developed inlet flow. This choice is made by analogy with Bertsch et al. (Reference Bertsch, Bongarzone, Duchamp, Renaud and Gallaire2020a), but in contradistinction with previous work by Pawlowski et al. (Reference Pawlowski, Salinger, Shadid and Mountziaris2006), who carried out a thorough stability analysis of the very same flow configuration, with the only difference that a plug inlet flow was examined. These authors discovered the existence of a steady symmetry-breaking global mode and an oscillating global mode, which can be unstable in different regions of a stability map, given as Reynolds number versus aspect ratio. However, they did not discuss the origin of the oscillatory regime and they did not report the presence of hysteretic behaviour.
The present paper is organized as follows. In § 2 the flow configuration and the governing equations describing the fluid motion inside a 2-D microfluidic cavity with an imposed fully developed inlet flow are introduced. In § 3 the numerical approaches adopted are described. In § 4 the steady symmetric base flow is determined, while the tools of the linear global stability analysis are employed to derive the associated stability chart, where the two control parameters, Reynolds number and aspect ratio, are varied in a wide range. The nonlinear global mode interaction emerging from the stability analysis is then discussed in § 5 making use of the weakly nonlinear theory and the multiple scale technique. The resulting bifurcation diagram is validated in § 6. Sensitivity analyses are carried out in § 7, which is devoted to the understanding of the physical mechanism behind the various instabilities observed. We finally analyse the effect of a different inlet velocity profile by applying the weakly nonlinear model to the flow case of plug inlet profiles, revisiting the analysis of Pawlowski et al. (Reference Pawlowski, Salinger, Shadid and Mountziaris2006). Conclusions are presented in § 9.
2. Flow configuration and governing equations
Let us consider the 2-D X-junction (also called cross-junction) presented in figure 1. An incompressible fluid with density  $\rho$ and dynamic viscosity
 $\mu$ enters the device through two facing inlets of width
 $w$, denoted by
 $\partial \varOmega _i$, and it is allowed to flow out along the two symmetric arms of the main lateral channel. The two symmetric inlets mimic the action of two inlet channels separated by a distance
 $s$ to create two facing jets when they reach the lateral channel. Outlets,
 $\partial \varOmega _o$, are provided at both ends of the channel, at a distance
 $L_{out}$, far away from the intersection. In figure 1,
 $\varOmega$ denotes the fluid domain, while
 $U$ is the average velocity of the fluid at the inlet channels. Taking advantage of the geometric symmetries of this microfluidic oscillator, the computational domain can be reduced to a quarter of the full domain, with
 $y$- and
 $x$-axes of symmetry
 $\partial \varOmega _v$ and
 $\partial \varOmega _h$, respectively. Proper boundary conditions for the fluid problem, listed in §§ 4 and 5, are then imposed at
 $\partial \varOmega _v$ and
 $\partial \varOmega _h$. As sketched in figure 1, a fully developed flow is imposed at the inlets at
 $y=\pm s/2$. This assumption, removing the influence of the inlet channel length, allows us to reduce the number of geometrical parameters, simplifying the parametric analysis.
Microfluidic oscillator cavity with straight output channels explored in this work. Notation: inlet width  $w$, gap size
 $s$, overall length
 $2L_{out}$, walls
 $\partial \varOmega _w$, outlets
 $\partial \varOmega _o$,
 $x$-axis of symmetry at
 $y=0$,
 $\partial \varOmega _h$ and
 $y$-axis of symmetry at
 $x=0$,
 $\partial \varOmega _v$. Here
 $U$ denotes the mean value of the velocity profile imposed at the inlets,
 $\partial \varOmega _i$.

The introduction of the dimensionless variables (the star denotes the dimensional quantities)
 \begin{equation} x=\frac{x^*}{w},\quad y=\frac{y^*}{s},\quad u=\frac{u^*}{U},\quad v=\frac{v^*}{U}, \quad p=\frac{p^*}{\rho U^2},\quad t=\frac{t^*}{w/U} \end{equation}
leads to the definition of the aspect ratio  $AR=s/w$ and of the nabla operator,
 $\boldsymbol {\nabla }_{\textit {AR}}=\{{\partial }/{\partial x}, ({1}/{AR})({\partial }/{\partial y})\}^{\textrm {T}}$. The fluid motion within the microfluidic oscillator cavity,
 $\varOmega$, is governed by the 2-D incompressible Navier–Stokes equations, whose non-dimensional form reads as
 \begin{equation} \frac{\partial \boldsymbol{u}}{\partial t}+(\boldsymbol{u}\boldsymbol{\cdot}\boldsymbol{\nabla}_{\textit{AR}})\boldsymbol{u}+\boldsymbol{\nabla}_{\textit{AR}} \,p -\frac{1}{Re}\varDelta_{\textit{AR}}\boldsymbol{u}=0, \end{equation}
 \begin{equation}\boldsymbol{\nabla}_{\textit{AR}}\boldsymbol{\cdot}\boldsymbol{u}=0. \end{equation}
In (2.2) and (2.3),  $\boldsymbol {u}=\{u,v\}^{\textrm {T}}$ is the velocity field,
 $p$ is the pressure field and
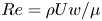 $Re=\rho U w/\mu$ is the Reynolds number. The no-slip boundary condition is imposed at the rigid solid wall,
 $\partial \varOmega _w$,
 $\boldsymbol {u}|_{\partial \varOmega _w}=0$, while an outflow boundary condition is imposed at the outlet,
 $\partial \varOmega _o$,
 $(-p\boldsymbol {I}+({1}/{Re})\boldsymbol {\nabla }_{\textit {AR}}\boldsymbol {u})\boldsymbol {\cdot }\boldsymbol {n}=0$, where
 $\boldsymbol {n}$ is the unit normal to
 $\partial \varOmega _o$ and
 $\boldsymbol {I}$ is the identity tensor. At the inlet,
 $\partial \varOmega _i$, a fully developed parabolic velocity profile is imposed, i.e.
 \begin{equation} \boldsymbol{u}|_{\partial\varOmega_i}=\left\{0,-\frac{3}{2}(1-4x^2)\right\}^{\textrm{T}}. \end{equation}
3. Numerical approach
Two different numerical approaches are adopted in the present paper. The numerical scheme used to derive the global stability chart, § 4, to analyse the weakly nonlinear global mode interaction, § 5, and to perform sensitivity analysis, § 7, is a finite element method based on the FreeFem++ software (Hecht et al. Reference Hecht, Pironneau, Hyaric and Ohtsuka2011). The mesh refinement is controlled by the vertex densities on both external and internal boundaries. Regions where the mesh density varies are depicted in figure 2. The unknown velocity and pressure fields  $\{\boldsymbol {u},p\}^{\textrm {T}}$ are spatially discretized using a basis of Taylor–Hood elements (
 $P_2$,
 $P_1$). The matrix inverses are computed using the UMFPACK package (Davis & Duff Reference Davis and Duff1997). The steady base flow is obtained by the classic iterative Newton method, while eigenvalue calculations are performed using the ARPACK package (Lehoucq, Sorensen & Yang Reference Lehoucq, Sorensen and Yang1998). For other details, see Sipp & Lebedev (Reference Sipp and Lebedev2007), Meliga et al. (Reference Meliga, Chomaz and Sipp2009a), Meliga & Gallaire (Reference Meliga and Gallaire2011) and Meliga, Gallaire & Chomaz (Reference Meliga, Gallaire and Chomaz2012). With reference to figure 2, five different meshes, denoted M1–M5, exhibiting different boundary vertex densities,
 $n_i$, have been used to assess convergence in the numerical result. In the following we will focus on the mesh M5 to present all results. A detailed convergence analysis of meshes M1–M5 is given in appendix A.
Computational domain considered in the global stability analysis, weakly nonlinear study and sensitivity analysis. Here  $w=1$,
 $L_2=5w$,
 $L_3=20w$,
 $L_{out}=70w$ and
 $s=1$. Number of elements per unit length used for the various line with different thickness:
 $n_1$,
 $n_2$,
 $n_3$ and
 $n_4$.

The results obtained from the weakly nonlinear investigation are then compared with direct numerical simulations (DNS) in § 6. The open-source code Nek5000 (Lottes, Fischer & Kerkemeier Reference Lottes, Fischer and Kerkemeier2008) has been used to perform the DNS. The spatial discretization is based on the spectral element method. The full 2-D geometry (without imposing any symmetry conditions) is divided in macro boxes; each macro box is then characterized by an imposed number of quadrilateral elements, along the two Cartesian coordinates  $x$ and
 $y$, within which the solution is represented in terms of Nth-order Lagrange polynomials interpolants, based on tensor product arrays of Gauss–Lobatto–Legendre quadrature point in each spectral element; the common algebraic
 $P_N/P_{N-2}$ scheme is implemented, with
 $N$ fixed to 7 for velocity and 5 for pressure. The domain is thus discretized with a structured multiblock grid consisting of 4920 spectral elements, which largely guarantees the convergence. The time integration is handled with the semi-implicit method, already implemented in Nek5000; the linear terms in (2.3)–(2.2) are treated implicitly adopting a third-order backward differentiation formula, whereas the advective nonlinear term is estimated using a third-order explicit extrapolation formula. The semi-implicit scheme introduces restriction on the time step (Karniadakis, Israeli & Orszag Reference Karniadakis, Israeli and Orszag1991); therefore, an adaptive time step is set to guarantee the Courant–Friedrichs–Lewy constraint. See Bertsch et al. (Reference Bertsch, Bongarzone, Duchamp, Renaud and Gallaire2020a) for more details.
4. Steady base flow and linear global stability analysis
The flow field  $\boldsymbol {q}=\{\boldsymbol {u},p\}^{\textrm {T}}$ is decomposed in a steady base flow,
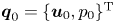 $\boldsymbol {q}_0=\{\boldsymbol {u}_0,p_0\}^{\textrm {T}}$ and a small perturbation
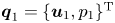 $\boldsymbol {q}_1=\{\boldsymbol {u}_1,p_1\}^{\textrm {T}}$, of infinitesimal amplitude
 $\epsilon$.
4.1. Steady base flow
The base flow, 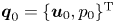 $\boldsymbol {q}_0=\{\boldsymbol {u}_0,p_0\}^{\textrm {T}}$, is sought as a steady solution of the nonlinear Navier–Stokes equations,
 \begin{equation} (\boldsymbol{u}_0\boldsymbol{\cdot}\boldsymbol{\nabla}_{\textit{AR}})\boldsymbol{u}_0+\boldsymbol{\nabla}_{\textit{AR}} \,p_0-\frac{1}{Re}\varDelta_{\textit{AR}}\boldsymbol{u}_0=\boldsymbol{0},\quad \boldsymbol{\nabla}_{\textit{AR}}\boldsymbol{\cdot}\boldsymbol{u}_0=0, \end{equation}
with the boundary conditions,
 \begin{align} \boldsymbol{u}_0|_{\partial\varOmega_w}=\boldsymbol{0},\quad \left.\left({-}p_0\boldsymbol{I}+\frac{1}{Re}\boldsymbol{\nabla}_{\textit{AR}}\boldsymbol{u}_0\right)\boldsymbol{\cdot}\boldsymbol{n}\right|_{\partial\varOmega_o}=0,\quad \boldsymbol{u}_0|_{\partial\varOmega_i}=\left\{0,-\frac{3}{2}(1-4x^2)\right\}^{\textrm{T}}. \end{align}
The steady base-flow velocity fields,  $u_0(x,y)$ and
 $v_0(x,y)$, are characterized by symmetry and antisymmetry properties with respect to the
 $y$- and
 $x$-axes of symmetry,
 $\partial \varOmega _v$ and
 $\partial \varOmega _h$, i.e.
 \begin{gather} u_0(x,y)=u_0(x,-y)={-}u_0({-}x,y), \end{gather}
 \begin{gather}v_0(x,y)={-}v_0(x,-y)=v_0({-}x,y), \end{gather}
which translate in the following boundary conditions imposed at  $\partial \varOmega _{h}$ and
 $\partial \varOmega _{v}$:
 \begin{equation} v_0|_{\partial\varOmega_{h}}=0,\quad \left.\frac{\partial u_0}{\partial y}\right|_{\partial\varOmega_{h}}=0,\qquad u_0|_{\partial\varOmega_{v}}=0,\quad \left.\frac{\partial v_0}{\partial x}\right|_{\partial\varOmega_{v}}=0. \end{equation}
An approximate guess solution satisfying the required boundary conditions is first obtained by solving the associated Stokes problem, where the advective term is neglected. The solution of the steady nonlinear equation,  $\boldsymbol {q}_0$, is then obtained using an iterative Newton method (Barkley, Gomes & Henderson Reference Barkley, Gomes and Henderson2002; Barkley Reference Barkley2006). Here the iterative process is carried out until the
 $L^2$-norm of the residual of the governing equations for
 $\boldsymbol {q}_0$ becomes smaller than
 $1\times 10^{-12}$.
Figure 3 shows the symmetric spatial structure of the magnitude of the steady velocity field for  $Re=22.65$ and
 $AR=6.98$. As observed in figure 3, the
 $y$-velocity component is dominant in the central region, near the two inlets. The two facing jets collide and the fluid is repulsed and advected downstream, towards the two outlets. A stagnation point is thus present at
 $x=y=0$ owing to the symmetry properties. We also observe the presence of four symmetric recirculation regions close to the channel inlets and resulting from the presence of walls, where a no-slip boundary condition is enforced. Heading towards the channel outlets, the flow approaches a fully developed flow. The present base-flow configuration is qualitatively comparable to that recently observed in the 3-D experimental and numerical investigations carried out by Bertsch et al. (Reference Bertsch, Bongarzone, Duchamp, Renaud and Gallaire2020a).
Steady base flow for  $Re=22.65$ and
 $AR=6.98$. Colour map: magnitude of the velocity field. White lines: streamlines associated with the steady base flow. Red dashed lines: boundaries of the four symmetric recirculation regions. The solution in the full flow domain is rebuilt using the symmetry properties. Only the central portion,
 $x\in [-25, 25]$, is shown here.

4.2. Global eigenmode analysis
At leading order in  $\epsilon$,
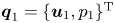 $\boldsymbol {q}_1=\{\boldsymbol {u}_1,p_1\}^{\textrm {T}}$ is an unsteady solution of the linearized Navier–Stokes equations around the
 $\epsilon ^0$-order solution (steady base flow),
 \begin{equation} \frac{\partial \boldsymbol{u}_1}{\partial t}+(\boldsymbol{u}_0\boldsymbol{\cdot}\boldsymbol{\nabla}_{\textit{AR}})\boldsymbol{u}_1 +(\boldsymbol{u}_1\boldsymbol{\cdot}\boldsymbol{\nabla}_{\textit{AR}})\boldsymbol{u}_0+\boldsymbol{\nabla}_{\textit{AR}} \,p_1-\frac{1}{Re}\varDelta_{\textit{AR}}\boldsymbol{u}_1=\boldsymbol{0}, \quad \boldsymbol{\nabla}_{\textit{AR}}\boldsymbol{\cdot}\boldsymbol{u}_1=0, \end{equation}
with the boundary conditions,
 \begin{equation} \boldsymbol{u}_1\boldsymbol{\cdot}\boldsymbol{n}|_{\partial\varOmega_w}=\boldsymbol{0},\quad \left.\left({-}p_1\boldsymbol{I}+\frac{1}{Re}\boldsymbol{\nabla}_{\textit{AR}}\boldsymbol{u}_1\right)\boldsymbol{\cdot}\boldsymbol{n}\right|_{\partial\varOmega_o}=0, \quad \boldsymbol{u}_1|_{\partial\varOmega_i}=\boldsymbol{0}. \end{equation}
The system can be written in a compact form as
 \begin{equation} (\mathcal{B}\partial_t+\mathcal{A})\boldsymbol{q}_1=\boldsymbol{0}, \end{equation}
where the matrices  $\mathcal {A}$ and
 $\mathcal {B}$ read as
 \begin{equation} \mathcal{A} =\begin{pmatrix} \mathcal{C}_{\textit{AR}}(\boldsymbol{u}_0, \boldsymbol{\cdot})-\dfrac{1}{Re}\varDelta_{\textit{AR}} & \boldsymbol{\nabla}_{\textit{AR}}\\ \boldsymbol{\nabla}_{\textit{AR}}^{\textrm{T}} & 0 \end{pmatrix},\quad \mathcal{B} = \begin{pmatrix} \mathcal{I} & 0 \\ 0 & 0 \end{pmatrix}, \end{equation}
with  $\mathcal {I}$ being the identity matrix and
 $\mathcal {C}_{\textit {AR}}$ the
 $\epsilon ^0$-order symmetric advection operator,
 $\mathcal {C}_{\textit {AR}}(\boldsymbol {a},\boldsymbol {b})=(\boldsymbol {a}\boldsymbol {\cdot } \boldsymbol {\nabla }_{\textit {AR}})\boldsymbol {b}+(\boldsymbol {b}\boldsymbol {\cdot }\boldsymbol {\nabla }_{\textit {AR}})\boldsymbol {a}$. We thus look for a first-order solution which takes the normal mode form
 \begin{equation} \boldsymbol{q}_1=\hat{\boldsymbol{q}}_1\,\textrm{e}^{(\sigma+\text{i}\omega) t}+\text{c.c.}, \end{equation}
where c.c. denotes the complex conjugate. Substituting (4.10) in (4.8), the  $\epsilon$-order system reduces to the generalized eigenvalue problem
 \begin{equation} [(\sigma+\text{i}\omega)\mathcal{B}+\mathcal{A}]\hat{\boldsymbol{q}}_1=\boldsymbol{0}. \end{equation}
In figure 4 the eigenvalues are displayed for different Reynolds numbers and aspect ratio values. In order to build the full eigenvalue spectrum using the reduced computational domain, we explored all the possible symmetries and antisymmetries of the perturbation velocity field  $\boldsymbol {u}_1$ by imposing different axis boundary conditions analogous to (4.5). From the stability chart displayed in the
 $(Re,AR)$ plane of figure 4(b), it emerges that the steady base flow is stable below a critical aspect ratio, whose value is found to be approximately
 $AR\approx 1.75$ for a Reynolds number
 $Re=230$ (maximum value investigated in the present study). Analogously, the base flow is stable below a Reynolds number
 $Re\approx 8$ for an aspect ratio
 $AR=70$ (maximum value considered here). As depicted in figure 4(b), a codimension-2 point,
 $C_2$, is found for
 $Re=Re_{C_2}=22.65$ and
 $AR=AR_{C_2}=6.98$, where two different global modes, mode
 $A$, non-oscillating, and mode
 $B$, oscillating and characterized by a Strouhal number
 $St_{C_2}=f w/U=\omega /2{\rm \pi} =0.016$, are simultaneously marginally stable. This evidence motivates the weakly nonlinear analysis (WNL) presented in § 5, which aims to investigate the interaction between modes
 $A$ and
 $B$. The presence of a second steady mode, denoted by
 $C$, is also observed. From the linear analysis, a second codimension-2 point appears between the oscillating mode
 $B$ and the second steady mode
 $C$, however, at a parameter setting
 $(Re,AR)=(62,4)$, mode
 $A$ is far above its threshold, which jeopardizes the use of the linear and weakly nonlinear stability tools. Further considerations about the effect of the second steady mode
 $C$ are provided in appendix B, while hereinafter we will focus on global modes
 $A$ and
 $B$ and their global interactions.
(a) Eigenvalues displayed in the  $(\sigma ,\omega )$ plane for
 $Re=Re_{C_2}=22.65$ and
 $AR=AR_{C_2}=6.98$. A pair of complex eigenvalues, denoted by
 $B$ together with a pure real eigenvalue,
 $A$, are found to be simultaneously marginally stable for the present combination of parameters. Eigenvalues on the left side of the spectrum are not physical and correspond to spurious modes, whose presence is due to the influence of outlet boundary conditions. The position of eigenvalues
 $A$,
 $B$ and
 $C$ is not affected by
 $L_{out}$ in the range
 $L_{out}\in [30,100]$. (b) Marginal stability curves corresponding to the modes
 $A$ and
 $B$ and to a second steady mode
 $C$ as a function of
 $Re$ and
 $AR$. A codimension-2 point,
 $C_2$, is found for
 $Re=Re_{C_2}=22.65$ and
 $AR=AR_{C_2}=6.98$.

As a side remark to figure 4(b), an extrapolation of the marginal stability curve associated to mode  $C$ suggests that it would cross the curve of mode
 $A$ for
 $Re>100$. Nevertheless, the eigenvalue calculation performed in the range
 $Re\in [100,230]$ (not visible in 4b) showed that, for
 $Re=230$ and
 $AR=1.75$, the stability boundary is still delimited by mode
 $A$ (
 $C$ does not cross
 $A$). Indeed the two curves for modes
 $A$ and
 $C$ seem to approach two asymptotes (as well as the curve for mode
 $B$), whose actual existence could be confirmed by higher Reynolds calculations, which are however beyond the scope of this work.
The symmetry properties which characterized the two global modes  $A$ and
 $B$, reading
 \begin{gather} u_1^A(x,y)={-}u_1^A(x,-y)={-}u_1^A({-}x,y),\quad v_1^A(x,y)=v_1^A(x,-y)=v_1^A({-}x,y), \end{gather}
 \begin{gather}u_1^B(x,y)={-}u_1^B(x,-y)=u_1^B({-}x,y), \quad v_1^B(x,y)=v_1^B(x,-y)={-}v_1^B({-}x,y), \end{gather}
lead to the following axis boundary conditions:
 \begin{gather} u_1^{A}|_{\partial\varOmega_{h}}=0,\quad \left.\frac{\partial v_1^{A}}{\partial y}\right|_{\partial\varOmega_{h}}=0,\qquad u_1^{A}|_{\partial\varOmega_{v}}=0,\quad \left.\frac{\partial v_1^{A}}{\partial x}\right|_{\partial\varOmega_{v}}=0, \end{gather}
 \begin{gather}u_1^{B}|_{\partial\varOmega_{h}}=0,\quad \left.\frac{\partial v_1^{B}}{\partial y}\right|_{\partial\varOmega_{h}}=0,\qquad v_1^{B}|_{\partial\varOmega_{v}}=0,\quad \left.\frac{\partial u_1^{B}}{\partial x}\right|_{\partial\varOmega_{v}}=0. \end{gather}
For a given global mode,  $\hat {\boldsymbol {q}}_1$, we also compute the corresponding adjoint global mode,
 $\hat {\boldsymbol {q}}_1^{{\dagger}ger }$, which will be used in § 5 and which satisfies the adjoint eigenvalue problem,
 \begin{equation} [(\sigma-\text{i}\omega)\mathcal{B}^{{{\dagger}ger}}+\mathcal{A}^{{{\dagger}ger}}] \hat{\boldsymbol{q}}_1^{{{\dagger}ger}}=\boldsymbol{0}, \end{equation}
where  $\mathcal {A}^{{\dagger}ger }$ and
 $\mathcal {B}^{{\dagger}ger }$ are the adjoint operators of the linear operator
 $\mathcal {A}$ and the mass matrix
 $\mathcal {B}$, obtained by integrating by parts system (4.6) and expressed as
 \begin{equation} \mathcal{A}^{{{\dagger}ger}} = \begin{pmatrix} \mathcal{C}_{\textit{AR}}^{{{\dagger}ger}}(\boldsymbol{u}_0,\, \boldsymbol{\cdot} )-\dfrac{1}{Re}\varDelta_{\textit{AR}} & -\boldsymbol{\nabla}_{\textit{AR}}\\ \boldsymbol{\nabla}_{\textit{AR}}^{\textrm{T}} & 0 \end{pmatrix},\quad \mathcal{B}^{{{\dagger}ger}} = \begin{pmatrix} \mathcal{I} & 0 \\ 0 & 0 \end{pmatrix}. \end{equation}
Here  $\mathcal {C}_{\textit {AR}}^{{\dagger}ger }(\boldsymbol {a},\boldsymbol {b})$ is the adjoint advection operator, which is not symmetric and which reads as
 $\mathcal {C}_{\textit {AR}}^{{\dagger}ger }(\boldsymbol {a},\boldsymbol {b})=-(\boldsymbol {a}\boldsymbol {\cdot }\boldsymbol {\nabla }_{\textit {AR}})^{\textrm {T}}\boldsymbol {b}+(\boldsymbol {b}\boldsymbol {\cdot }\boldsymbol {\nabla }_{\textit {AR}})\boldsymbol {a}$. The adjoint boundary conditions are defined so that all boundary terms arising from the integration by parts are nil. Thus, we obtain
 \begin{gather} \boldsymbol{u}_1^{{{\dagger}ger}}|_{\partial\varOmega_w}=\boldsymbol{0},\quad (\boldsymbol{u}_0\boldsymbol{\cdot}\boldsymbol{n})\hat{\boldsymbol{u}}_1^{{{\dagger}ger}} +\left.\left(p_1^{{{\dagger}ger}}\boldsymbol{I}+\frac{1}{Re}\nabla\boldsymbol{u}_1^{{{\dagger}ger}}\right) \boldsymbol{\cdot} \boldsymbol{n}\right|_{\partial\varOmega_o}=0,\quad \boldsymbol{u}_1^{{{\dagger}ger}}|_{\partial\varOmega_i}=\boldsymbol{0}, \end{gather}
 \begin{gather}u_1^{A{\dagger}ger}|_{\partial\varOmega_{h}}=0,\quad \left.\frac{\partial v_1^{A{\dagger}ger}}{\partial y}\right|_{\partial\varOmega_{h}}=0,\qquad u_1^{A{\dagger}ger}|_{\partial\varOmega_{v}}=0,\quad \left.\frac{\partial v_1^{A{\dagger}ger}}{\partial x}\right|_{\partial\varOmega_{v}}=0, \end{gather}
 \begin{gather}u_1^{B{\dagger}ger}|_{\partial\varOmega_{h}}=0,\quad \left.\frac{\partial v_1^{B{\dagger}ger}}{\partial y}\right|_{\partial\varOmega_{h}}=0,\qquad v_1^{B{\dagger}ger}|_{\partial\varOmega_{v}}=0,\quad \left.\frac{\partial u_1^{B{\dagger}ger}}{\partial x}\right|_{\partial\varOmega_{v}}=0. \end{gather}
We checked a posteriori that both direct and adjoint problems have an identical spectrum and the direct and adjoint modes satisfy the bi-orthogonality property (see Meliga et al. Reference Meliga, Chomaz and Sipp2009a).
Figures 5 and 6 show the spatial structure of the velocity fields along the  $x$- and
 $y$-axis associated with the direct and adjoint global modes
 $A$ and
 $B$, respectively. While the direct modes are normalized using the value of the
 $y$-velocity field,
 $\hat {v}_1$, in a generic grid point, i.e.
 $(x,y)=(0.5,0)$, the adjoint modes are normalized such that
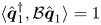 $\langle \hat {\boldsymbol {q}}_1^{{\dagger}ger },\mathcal {B}\hat {\boldsymbol {q}}_1\rangle =1$, where
 $\langle \,,\rangle$ is the inner product defined by
 $\langle \boldsymbol {a},\boldsymbol {b}\rangle =\int _{\varOmega }\boldsymbol {a}^* \boldsymbol {\cdot }\boldsymbol {b}\,\textrm {d}\varOmega$, the star
 $^*$ denotes the complex conjugate and
 $\boldsymbol {\cdot }$ indicates the canonical Hermitian scalar product in
 $\mathbb {C}^n$. This normalization will simplify the expression of the various coefficients derived in § 5. In figure 5(b,d) the real part velocity components of the oscillating mode along the
 $x$- and
 $y$-axis are represented. Their spatial structure is qualitatively analogous to that recently presented in the 3-D study performed by Bertsch et al. (Reference Bertsch, Bongarzone, Duchamp, Renaud and Gallaire2020a), which confirms that this kind of instability arises in both 2-D and 3-D problems for proper combinations of control parameters,
 $Re$ and
 $AR$, and which suggests that the same physical mechanism is behind the origin of the self-sustained oscillations regime. As mentioned by Bertsch et al. (Reference Bertsch, Bongarzone, Duchamp, Renaud and Gallaire2020a), the structure of the perturbation velocity fields of mode
 $B$ in the left and right output channels and their well-defined wavelength is typical of sinuous shear instabilities, like the famous one characterizing the unsteady flow past a circular cylinder (Ding & Kawahara Reference Ding and Kawahara1999; Barkley Reference Barkley2006; Sipp & Lebedev Reference Sipp and Lebedev2007). From the analysis of the corresponding adjoint mode (see figure 6b,d), we see that the spatial structure of the adjoint is localized in the central region, near the two inlets. In classic shear instabilities of open flow, a downstream localization of the global mode and an upstream localization of the adjoint global mode resulting from the convective non-normality of the linearized Navier–Stokes operator (Chomaz Reference Chomaz2005) is observed. Identifying two downstream directions towards the outlets and two upstream directions corresponding to the inlets, a similar characteristic is found. This evidence motivates the detailed investigation, presented in § 7, of the nature of this instability, which, from the knowledge of the authors, remained undetermined so far.
Spatial structure of the  $x$- and
 $y$-velocity components associated with the direct global modes
 $A$ and
 $B$ at the codimension-2 point,
 $C_2=(Re_{C_2},AR_{C_2})=(22.65,6.98)$. (a,c) Plots of the
 $x$- and
 $y$-velocity fields corresponding to the direct steady mode
 $A$. (b,d) Real part of the
 $x$- and
 $y$-velocity fields corresponding to the direct oscillating mode
 $B$.

Spatial structure of the  $x$- and
 $y$-velocity components associated with the direct and adjoint global modes at the codimension-2 point,
 $C_2=(Re_{C_2},AR_{C_2})=(22.65,6.98)$. (a,c) Plots of the
 $x$- and
 $y$-velocity fields corresponding to the adjoint steady mode
 $A$. (b,d) Real part of the
 $x$- and
 $y$-velocity fields corresponding to the adjoint oscillating mode
 $B$.

Concerning the steady global mode  $A$ (see figure 5a,c), it represents a steady symmetry-breaking condition with respect to the
 $x$-axis of symmetry. Given the symmetries of mode
 $A$, this steady instability corresponds to two possible new steady configurations (bi-stability), symmetric with respect to the
 $x$-axis. It leads to a positive off-set of the stagnation point above the
 $x$-axis (respectively a negative off-set below the
 $x$-axis) in the
 $y$-direction (at
 $x=0$); the two recirculation regions above (respectively below) the axis become smaller than the two below (respectively above) the axis. The corresponding adjoint mode (see figure 6a,c) maintains a structure similar to that of the direct mode.
The existence of a steady symmetry-breaking global mode and an oscillating global mode, which can be unstable in different regions of a stability map is also qualitatively consistent with the numerical analysis proposed by Pawlowski et al. (Reference Pawlowski, Salinger, Shadid and Mountziaris2006), who examined the same 2-D configuration with the only difference that a plug inlet profile was considered (see § 8 for further comments about the influence of a plug inlet velocity profile).
5. Weakly nonlinear formulation
5.1. Presentation
Since a codimension-2 point,  $C_2=(Re_{C_2},AR_{C_2})=(22.65,6.98)$, is found from the linear stability analysis, we present in this section a WNL in order to investigate the mode interaction between the steady mode
 $A$ and the oscillating mode
 $B$. In other words, we implement an asymptotic expansion where the two modes have the same order of magnitude. The departure from criticality, in terms of Reynolds number and aspect ratio, is assumed to be of order
 $\epsilon ^2$. Hence, we introduce the two order one parameters,
 $\delta =\epsilon ^2\tilde {\delta }$ and
 $\alpha =\epsilon ^2\tilde {\alpha }$, such that
 \begin{equation} \frac{1}{Re}=\frac{1}{Re_{C_2}}-\epsilon^2\tilde{\delta},\quad \frac{1}{AR}=\frac{1}{AR_{C_2}}+\epsilon^2\tilde{\alpha}. \end{equation}
In the spirit of the multiple scale technique, we introduce the slow time scale  $T=\epsilon ^2 t$, with
 $t$ being the fast time scale defined in (2.1). Hence, the entire flow field is expanded as
 \begin{equation} \boldsymbol{q}=\{u,v,p\}^{\textrm{T}}=\boldsymbol{q}_0+\epsilon\boldsymbol{q}_1+\epsilon^2\boldsymbol{q}_2+\epsilon^3\boldsymbol{q}_3+\text{O}(\epsilon^4). \end{equation}
In order to easily write the equations at the various order in  $\epsilon$ in a compact form, it is useful to introduce the following expansion for the nabla operator,
 $\boldsymbol {\nabla }$:
 \begin{align} \boldsymbol{\nabla}_{\textit{AR}}&=\left\{\frac{\partial}{\partial x},\frac{1}{AR}\frac{\partial}{\partial y}\right\}^{\textrm{T}}=\left\{\frac{\partial}{\partial x},\frac{1}{AR_{C_2}}\frac{\partial}{\partial y}\right\}^{\textrm{T}}+\epsilon^2\tilde{\alpha}\left\{0,\frac{\partial}{\partial y}\right\}^{\textrm{T}}\nonumber\\ &=\boldsymbol{\nabla}_{AR_{C_2}}+\epsilon^2\tilde{\alpha}\boldsymbol{\nabla}_{\alpha}+\text{O}(\epsilon^3). \end{align}
The definition of the Laplacian follows as
 \begin{align} \varDelta_{\textit{AR}}&=\boldsymbol{\nabla}_{\textit{AR}}^{\textrm{T}}\boldsymbol{\nabla}_{\textit{AR}}=(\boldsymbol{\nabla}_{AR_{C_2}}+\epsilon^2\tilde{\alpha}\boldsymbol{\nabla}_{\alpha})^{\textrm{T}}(\boldsymbol{\nabla}_{AR_{C_2}}+\epsilon^2\tilde{\alpha}\boldsymbol{\nabla}_{\alpha})\nonumber\\ &=\left(\frac{\partial^2}{\partial x^2}+\frac{1}{AR_{C_2}^2} \frac{\partial^2}{\partial y^2}\right)+\epsilon^2 \frac{2\tilde{\alpha}}{AR_{C_2}} \frac{\partial^2}{\partial y^2}=\varDelta_{AR_{C_2}}+\epsilon^2 2 \tilde{\alpha} \varDelta_{\alpha AR_{C_2}}+\text{O}(\epsilon^3). \end{align}
Substituting the expansions defined above in the governing equations (2.2) and (2.3) with their boundary conditions, a series of problems at the different orders in  $\epsilon$ are obtained.
5.2. Order  $\epsilon ^0$: steady base flow

At order  $\epsilon ^0$ the system is represented by the nonlinear equations for the steady symmetric base flow (4.1) with boundary conditions (4.2)–(4.5). The solution, computed for
 $Re_{C_2}$ and
 $AR_{C_2}$ via iterative Newton's method, was described in § 4.1.
5.3. Order $\epsilon$: linear global stability

At leading order in  $\epsilon$ the system is represented by the unsteady Navier–Stokes equations linearized around the base flow for
 $Re_{C_2}$ and
 $AR_{C_2}$, whose solution has been presented in § 4.2. In this framework, the solution of the leading order system is assumed to be composed of the sum of the two global modes,
 $A$ and
 $B$,
 \begin{equation} \boldsymbol{q}_1=A(T)\hat{\boldsymbol{q}}_1^A+(B(T)\hat{\boldsymbol{q}}_1^B\,\textrm{e}^{\text{i}\omega t}+\text{c.c.}), \end{equation}
that destabilized the steady state  $\boldsymbol {q}_0$. In (5.5) the amplitude
 $A(T)$, which varies with the slow time scale
 $T$, and the associated normalized eigenfunction are purely real, while the amplitude
 $B(T)$ and eigenfunction for mode
 $B$ are complex. Introducing (5.5) in the
 $\epsilon$-order system, a generalized eigenvalue problem for mode
 $A$ and
 $B$, whose general form reads as
 $(\text {i}\omega \mathcal {B}+\mathcal {A})\hat {\boldsymbol {q}}_1=\boldsymbol {0}$, is retrieved. We remark that at the codimension-2 point both modes are marginally stable, therefore, their growth rates are nil,
 $\sigma _A=\sigma _B=0$ in
 $C_2$, while the oscillation frequency of mode
 $B$ is
 $\omega =0.10157$.
5.4. Order $\epsilon ^2$: base-flow modifications, mean-flow corrections, mode interaction and second-harmonic response

At order  $\epsilon ^2$ we obtain the linearized Navier–Stokes equations applied to
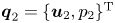 $\boldsymbol {q}_2=\{\boldsymbol {u}_2,p_2\}^{\textrm {T}}$,
 \begin{equation} (\mathcal{B}\partial_t+\mathcal{A})\boldsymbol{q}_2=\boldsymbol{\mathcal{F}}_2, \end{equation}
with the boundary conditions
 \begin{equation} \boldsymbol{u}_2|_{\partial\varOmega_w}=\boldsymbol{0},\ \ \left.\left({-}p_2\boldsymbol{I}+\frac{1}{Re_{C_2}}\boldsymbol{\nabla}_{AR_{C_2}}\boldsymbol{u}_2\right)\boldsymbol{\cdot}\boldsymbol{n}\right|_{\partial\varOmega_o}=0,\ \ \boldsymbol{u}_2|_{\partial\varOmega_i}=\boldsymbol{0}, \end{equation}
and forced by a term  $\boldsymbol {\mathcal {F}}_2$ depending only on zero- and first-order solutions,
 \begin{align} \boldsymbol{\mathcal{F}}_2= \begin{pmatrix} -\tilde{\delta}\varDelta_{AR_{C_2}}\boldsymbol{u}_0+ \dfrac{2\tilde{\alpha}}{Re_{C_2}}\varDelta_{\alpha AR_{C_2}}\boldsymbol{u}_0-\tilde{\alpha}\boldsymbol{\nabla}_{\alpha}p_0- \dfrac{\tilde{\alpha}}{2}\mathcal{C}_{\alpha}(\boldsymbol{u}_0,\boldsymbol{u}_0) -\frac{1}{2}\mathcal{C}_{AR_{C_2}}(\boldsymbol{u}_1,\boldsymbol{u}_1)\\ -\tilde{\alpha}\boldsymbol{\nabla}_{\alpha}\cdot\boldsymbol{u}_0 \end{pmatrix}, \end{align}
where  $\mathcal {C}_{\alpha }$ is the
 $\epsilon ^2$-order symmetric advection operator,
 $\mathcal {C}_{\alpha }(\boldsymbol {a},\boldsymbol {b})=(\boldsymbol {a}\boldsymbol {\cdot }\boldsymbol {\nabla }_{\alpha })\boldsymbol {b} +(\boldsymbol {b}\boldsymbol {\cdot }\boldsymbol {\nabla }_{\alpha })\boldsymbol {a}$, while
 $\mathcal {C}_{AR_{C_2}}(\boldsymbol {a},\boldsymbol {b})=(\boldsymbol {a}\boldsymbol {\cdot }\boldsymbol {\nabla }_{AR_{C_2}}) \boldsymbol {b}+(\boldsymbol {b}\boldsymbol {\cdot }\boldsymbol {\nabla }_{AR_{C_2}})\boldsymbol {a}$. Terms proportional to
 $\delta$ and
 $\alpha$ arise from the Reynolds number and aspect ratio variations with respect to the codimension-2 point definition and they act on the base flow. The last term in the
 $y$-component of (5.8) is due to the transport of the first-order solution
 $\boldsymbol {q}_1$ by itself. Introducing the first-order normal form (5.5) in the forcing term expressed in (5.8), the different contributions can be individualized to give
 \begin{equation} \boldsymbol{\mathcal{F}}_2=\underbrace{\tilde{\delta}\widehat{\boldsymbol{\mathcal{F}}}_2^{\delta} +\tilde{\alpha}\widehat{\boldsymbol{\mathcal{F}}}_2^{\alpha}+A^2\widehat{\boldsymbol{\mathcal{F}}}_2^{A^2} +|B|^2\widehat{\boldsymbol{\mathcal{F}}}_2^{|B|^2}}_{\boldsymbol{\mathcal{F}}_2^j =\{\mathcal{F}_{2x}^j,\mathcal{F}_{2y}^j\}^{\textrm{T}}}+(B^2\widehat{\boldsymbol{\mathcal{F}}}_2^{B^2}\,\textrm{e}^{\text{i}2\omega t}+AB\widehat{\boldsymbol{\mathcal{F}}}_2^{AB}\,\textrm{e}^{\text{i}\omega t}+\text{c.c.}). \end{equation}
Looking at (5.9), we recognize the second harmonic for mode  $B$, which is pulsating at
 $2\omega \ne \omega$ and, thus, it does not resonate and does not need the imposition of any compatibility condition. In principle, all the other terms could be classified as resonating terms in mode
 $A$ or
 $B$ for which the forced problem results to be singular and, hence, it is necessary to verify the solvability condition or Fredholm alternative. However, we can make use of the symmetry properties of the various forcing terms, as recently proposed in Camarri & Mengali (Reference Camarri and Mengali2019), to show that some of these conditions are implicitly satisfied. Indeed, the first four forcing terms, having
 $\omega =0$, are characterized by the symmetries at the
 $x$- and
 $y$-axis, i.e.
 \begin{equation} \mathcal{F}_{2y}^{j}|_{\partial\varOmega_{h}}=0,\quad \left.\frac{\partial \mathcal{F}_{2x}^{j}}{\partial y}\right|_{\partial\varOmega_{h}}=0,\qquad \mathcal{F}_{2x}^{j}|_{\partial\varOmega_{v}}=0,\quad \left.\frac{\partial \mathcal{F}_{2y}^{j}}{\partial x}\right|_{\partial\varOmega_{v}}=0, \end{equation}
which does not coincide with the axis boundary conditions for mode  $A$ given in (4.14). Consequently, the solvability condition for
 $A$ is naturally satisfied by symmetry properties. The same argument is applicable to the last terms oscillating in
 $\omega$, arising from direct competition between modes
 $A$ and
 $B$, which is characterized by the symmetries
 \begin{equation} \hat{\mathcal{F}}_{2y}^{AB}|_{\partial\varOmega_{h}}=0,\quad \left.\frac{\partial \hat{\mathcal{F}}_{2x}^{AB}}{\partial y}\right|_{\partial\varOmega_{h}}=0,\qquad \hat{\mathcal{F}}_{2y}^{AB}|_{\partial\varOmega_{v}}=0,\quad \left.\frac{\partial \hat{\mathcal{F}}_{2x}^{AB}}{\partial x}\right|_{\partial\varOmega_{v}}=0, \end{equation}
that differ from the boundary conditions for mode  $B$ given in (4.15) and automatically satisfy the solvability condition. It follows that, using the mentioned symmetry considerations, no solvability condition needs to be imposed at the
 $\epsilon ^2$-order. We thus look for a second-order solution having the expression
 \begin{equation} \boldsymbol{q}_2=\tilde{\delta}\hat{\boldsymbol{q}}_2^{\delta}+\tilde{\alpha}\hat{\boldsymbol{q}}_2^{\alpha} +A^2\hat{\boldsymbol{q}}_2^{A^2}+|B|^2\hat{\boldsymbol{q}}_2^{|B|^2} +(B^2\hat{\boldsymbol{q}}_2^{B^2}\,\textrm{e}^{\text{i}2\omega t}+AB\hat{\boldsymbol{q}}_2^{AB}\,\textrm{e}^{\text{i}\omega t}+\text{c.c.}), \end{equation}
where each single response is evaluated by means of a global resolvent technique (Garnaud et al. Reference Garnaud, Lesshafft, Schmid and Huerre2013; Viola, Arratia & Gallaire Reference Viola, Arratia and Gallaire2016).
All the second-order responses are displayed in figure 7 in terms of their  $x$-velocity component. As shown in figure 7(f), the second-harmonic response for the global mode
 $B$ is essentially periodic in space with a wavelength twice that of the direct mode (see figure 5b,d), while the interaction between
 $A$ and
 $B$ (see figure 7e) is nearly periodic in space with a wavelength close to that of the direct mode
 $B$ within a central region near the jets collision, where the direct mode
 $A$ mainly acts, and it vanishes far away as mode
 $A$ vanishes too (see figure 5a,c).
Second-order responses corresponding respectively to (a,b) base-flow modifications due to the Reynolds number and aspect ratio variations with respect to the codimension-2 point,  $C_2$, (c,d) mean-flow correction associated to mode
 $A$ and
 $B$, respectively, (e,f) harmonic interaction between the steady mode
 $A$ and the oscillating mode
 $B$ and second harmonic for mode
 $B$.

5.5. Order $\epsilon ^3$: amplitude equations

At the  $\epsilon ^3$-order we derive the system of amplitude equations which describe the weakly nonlinear global mode interaction of
 $A$ and
 $B$. The problem at order
 $\epsilon ^3$ is similar to the one obtained at order
 $\epsilon ^2$, as it indeed appears as a linear system forced by the previous order solutions, englobed in
 $\mathcal {F}_3$,
 \begin{equation} (\mathcal{B}\partial_t+\mathcal{A})\boldsymbol{q}_3=\boldsymbol{\mathcal{F}}_3, \end{equation}
and subjected to the boundary conditions,
 \begin{equation} \boldsymbol{u}_3|_{\partial\varOmega_w}=\boldsymbol{0},\quad \left.\left({-}p_3\boldsymbol{I}+\frac{1}{Re_{C_2}}\boldsymbol{\nabla}_{AR_{C_2}}\boldsymbol{u}_3\right) \boldsymbol{\cdot}\boldsymbol{n}\right|_{\partial\varOmega_o}=0,\quad \boldsymbol{u}_3|_{\partial\varOmega_i}=\boldsymbol{0}. \end{equation}
The  $\epsilon ^3$-order forcing term,
 $\boldsymbol {\mathcal {F}}_3$, by substituting the first- and second-order solutions, reads as
 \begin{align} & \boldsymbol{\mathcal{F}}_3\notag\\ & \quad =\begin{pmatrix}
-\partial_T\boldsymbol{u}_1-\tilde{\delta}\varDelta_{AR_{C_2}}\boldsymbol{u}_1
+\dfrac{2\tilde{\alpha}}{Re_{C_2}}\varDelta_{\alpha
AR_{C_2}}\boldsymbol{u}_1-\tilde{\alpha}\boldsymbol{\nabla}_{\alpha}p_1-
\tilde{\alpha}\mathcal{C}_{\alpha}(\boldsymbol{u}_0,\boldsymbol{u}_1)
-\mathcal{C}_{AR_{C_2}}(\boldsymbol{u}_1,\boldsymbol{u}_2)\\
-\tilde{\alpha}\boldsymbol{\nabla}_{\alpha}\boldsymbol{u}_1
\end{pmatrix}\nonumber\\ & \quad ={-}\frac{\partial A}{\partial T}{\mathcal{B}}
\hat{\boldsymbol{q}}_1^A+A(\tilde{\delta}\widehat{\boldsymbol{\mathcal{F}}}_3^{\delta
A}+\tilde{\alpha}\widehat{\boldsymbol{\mathcal{F}}}_3^{\alpha
A})+A^3\widehat{\boldsymbol{\mathcal{F}}}_3^{A^3}+A|B|^2\widehat{\boldsymbol{\mathcal{F}}}_3^{A|B|^2}\notag\\
& \qquad +\left\{\left[-\frac{\partial B}{\partial
T}\mathcal{B}\hat{\boldsymbol{q}}_1^B+B(\tilde{\delta}\widehat{\boldsymbol{\mathcal{F}}}_3^{\delta
B}+\tilde{\alpha}\widehat{\boldsymbol{\mathcal{F}}}_3^{\alpha
B})+|B|^2B\widehat{\boldsymbol{\mathcal{F}}}_3^{|B|^2B}+A^2B\widehat{\boldsymbol{\mathcal{F}}}_3^{A^2B}\right]\textrm{e}^{\text{i}\omega
t}+\text{c.c.}\right\}\nonumber\\
&\qquad +\text{N.R.T.}, \end{align}
where  $\text {N.R.T.}$ gathers all the non-resonating terms, not relevant for the further analysis and omitted thereafter. The first term in the
 $y$-component of (5.15) corresponds to the slow time evolution of the amplitudes
 $A(T)$ and
 $B(T)$ with the slow time scale
 $T=\epsilon ^2t$. The last term is due to the advection of the leading order solution by the second-order solution and vice versa. All the other terms arise from the Reynolds number and aspect ratio variation acting on the
 $\epsilon$-order solution. As standard in multiple scale analysis, in order to avoid secular terms and solve the expansion procedure at the third order, a compatibility condition must be enforced through the Fredholm alternative (Friedrichs Reference Friedrichs2012).
The compatibility condition imposes the amplitudes  $A(T)$ and
 $B(T)$ to obey the relations
 \begin{align} \frac{\textrm{d}A}{\textrm{d}t}=(\delta\zeta_A+\alpha\eta_A)A-\mu_AA^3-\chi_AA|B|^2, \end{align}
 \begin{align} \frac{\textrm{d}B}{\textrm{d}t}=(\delta\zeta_B+\alpha\eta_B)B-\mu_B|B|^2B-\chi_BBA^2, \end{align}
where the physical time scale  $t$ has been reintroduced,
 $\delta =\epsilon ^2\tilde {\delta }=1/Re_{C_2}-1/Re$,
 $\alpha =\epsilon ^2\tilde {\alpha }=1/AR-1/AR_{C_2}$ and the various coefficients, whose values are reported in appendix A, are computed as scalar products between the adjoint global modes
 $\hat {\boldsymbol {q}}_1^{{\dagger}ger }$ and the resonant forcing terms
 $\widehat {\boldsymbol {\mathcal {F}}}_3^i$, i.e. for instance,
 \begin{equation} \zeta_A=\frac{\langle \hat{\boldsymbol{q}}_1^{A{\dagger}ger},\widehat{\boldsymbol{\mathcal{F}}}_3^{\delta A}\rangle}{\langle \hat{\boldsymbol{q}}_1^{A{\dagger}ger},\mathcal{B}\hat{\boldsymbol{q}}_1^{A}\rangle } =\langle \hat{\boldsymbol{q}}_1^{A{\dagger}ger},\widehat{\boldsymbol{\mathcal{F}}}_3^{\delta A}\rangle ,\quad \zeta_B=\frac{\langle \hat{\boldsymbol{q}}_1^{B{\dagger}ger},\widehat{\boldsymbol{\mathcal{F}}}_3^{\delta B}\rangle }{\langle \hat{\boldsymbol{q}}_1^{B{\dagger}ger},\mathcal{B}\hat{\boldsymbol{q}}_1^{B}\rangle } =\langle \hat{\boldsymbol{q}}_1^{B{\dagger}ger},\widehat{\boldsymbol{\mathcal{F}}}_3^{\delta B}\rangle , \end{equation}
since  $\langle \hat {\boldsymbol {q}}_1^{A{\dagger}ger },\mathcal {B}\hat {\boldsymbol {q}}_1^{A}\rangle =\langle \hat {\boldsymbol {q}}_1^{B{\dagger}ger },\mathcal {B}\hat {\boldsymbol {q}}_1^{B}\rangle =1$ due to the normalization introduced in § 4.2. The detailed expression of each normal form coefficient is provided in appendix A. Equations (5.16) and (5.17) differ from the classic Stuart–Landau equations, describing the pitchfork and Hopf bifurcations of single modes, by the two coupling terms,
 $\chi _AA|B|^2$ and
 $\chi _BBA^2$, coming from third-order nonlinearities. The structure of system (5.16) and (5.17) is well known in literature and is analogous to that derived by Meliga et al. (Reference Meliga, Gallaire and Chomaz2012), where a formally equivalent analysis is performed to investigate weakly nonlinear interactions for mode selection in swirling jets.
5.5.1. Stability analysis of the amplitude equations
Here we perform the stability analysis of the amplitude (5.16) and (5.17). Recalling that the amplitude  $A$ is purely real, as well as all the coefficients associated with its equation, while amplitude
 $B$ and the related amplitude equation coefficients are complex, so that we can turn to polar coordinates, i.e.
 $B=|B|\,\textrm {e}^{\text {i}\varPhi _B}$, and split the modulus and phase parts of (5.16) and (5.17),
 \begin{align} \frac{\textrm{d}A}{\textrm{d}t}=(\delta\zeta_A+\alpha\eta_A)A-\mu_AA^3-\chi_AA|B|^2, \end{align}
 \begin{align} \frac{\textrm{d}|B|}{\textrm{d}t}=(\delta\zeta_{Br}+\alpha\eta_{Br})|B|-\mu_{Br}|B|^3-\chi_{Br}|B|A^2, \end{align}
 \begin{align} \frac{\textrm{d}\varPhi_B}{\textrm{d}t}=(\delta\zeta_{Bi}+\alpha\eta_{Bi})-\mu_{Bi}|B|^2-\chi_{Bi}A^2. \end{align}
System (5.19) and (5.20) presents different possible equilibria (Kuznetsov Reference Kuznetsov2013). Below the threshold the system is stable and the trivial equilibrium with  $A=|B|=0$ is retrieved. Two other possible equilibria correspond to
 $(A\ne 0,|B|=0)$ (pitchfork bifurcation for mode
 $A$) or
 $(A=0,|B|\ne 0)$ (Hopf bifurcation for mode
 $B$). The single mode pitchfork and Hopf bifurcations are easily found, removing the coupling terms by setting
 $\chi _A=\chi _B=0$ and looking for a stationary solution of (5.19) and (5.20),
 ${\textrm {d}A}/{\textrm {d}t}={\textrm {d}|B|}/{\textrm {d}t}=0$. This leads to the classic solutions
 \begin{equation} A^2=\frac{\delta\zeta_A+\alpha\eta_A}{\mu_A},\quad |B|^2=\frac{\delta\zeta_{Br}+\alpha\eta_{Br}}{\mu_{Br}}. \end{equation}
The non-trivial equilibrium with  $(A\ne 0,|B|\ne 0)$ is obtained reintroducing the coupling terms and investigating the existence of a parameter region in which both modes coexist. Indeed, looking for a stationary solution
 ${\textrm {d}A}/{\textrm {d}t}={\textrm {d}|B|}/{\textrm {d}t}=0$, we obtain the system
 \begin{equation} \left[ \begin{matrix} \mu_A & \chi_A \\ \chi_{Br} & \mu_{Br} \end{matrix} \right] \left\{ \begin{matrix} A^2 \\ |B|^2 \end{matrix} \right\}= \left\{ \begin{matrix} \delta\zeta_{A}+\alpha\eta_{A} \\ \delta\zeta_{Br}+\alpha\eta_{Br} \end{matrix} \right\}, \end{equation}
which admits a physical solution only for  $Re$ and
 $AR$ values for which
 $A^2>0$ and
 $|B|^2>0$. Solving (5.23), we obtain
 \begin{align} A^2&=\frac{(\delta\zeta_A+\alpha\eta_A)\mu_{B_r}-\chi_A(\delta\zeta_{B_r} +\alpha\eta_{B_r})}{\mu_A\mu_{B_r}-\chi_A\chi_{B_r}}, \end{align}
 \begin{align} |B|^2&=\frac{(\delta\zeta_{B_r}+\alpha\eta_{B_r})\mu_A-\chi_{B_r}(\delta\zeta_A+\alpha\eta_A)}{\mu_A\mu_{B_r}-\chi_A\chi_{B_r}}. \end{align}
The general relation for the phase of mode  $B$ at large time, which varies linearly in time, reads as
 \begin{equation} \varPhi_B|_{t\rightarrow +\infty}=[(\delta\zeta_{Bi}+\alpha\eta_{Bi})-\mu_{Bi}|B|^2-\chi_{Bi}A^2]t, \end{equation}
meaning that the frequency at large time will saturate to the following prescribed valued, function of the Reynolds number and aspect ratio variation with respect to the codimension-2 point,  $C_2$:
 \begin{equation} \omega|_{t\rightarrow +\infty}=\omega_{C_2}+[(\delta\zeta_{Bi}+\alpha\eta_{Bi})-\mu_{Bi}|B|^2-\chi_{Bi}A^2]. \end{equation}
Combining all these ingredients, the bifurcation diagram proposed in figure 8(a–c) presents a complex series of bifurcations. The stability of the various branches was numerically assessed by time marching (5.19) and (5.20) using the Matlab function ode23. As depicted in figure 8(b) for a fixed value of aspect ratio,  $AR=6.5<AR_{C_2}$, the steady mode
 $A$ bifurcates first at
 $Re_{PA}=23.85$ (pitchfork bifurcation
 $\text {PA}$) breaking the symmetry of the base flow with respect to the
 $x$-axis,
 $\partial \varOmega _h$. The oscillating mode
 $B$ then bifurcates from the
 $x$-symmetry-breaking pitchfork bifurcation at
 $Re_{SHB}=24.63$ through a secondary Hopf bifurcation (SHB). Notwithstanding the subcritical nature of this bifurcation, which makes it unstable, such a bifurcated branch is fundamental for the emergence of the self-sustained oscillation regime, through a backward bifurcation of mode
 $A$ (BA) at
 $Re_{BA}=24.35$. The sub-criticality of the system in the range
 $Re_{BA}<Re<Re_{SPB}$ leads to an hysteretic behaviour where either the steady mode
 $A$ or the oscillating mode
 $B$ can dominate, depending on the initial conditions to which the system is subjected. Figure 8(a) shows the full weakly nonlinear map predicted by the normal form (5.16) and (5.17) in the
 $(Re,AR)$-plane around the codimension-2 point. Lastly, as shown in figure 8(c), above
 $AR_{C_2}$ only the oscillating mode
 $B$, which settles into a limit cycle via classic Hopf bifurcation (HB), exists. In this range, the self-sustained oscillations regime is observed above a certain Reynolds number.
(a) Weakly nonlinear map predicted by the normal form (5.16) and (5.17) in the  $(Re,AR)$-plane. Green and blue dotted lines indicate the linear marginal stability curves for mode
 $A$ and
 $B$, respectively, as presented in § 4.2. In the black region the steady mode
 $A$ prevails, while the oscillating mode
 $B$ dominates in the wide grey region. A region of hysteresis, highlighted in a light grey shade, is found for
 $AR$ smaller than
 $AR_{C_2}$. (b) Bifurcation diagram as a function of the Reynolds number for a fixed value of aspect ratio,
 $AR=6.5<AR_{C_2}$. Dashed and dot–dashed lines mean unstable branches, while solid lines denote stable branches. The vertical red dotted lines represent the thresholds for the pitchfork bifurcation of mode
 $A$ (PA), the backward bifurcation of mode
 $A$ (BA) and the secondary Hopf bifurcation of mode
 $B$ (SHB). The light grey shaded region corresponds to the hysteresis range of (a). (c) Bifurcation diagram as a function of the Reynolds number for a fixed value of aspect ratio,
 $AR=7.5>AR_{C_2}$. The vertical red dotted lines represent the thresholds for the Hopf bifurcation for mode
 $B$.

6. Comparison with DNS
In this section the results derived in § 5 via WNL are compared with DNS. The full nonlinear unsteady dynamics represented by the system of governing equations (2.2) and (2.3) with its boundary conditions is solved using the open-source code Nek5000, as described in § 3.
In addition to the fluid governing equations, Nek5000 allows us to easily introduce a further advection–diffusion equation describing the dynamics of a passive scalar,  $\varPhi$,
 \begin{equation} \frac{\partial \varPhi}{\partial t}+\boldsymbol{u}\boldsymbol{\cdot}\nabla \varPhi=\frac{1}{Pe}\varDelta \varPhi, \end{equation}
which enables us to reproduce the presence of two dyes continuously injected through the inlets, in order to visualize the instantaneous flow configuration (Bertsch et al. Reference Bertsch, Bongarzone, Duchamp, Renaud and Gallaire2020a). The Péclet number,  $Pe$, appearing in (6.1) has been set to
 $Pe=100$, a value which ensures a good numerical stability and a satisfactory flow visualization at the same time for all the explored cases. Concerning this passive scalar equation, Dirichlet boundary conditions are imposed at the two inlets (
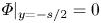 $\varPhi |_{y=-{s}/{2}}=0$,
 $\varPhi |_{y={s}/{2}}=1$) to reproduce the injection of two different dyes, while outflow conditions are set at the outlets; no flux is allowed through the solid walls.
6.1. Regime comparison
In figure 9 the nonlinear map of figure 8(a) for a specific value of aspect ratio in the region characterized by the hysteretic behaviour, i.e.  $AR=6.5$, is recalled. Different DNS, covering the range of Reynolds numbers from the stable region (
 $Re<Re_{PA}=23.85$) to the region dominated by the oscillating mode
 $B$ (
 $Re>Re_{SHB}=24.63$) were performed. The investigated cases are indicated in figure 9 with symbols. The results extracted from the DNS are presented in figures 10 and 11.
Nonlinear map of figure 8(a) for a specific value of aspect ratio in the region characterized by the hysteretic behaviour, i.e.  $AR=6.5$. Cases investigated by performing DNS are indicated by symbols. The red diamond (
 $Re=24.55$) corresponds to a case in which the existence of the hysteresis region has been checked using the same control parameters,
 $AR$ and
 $Re$, but different initial conditions, given by the final steady state or limit cycle of the two closest simulations, whose Reynolds numbers have been increased or decreased, respectively, as sketched by the green arrows.

Snapshots of the flow patterns in terms of dye concentrations observed at large time, (a–d) once the steady state (stable base flow or symmetry breaking for mode  $A$) is reached or, alternatively, (e,f) once the limit cycle for mode
 $B$ is fully established, for the various Reynolds numbers indicated by white squares in figure 9. The white dashed lines represent the axes of symmetry characterizing the steady base flow. The flow configuration for
 $Re=24.55$ is shown in figure 11.

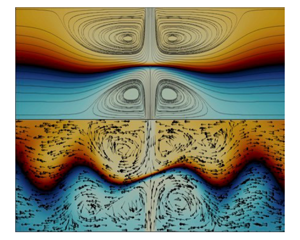
Snapshots of the flow patterns in terms of dye concentrations observed at large time for  $AR=6.5$ and the same Reynolds number,
 $Re=24.55$ (hysteresis region), but with different initial conditions: (a) the new steady state (symmetry-breaking condition) obtained for
 $Re=24.4$ is used as an initial condition; (b) a time instant of the unsteady solution corresponding to
 $Re=24.7$ (limit cycle for mode
 $B$) is imposed as an initial condition. Streamlines and arrows are used to visualize the velocity fields associated with the steady and oscillating configurations, respectively.

All the numerical simulations displayed in figure 10 were started from zero initial conditions. Figure 10(a) shows the steady state obtained for  $Re=22$, which confirms that the steady base flow is stable for
 $Re<Re_{PA}=23.85$, indeed no symmetry breaking can be observed. For
 $Re=24$,
 $24.2$ and
 $24.4$ (which lies in the hysteresis range), we retrieved that the steady mode
 $A$ first bifurcates via a pitchfork bifurcation. The symmetry with respect to the
 $x$-axis is lost, the position of the stagnation point lies below the
 $x$-axis of symmetry and the size of the recirculation regions differs on either side of the
 $x$-axis of symmetry
 $\partial \varOmega _h$. For
 $Re>Re_{SHB}=24.63$, i.e.
 $Re=24.7$,
 $24.84$,
 $25$ and
 $27$, only the self-sustained oscillation regime is observed.
In order to confirm the existence of the hysteretic behaviour found in § 5.5.1, the solutions obtained at large time for  $Re=24.4$ (asymmetric steady configuration) and
 $Re=24.7$ (limit cycle for the self-oscillations) are used as initial conditions for two more simulations, where the Reynolds number is fixed to
 $Re=24.55$ in both cases (filled red diamond and green arrows in figure 9). The results of this numerical procedure are given in figure 11. We clearly see in figure 11(a,b) that depending on the initial conditions imposed on the system, for this fixed value of
 $Re=24.55$ within the hysteresis region, both modes can emerge. Other simulations (not shown) performed in the upper region of figure 8(a), i.e. for
 $Re=25$ and
 $AR=7.5$ and
 $8$, confirm the supercritical nature of the Hopf bifurcation associated to mode
 $B$ (HB).
Next, global linear stability and WNL are both compared with the DNS in terms of the amplitude of modes  $A$ and
 $B$ and oscillation frequency for the self-sustained oscillatory regime.
6.2. Frequency comparison
Figure 12(a) shows that, near the threshold, the linear global stability analysis (LGS), the WNL and DNS agree well and prescribe the correct oscillation frequency. However, if the LGS soon diverges from the DNS, as extensively described in the literature (Barkley Reference Barkley2006), the WNL theory, applied to the problem presented in this paper provides a wider range of Reynolds numbers in which the model follows the DNS trend with a satisfactory agreement, showing an error of  $3\,\%$ for
 $Re=40$ against the
 $13.2\,\%$ of the LGS. Additionally, it needs to be underlined that the results shown in this section refer to an aspect ratio of
 $AR=6.5$, hence, a double off-set (in terms of
 $Re$ and
 $AR$) with respect to the codimension-2 point,
 $C_2$, is considered in the WNL curve of figure 12. Indeed, the precision of the asymptotic expansion prediction increases as
 $|Re-Re_{C_2}|$ and
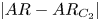 $|AR-AR_{C_2}|$ decrease.
(a) Oscillation frequency, extracted from the  $y$-velocity component at
 $(x,y)=(0.5,0)$, versus Reynolds number for
 $AR=6.5$. The solid black line indicates the WNL. The dotted black line and plus signs represent the LGS. The dashed black line and circles are associated with the DNS performed. (b) Amplitude of modes
 $A$ and
 $B$ extracted from DNS and compared with the bifurcation diagram obtained from the WNL analysis for
 $AR=6.5$. Symbols and green arrows in (b) correspond to those introduced in figure 9 and are associated to the DNS presented above.

6.3. Amplitude comparison
In figure 12(b) we compare the amplitude of modes  $A$ and
 $B$ extracted from the DNS with those prescribed by the WNL model. The total flow solutions in the steady and oscillatory regimes evaluated via weakly nonlinear formulation read as
 \begin{equation} \boldsymbol{u}^A_{WNL}=\boldsymbol{u}_0+A\boldsymbol{u}_1^A+\delta\boldsymbol{u}_2^{\delta} +\alpha\boldsymbol{u}_{2}^{\alpha}+A^2\boldsymbol{u}_{2}^{A^2}, \end{equation}
 \begin{equation}\boldsymbol{u}^B_{WNL}=\boldsymbol{u}_0+(B\boldsymbol{u}_1^B\,\textrm{e}^{\text{i}\omega t}+\textrm{c.c.})+\delta\boldsymbol{u}_2^{\delta}+\alpha\boldsymbol{u}_{2}^{\alpha} +|B|^2\boldsymbol{u}_{2}^{|B|^2}+(B^2\boldsymbol{u}_2^{B^2}\,\textrm{e}^{\text{i}2\omega t}+\textrm{c.c.}). \end{equation}
Specifying (6.2) and (6.3) for the  $y$-velocity components,
 $v_{WNL}^{A,B}$, at the
 $x$-axis of symmetry (
 $y=0$), given the symmetries of the various terms, we have
 $v^A(x,0)_{WNL}=Av_1^A(x,0)$ and
 $v^B(x,0)_{WNL}=(Bv_1^B(x,0)\,\textrm {e}^{\text {i}\omega t}+\textrm {c.c.})$. Then selecting the point
 $x=0.5$, used to normalize the global modes (
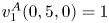 $v_1^A(0,5,0)=1$ and
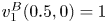 $v_1^B(0.5,0)=1$), we derive the simple expressions
 \begin{equation} v^A(0.5,0)_{WNL}=A, \end{equation}
 \begin{equation}v^B(0.5,0)_{WNL}=2|B|\cos(\omega t+\varPhi_B), \end{equation}
which allow us to easily compare the amplitudes  $A$ and
 $|B|$ from the WNL model with those extracted from the DNS,
 $v(0.5,0)_{DNS}$. Figure 12(b) shows not only a qualitative but also a quantitative agreement between DNS and WNL, which captures well the hysteretic behaviour of the flow for
 $AR<AR_{C_2}$ (sufficiently close to
 $AR_{C_2}$).
6.4. Evolution of the oscillation frequency with the aspect ratio
A linear dependence of the self-oscillations on the inverse of the spacing between the jets,  $s$, which highlights the importance of the distance
 $s$ in the oscillatory phenomenon, was observed in Bertsch et al. (Reference Bertsch, Bongarzone, Duchamp, Renaud and Gallaire2020a), who proposed the scaling law
 \begin{equation} f\sim \frac{U}{s}, \end{equation}
where the slope, derived by fitting the experimental data, was seen to be approximatively  $1/6$, which is also consistent with the measurements made by Denshchikov et al. (Reference Denshchikov, Kondrat'ev and Romashov1978) on large-scale facing jets in turbulent flow conditions. Given the definition of the Strouhal number introduced in § 4.2,
 $St=fw/U$, and the aspect ratio
 $AR=s/w$, the non-dimensional form of the scaling law (6.6) reads as
 \begin{equation} St_B\sim \frac{1}{AR}, \end{equation}
where the subscript  $_B$ is used to denote the frequency associated with the oscillating mode
 $B$. It follows that in our 2-D model, (6.6) translates in a linear dependence of the Strouhal number on
 $1/AR$. Moreover, according to such a law, the variation of
 $St$ with
 $Re$ is not predominant.
In order to verify whether the evolution of the oscillation frequency in our 2-D flow behaves similarly to that of the 3-D one studied in Bertsch et al. (Reference Bertsch, Bongarzone, Duchamp, Renaud and Gallaire2020a), we performed a series of DNS fixing  $Re$, i.e.
 $Re=Re_{C_2}=22.65$, and varying
 $AR$ (
 $>AR_{C_2}$). A quantitative comparison of DNS and the WNL model is shown in figure 13.
Variation of the Strouhal number,  $St_B=fw/U$, with the aspect ratio,
 $AR=s/w$, for a fixed Reynolds number,
 $Re=Re_{C_2}=22.65$. Black solid line: WNL. Black circles: DNS. Inset: variation of
 $St_B$ with
 $Re$ for different
 $AR$ according to the WNL model. For values of
 $Re$ smaller than the WNL stability boundary, the instability does not occur and no oscillations can be observed.

In this context, it is important to note that the parameter  $1/AR$ in (6.7) naturally appears in the weakly nonlinear formulation, which, indeed, prescribes a linear variation of the dimensionless frequency with
 $1/AR$, as displayed in figure 13. Direct numerical simulation results agree well with the WNL model, that also provides a theoretical expression for the slope
 $m$ indicated in figure 13. In analogy with Bertsch et al. (Reference Bertsch, Bongarzone, Duchamp, Renaud and Gallaire2020a) and Denshchikov et al. (Reference Denshchikov, Kondrat'ev and Romashov1978), we retrieved a factor close to
 $1/6$.
Moreover, as shown in the inset of figure 13 (see also figure 12a), the dependence of the frequency on the Reynolds number is much weaker (at least in the first range of  $Re$) than the dependence on
 $AR$, which is in agreement with the scaling law (6.7).
7. Instability mechanisms: sensitivity analysis
The presence of a stationary  $(y,-y)$ symmetry-breaking bifurcation, as revealed by the existence of the
 $A$ mode analysed in this paper bears a certain similarity with sudden expansion flows, where the origin of the symmetry-breaking instability was found to lie in the recirculation regions (Fani, Camarri & Salvetti Reference Fani, Camarri and Salvetti2012; Lanzerstorfer & Kuhlmann Reference Lanzerstorfer and Kuhlmann2012; Lashgari et al. Reference Lashgari, Tammisola, Citro, Juniper and Brandt2014). The physical mechanism associated to the symmetry breaking is often referred to as a Coandă effect, where the shear layers surrounding the recirculation regions are deflected towards one of the two confining walls.
The present flow however is characterized not only by two, but rather by four symmetric recirculation regions surrounding an hyperbolic stagnation point. Note that the existence of four recirculation regions invariant under two axial symmetries and one central symmetry suggests also the possibility for an  $(x,-x)$ symmetry breaking, akin to the buckling of two colliding jets at their meeting point. The presence of an hyperbolic stagnation point is also known to give rise to the so-called hyperbolic instability (Friedlander & Vishik Reference Friedlander and Vishik1991; Lifschitz & Hameiri Reference Lifschitz and Hameiri1991), which was found to contribute in the destabilization of arrays of vortices (Sipp, Lauga & Jacquin Reference Sipp, Lauga and Jacquin1999; Godeferd, Cambon & Leblanc Reference Godeferd, Cambon and Leblanc2001; Ortiz & Chomaz Reference Ortiz and Chomaz2011). This instability mechanism, which is best understood in the short wave and inviscid asymptotic limits, is however known to give rise to spanwise disturbances which cannot be active within the present 2-D framework.
Turning our attention now to the self-sustained oscillatory global mode B, we note that the simple scaling of its intrinsic frequency with the physical parameters observed in the 3-D microfluidic experiments and numerical simulations of Bertsch et al. (Reference Bertsch, Bongarzone, Duchamp, Renaud and Gallaire2020a) does not yet point clearly to a physical governing mechanism. As tentatively argued in Bertsch et al. (Reference Bertsch, Bongarzone, Duchamp, Renaud and Gallaire2020a), the oscillatory nature of this instability suggests the presence of a feedback mechanism, as investigated in Villermaux & Hopfinger (Reference Villermaux and Hopfinger1994) and Villermaux, Gagne & Hopfinger (Reference Villermaux, Gagne and Hopfinger1993). This suggests several candidates, such as the presence of a pocket of absolute instability, or a global pressure feedback. The perturbation field numerically extracted in Bertsch et al. (Reference Bertsch, Bongarzone, Duchamp, Renaud and Gallaire2020a) and qualitatively retrieved in the present paper, shows a sinuous structure in the left and right outlet channels which is reminiscent of two synchronized sinuous shear instabilities. This suggests that the Kelvin–Helmholtz instability of the confined jet profiles prevailing in the outlet channels participates in the self-sustained oscillation process.
We have indeed determined the dispersion relation of the streamwise velocity profiles pertaining at different streamwise stations ( $x\in [1,10]$) in the side arm for
 $AR=AR_{C_2}=6.98$ and
 $Re=Re_{C_2}=22.65$ (see figure 15b). We have found that the sinuous mode was indeed unstable in the region
 $1 < x < 5$ (see appendix C for more details), while the varicose mode remained damped. This indicates that in this region the shear is sufficiently intense for the Kelvin–Helmholtz instability to overcome the conjugate stabilizing effect of confinement and viscosity. Additionally, we found that the most unstable wavelength was close to
 $9$, in visual agreement with figure 5(d), while the associated frequency was
 $0.1$, also in good agreement with the global mode frequency.
However, in order to translate into a self-sustained global instability, this shear layer instability would either need to be of absolute nature, possibly because of the presence of nearby walls, known to enhance absolute instability in confined shear flows (Juniper Reference Juniper2006; Healey Reference Healey2009; Rees & Juniper Reference Rees and Juniper2010; Biancofiore & Gallaire Reference Biancofiore and Gallaire2011). As explained in appendix C, our calculations however showed that the instability remains convective in the entire unstable region  $x\in [1,5]$. Another source of strong shear is represented by the two facing
 $y$-velocity jets issuing from the inlets (see figure 15a). Indeed, even if isothermal jets are usually known to be convectively unstable, the present geometry differs from a classical free jet. The two jets face each other and collide, slowing down while redirecting fluid towards the outlets. In this interaction region the flow is however far from weakly non-parallel and the application of local stability analysis is therefore questionable.
Global instability of shear flows in open flows has indeed been historically studied under the parallel flow assumption, where the local linear stability theory is applied to determine whether the flow is absolutely unstable and, hence, a global instability is to be expected (Huerre & Monkewitz Reference Huerre and Monkewitz1985). Further progress has been made extending the analysis to spatially developing (Chomaz, Huerre & Redekopp Reference Chomaz, Huerre and Redekopp1988; Huerre & Monkewitz Reference Huerre and Monkewitz1990) with the introduction of the WKBJ approximation for weakly non-parallel flows, which extends the domain of validity of the local analysis and provides fair agreement when compared with the LGS (Viola et al. Reference Viola, Arratia and Gallaire2016; Siconolfi et al. Reference Siconolfi, Citro, Giannetti, Camarri and Luchini2017). Meanwhile, global stability analysis (sometimes called bi-global Theofilis Reference Theofilis2011) has become increasingly popular in recent years, thanks to the large memory capabilities of modern computers.
As mentioned above, the flow is strongly non-parallel in both the  $x$- and
 $y$-directions in the central interaction region of the X-junction, which jeopardizes the chances to apply successfully a weakly non-parallel approach to determine the physical mechanism governing this oscillatory instability. We thus propose to follow a different approach to investigate the nature of the instability.
The approach proposed in this section makes use of the properties of the adjoint eigenfunctions associated to the direct eigenmodes and it is formally known as sensitivity analysis. Following Giannetti & Luchini (Reference Giannetti and Luchini2007), Chomaz (Reference Chomaz2005) popularized the definition of the wavemaker region as the region of the flow which is predominantly active in sustaining the global instability. He demonstrated that the wavemaker region can be identified as the overlapping region between the direct and adjoint global eigenvectors. Giannetti & Luchini (Reference Giannetti and Luchini2007) indeed demonstrated that the concept of the wavemaker identifies regions of the flow where the presence of a local instantaneous feedback produces the strongest drift of the leading eigenvalue. The wavemaker region has then been successfully used to analyse the canonical circular cylinder wake flow (Marquet, Sipp & Jacquin Reference Marquet, Sipp and Jacquin2008; Camarri & Iollo Reference Camarri and Iollo2010; Giannetti, Camarri & Citro Reference Giannetti, Camarri and Citro2019; Giannetti, Camarri & Luchini Reference Giannetti, Camarri and Luchini2010). Meliga, Chomaz & Sipp (Reference Meliga, Chomaz and Sipp2009b) applied the theory to the wake of solid disks and spheres, while Ledda et al. (Reference Ledda, Siconolfi, Viola, Gallaire and Camarri2018) made use of the wavemaker definition in the understanding of the suppression of von Kármán vortex streets past porous rectangular cylinders.
Here we apply the theory of sensitivity analysis in order to investigate both the nature of the steady symmetry-breaking mode and to identify the physical mechanism from which the self-sustained oscillations originate.
7.1. Core of the steady symmetry-breaking instability
As mentioned, the wavemaker region is defined by the overlapping region of the direct and adjoint global modes. Using the results from the global stability analysis presented in § 4.2, the direct and adjoint velocity fields for the steady mode  $A$, here analysed and shown in figures 5 and 6, are used to build the wavemaker, defined as the product of the direct and adjoint velocity magnitudes
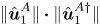 $\|\hat {\boldsymbol {u}}^{A}_1\|\boldsymbol {\cdot }\|\hat {\boldsymbol {u}}^{A{\dagger}ger }_1\|$.
The resulting wavemaker region for  $Re=22.65$ and
 $AR=6.98$, normalized by its maximum value,
 $\max {(\|\hat {\boldsymbol {u}}^{A}_1\|\boldsymbol {\cdot }\|\hat {\boldsymbol {u}}^{A{\dagger}ger }_1\|)}$, is displayed in figure 14, together with streamlines extracted by the steady base flow and the edge of the four symmetric recirculation bubbles. The stagnation point in
 $x=0$ and
 $y=0$ is clearly highlighted by the streamlines. The spatial distribution of the wavemaker is concentrated in the origin of the fluid domain, perfectly coincident with the stagnation point. As shown in § 6, such instability leads to an off-set of the stagnation point with respect to the
 $x$-axis of symmetry. While quite similar to symmetry-breaking bifurcations in expansion flows, the physical origin of the A-instability here therefore probably lies more in the structural instability of the stagnation point than in a Coandă effect where the side jets are attracted towards one wall. Broadly speaking, as one jet prevails over the other, the stagnation point is translated in either directions along the
 $y$-axis, the streamlines are bent with the dominated jet that has less space to curve towards the outlet channels. The size of the recirculation regions is readapted to maintain a steady configuration.
Structural sensitivity to a local feedback of the steady global mode  $A$ for
 $Re=Re_{C_2}=22.65$ and
 $AR=AR_{C_2}=6.98$. Colour map: wavemaker region. Black lines: streamlines extracted from the steady base flow,
 $\boldsymbol {u}_0$. Red dashed lines: recirculation bubble edges.

Note that a buckling-like instability of the colliding symmetric jets, in analogy with the classic buckling typical of structural mechanics, would intuitively lead to a steady bending of the jets which would displace the stagnation point along the  $y=0$ axis towards a positive or negative
 $x \neq 0$ off-set. Whether the second steady mode
 $C$ can be reasonably interpreted as such is discussed in appendix B.
7.2. Physical mechanism behind the origin of the self-sustained oscillatory mode $B$

7.2.1. Structural sensitivity: wavemaker region
Here we apply the same technique to the oscillatory instability. The wavemaker for mode  $B$ is thus given by
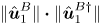 $\|\hat {\boldsymbol {u}}^{B}_1\|\boldsymbol {\cdot }\|\hat {\boldsymbol {u}}^{B{\dagger}ger }_1\|$. Figure 15(c) displays as a colour map the wavemaker region for
 $Re=22.65$ and
 $AR=6.98$, normalized by its maximum value. From the observation of the wavemaker region, it can be deduced that, as expected, the origin of the oscillations is located in the central portion of the domain, where the two facing jets strongly interact with each other. Moreover, the structure of the wavemaker associated with the oscillating global mode
 $B$ coincides for all the aspect ratio values which have been checked, i.e.
 $AR\in [6,20]$. Further progress in understanding the physical mechanism of this instability can be made analysing the vorticity field and the local maximum shear. The local
 $x$- and
 $y$-velocity profiles, independently considered as in the standard local and parallel linear theory and shown in figures 15(a) and 15(b), have been analysed and the corresponding loci of maximum shear, taken section by section, are plotted as red dashed lines in figure 15(c). It is seen that the local maximum shear related to the local
 $y$-velocity profiles follows surprisingly well the region of maximum values of the wavemaker. Additionally, the wavemaker presents four symmetric maximum intensity points (white circles in figure 15c) which approximately coincide with the intersections of the local maximum shear for the
 $y$- and
 $x$-velocity profiles.
Structural sensitivity to a local feedback of the oscillating global mode for  $Re=Re_{C_2}=22.65$ and
 $AR=AR_{C_2}=6.98$. (a,b) Plots of the
 $y$- and
 $x$-base-flow velocity profiles,
 $v_0$ and
 $u_0$, independently considered as in the classic local parallel theory. (c) Colour map: wavemaker region. White circles: maximum value of the normalized wavemaker. Black contours: base-flow vorticity field. Dashed red line: maximum shear of the
 $y$- and
 $x$-base-flow velocity profiles,
 $v_0$ and
 $u_0$ displayed in (a) and (b), respectively.

As a final comment, we can thus argue that, while the non-parallelism of the flow in the central region precludes the use of the classic local and parallel analysis to compare the present study and to firmly confirm the Kelvin–Helmholtz mechanism as the origin of the oscillatory instability, figure 15 suggests that the regions of maximum shear and the interaction of various shear layers play an important role in the physical mechanism engineering the global self-sustained oscillation.
7.2.2. Sensitivity to base-flow modifications
Let us now consider the sensitivity analysis to arbitrary and small-amplitude base-flow modifications,  $\delta \boldsymbol {u_0}$. In the linear global stability framework the parameter that defines if a mode is stable or unstable for a certain combination of control parameters, i.e. Reynolds number, is the growth rate,
 $\sigma$. We thus focus on the sensitivity of the growth rate associated with the global mode
 $B$,
 $\boldsymbol {\nabla }_{\boldsymbol {u_0}}\sigma _B$, which is a real quantity expressed as
 \begin{equation} \boldsymbol{\nabla}_{\boldsymbol{u}_{\boldsymbol{0}}}\sigma_B =\underbrace{-Re((\boldsymbol{\nabla}_{\boldsymbol{u}_0}\boldsymbol{\cdot} \hat{\boldsymbol{u}}^{B}_1)^H\cdot\hat{\boldsymbol{u}}^{B{\dagger}ger}_1)}_{\boldsymbol{\nabla}_{\boldsymbol{u}_{0,T}}\sigma_B} +\underbrace{Re(\boldsymbol{\nabla}_{\boldsymbol{u}_0}\hat{\boldsymbol{u}}^{B{\dagger}ger} \boldsymbol{\cdot}\boldsymbol{u}^{B*}_1)}_{\boldsymbol{\nabla}_{\boldsymbol{u}_{0,P}}\sigma_B}, \end{equation}
where  $\Re$ stands for the real part of the complex vector field,
 $^H$ designates the transconjugate, while the star
 $^*$ denotes the complex conjugate. For a complete and detailed description of the method, see Bottaro, Corbett & Luchini (Reference Bottaro, Corbett and Luchini2003); Marquet et al. (Reference Marquet, Sipp and Jacquin2008). Two different physical interpretations are inherent in the two terms appearing on the right-hand side of (7.1) (Marquet et al. Reference Marquet, Sipp and Jacquin2008). The first term, denoted by
 $\boldsymbol {\nabla }_{\boldsymbol {u}_{0,T}}\sigma _B$, represents the sensitivity of the growth rate
 $\sigma _B$ to modifications of the transport, since it originates from the transport of the perturbations by the base flow,
 $\nabla \hat {\boldsymbol {u}}^B_1\cdot \boldsymbol {u}_0$. The second term,
 $\boldsymbol {\nabla }_{\boldsymbol {u}_{0,P}}\sigma _B$, expresses the sensitivity to production, as it comes from the production of the perturbation by the base flow,
 $\nabla \boldsymbol {u}_0\cdot \hat {\boldsymbol {u}}^{B}_1$ (see Marquet et al. Reference Marquet, Sipp and Jacquin2008 for further details). An expression analogous to (7.1) can be derived for the sensitivity of the oscillation frequency, where the imaginary part of the complex vector field is considered. Marquet et al. (Reference Marquet, Sipp and Jacquin2008) argued that this distinction between transport and production mechanism identified from the sensitivity analysis is directly connected to the concept of convective and absolute instability adopted in the local stability theory, where the competition of transport and production mechanism defines the global behaviour of the flow (Huerre & Monkewitz Reference Huerre and Monkewitz1990).
The sensitivity of the growth rate associated with the oscillating global mode  $B$,
 $\sigma _B$, to modification of production and transport is shown in figures 16(a) and 16(b), respectively. The magnitude of the two different sensitivity fields is similar, meaning that the two mechanisms are equally important. However, an interesting aspect that can be clearly observed in figure 16 is the decoupling of the directions in which the two mechanisms mainly act. Indeed, the production mechanism is essentially located in the facing jets and in the
 $y$-flow direction (pointing towards the centre), while it vanishes moving away from the jets region. On the other hand, the transport mechanism, whose maximum intensity is also close to the jets region, mainly acts on the
 $x$-direction of the output channels. In other terms, if an increase of the base-flow velocity in the jets region and oriented in the
 $y$-direction is considered, this modification will contribute to a destabilization via the production mechanism (figure 16a), but it will involve the transport mechanism only weakly, since the two directions of action are almost decoupled. In the same way, considering the
 $x$-direction, if one considers a decrease of the base-flow velocity in the central region (or alternatively an increase in the size of the recirculation regions) then such a modification will destabilize the flow via the transport mechanism, but it will not play together with the production mechanism because of the mentioned decoupling.
Sensitivity of the growth rate  $\sigma _B$ to base-flow modification for
 $Re=Re_{C_2}=22.65$ and
 $AR=AR_{C_2}=6.98$. (a) Sensitivity function to modification of the production,
 $\boldsymbol {\nabla }_{\boldsymbol {u}_{0,P}}\sigma _B$. (b) Sensitivity function to modification of the transport,
 $\boldsymbol {\nabla }_{\boldsymbol {u}_{0,T}}\sigma _B$. Filled contours: magnitude of the two real vector velocity field. Red arrows: vector fields orientation.

8. Different inlet velocity profiles: plug flow
We conclude our analysis examining the influence of a different inlet velocity profile, by specifically focusing on a plug flow, inspired by Pawlowski et al. (Reference Pawlowski, Salinger, Shadid and Mountziaris2006). In this study, the authors perform a detailed stability analysis, which provides a wide-ranged stability map in the  $(Re,AR)$-parameter space. The very same steady symmetry-breaking and oscillatory instabilities, as well as the existence of a codimension-2 point, were found, suggesting that the inlet profile does not seem to qualitatively influence the nature of these instabilities. However, from a more quantitative view point, the instability thresholds are significantly affected when a fully developed flow is replaced by a plug flow. Interestingly, despite the fact that the overall nature of the bifurcation nature does not change when varying the inlet profile, Pawlowski et al. (Reference Pawlowski, Salinger, Shadid and Mountziaris2006) did not report the presence of any hysteretic behaviour. In the following, we apply the weakly nonlinear theory outlined in § 5 to the case of the plug inlet flow studied by Pawlowski et al. (Reference Pawlowski, Salinger, Shadid and Mountziaris2006) and we briefly discuss their results in relation with our analysis.
In figure 17 we propose a zoom of their stability map in the neighbourhood of the codimension-2 point. We extracted manually values, shown as white triangles and circles in figure 17 (in both the main figure and inset), from their stability curves (note that their aspect ratio is defined as  $1/AR=w/s$). Clearly, the wide range of
 $Re$ and
 $AR$ and the large thickness of the lines displayed in figure 10 of Pawlowski et al. (Reference Pawlowski, Salinger, Shadid and Mountziaris2006) make the extraction procedure only approximate. We note that the value of the codimension-2 point reported in the main text,
 $C_2=(11.2,13.33)$, by Pawlowski et al. (Reference Pawlowski, Salinger, Shadid and Mountziaris2006) does not seem to match the value extracted from their plot, which is instead in fairly good agreement with our calculations, for which
 $C_2=(20.9,10.53)$. If our marginal stability curve for mode
 $A$ (dark green dotted lines in the inset) matches very well their result, this is not the case for the curve associated to mode
 $B$ (blue dotted line in the inset) for
 $AR<AR_{C_2}$. Indeed, the white circles are obtained from the linear stability analysis of the bifurcated steady asymmetric state, while our blue dotted line is evaluated from the stability of the steady symmetric base flow. We thus apply the WNL analysis around
 $C_2$ and the corresponding weakly nonlinear stability boundaries are displayed in the inset as black solid lines. First we notice that the WNL analysis based on the symmetric base flow captures their threshold for the unsteady mode B correctly. Furthermore, analogously to the fully developed flow case, the WNL approach detects an hysteresis region, not described in Pawlowski et al. (Reference Pawlowski, Salinger, Shadid and Mountziaris2006). We therefore performed DNS to confirm the WNL prediction.
Stability map taken from figure 10 of Pawlowski et al. (Reference Pawlowski, Salinger, Shadid and Mountziaris2006). White triangles and circles are the values that we extracted manually from their curves. Inset: our weakly nonlinear map for the case of a uniform inlet flow, where our definition of  $AR$ is adopted in the
 $y$-axis. Dark green and blue dotted lines in the inset indicate the linear marginal stability curves obtained from our calculation for mode
 $A$ and
 $B$, respectively. Black lines in the inset represent our weakly nonlinear stability boundaries, as described in § 5. The light grey shaded region in the inset corresponds to the hysteresis. The green filled circle indicate the position of the codimension-2 point reported in Pawlowski et al. (Reference Pawlowski, Salinger, Shadid and Mountziaris2006), while the red filled circle is the codimension-2 point obtained from our calculation.

In figure 18 the  $y$-position of the stagnation point normalized by the aspect ratio,
 $y^{sp}/AR$ (
 $AR=8$), is used to characterize the bifurcation diagram. As in § 5, four regions, denoted here by numbers, can be identified and the associated phase diagrams (amplitude of mode
 $|B|$ vs.
 $A$) are shown for completeness, following Kuznetsov (Reference Kuznetsov2013). The black solid and dashed lines correspond to the stable and unstable branches described in figure 11 of Pawlowski et al. (Reference Pawlowski, Salinger, Shadid and Mountziaris2006), while the light grey shaded region is the hysteresis detected by our WNL model. Symbols correspond to our DNS. Pawlowski et al. (Reference Pawlowski, Salinger, Shadid and Mountziaris2006) started from
 $Re=1$ and increased
 $Re$ progressively. The reason they could not detect hysteresis is intrinsic to their continuation algorithm, which describes the transition from region 2 to region 4 (see figure 18) following the same branch. In other words, their initial conditions in region 3 (hysteresis) are taken from region 2 (steady asymmetric state) and, therefore, always lie in the lower right part of the phase diagram 3. Consequently, the final solution converges to the steady asymmetric configuration
 $A$. Indeed, the left upper part of the phase portrait 3 can be explored only by considering progressive decreases of
 $Re$ from region 4 (oscillating regime) to 3, as in our DNS, which are in good agreement with the WNL model prediction. Hence, the WNL model adds new information, at least in the region of the parameter space close to the codimension-2 point, to the thorough stability analysis proposed by Pawlowski et al. (Reference Pawlowski, Salinger, Shadid and Mountziaris2006).
Bifurcation diagram:  $y$-position of the stagnation point versus
 $Re$. The black solid and dashed lines correspond to the stable and unstable branches of the bifurcation diagram shown in figure 11 of Pawlowski et al. (Reference Pawlowski, Salinger, Shadid and Mountziaris2006), calculated following the path of increasing
 $Re$ (
 $AR$ is fixed to
 $8$). The light grey shaded region is the hysteresis predicted by our WNL model. Symbols indicate the DNS results (see figure 12b) for the notation). A sketch of the phase portrait is given for each regime: 1, stable symmetric base flow; 2, steady asymmetric configuration; 3, hysteresis; and 4, oscillating regime.

9. Conclusion
In the present paper we investigated different physical mechanisms arising in a 2-D fluidic oscillator with two impinging jets, in a so-called 2-D X-junction. The tools of the LGS were used to identify different global modes, whose stability properties depend on the two main control parameters, the Reynolds number,  $Re$, and the aspect ratio,
 $AR$. An oscillating mode that produces self-sustained oscillations qualitatively analogous to those observed in 3-D fluidic cavities (Bertsch et al. Reference Bertsch, Bongarzone, Duchamp, Renaud and Gallaire2020a) was retrieved. The origin of such a phenomenon appears therefore as mainly two dimensional and due to the interaction of the two facing jets.
In a certain range of aspect ratios, when the gap length,  $s$, separating the two inlets approaches the inlet width,
 $w$, the unsteady mode is seen to globally interact with a steady symmetry-breaking instability. A WNL, based on the multiple scale technique and showing how the system may present hysteretic behaviours depending on the initial conditions, was formalized. The predicted normal form describes the nonlinear interactions between global modes
 $A$ (steady) and
 $B$ (oscillating) and reduces the full dynamics to a low-dimensional model, as typical of WNL formulations. For codimensions larger than one, as in the present case, which displays a codimension-2 point, the normal form often predicts successfully the system behaviour (Crawford & Knobloch Reference Crawford and Knobloch1991; Meliga et al. Reference Meliga, Chomaz and Sipp2009a; Zhu & Gallaire Reference Zhu and Gallaire2017). Indeed, a quantitative comparison of our WNL results against DNS, in terms of oscillation frequency and mode amplitudes, confirms the validity of the WNL analysis and, in particular, the existence of a narrow region of hysteresis for
 $AR<AR_{C_2}$ and
 $Re_{BA}<Re<Re_{SHB}$.
Furthermore, in analogy with the 3-D flow studied by Bertsch et al. (Reference Bertsch, Bongarzone, Duchamp, Renaud and Gallaire2020a), the oscillation frequency associated to unsteady instability was seen to be inversely proportional to the distance separating the two inlets,  $s$, or, in non-dimensional terms, to the aspect ratio,
 $AR$.
In principle, a steady symmetry-breaking condition, as the one represented by the global mode  $A$, and the associated hysteresis, similar to that here described in two dimensions, is expected to be retrieved in 3-D cavities for proper geometrical parameters, i.e. for a size of the perpendicular
 $z$-direction sufficiently larger than the distance
 $s$. Nevertheless, the eventual narrowness of the hysteresis region in the control parameter space could make it hard to be experimentally detected.
A linear sensitivity analysis and the definition of the wavemaker region were then systematically applied in order to explore the origin of the various instabilities observed. The core of the steady instability associated to mode  $A$, which breaks the base-flow symmetry with respect to the
 $x$-axis, was shown to be spotted in the hyperbolic stagnation point. We showed how the self-sustained oscillatory regime, also observed in 3-D flow configurations (Bertsch et al. Reference Bertsch, Bongarzone, Duchamp, Renaud and Gallaire2020a), was relying on shear instabilities. The structural sensitivity of the unsteady mode and its accurate examination allowed us to identify the Kelvin–Helmholtz shear instability, located in the jets interaction region, as the heart of the physical mechanism behind the self-sustained oscillatory regime.
Lastly, we examined the effect of a different inlet velocity profile, e.g. a plug flow, in analogy with Pawlowski et al. (Reference Pawlowski, Salinger, Shadid and Mountziaris2006). Similarly to the case with a fully developed inlet flow, the WNL could detect hysteresis in a narrow region of the parameter space, whose existence was not discussed by Pawlowski et al. (Reference Pawlowski, Salinger, Shadid and Mountziaris2006). The physical nature of the instabilities remained the same, but their thresholds can differ significantly, calling for a sensitivity analysis of the inlet velocity profile. Indeed, in many practical situations, the inlet profile is neither fully developed, nor uniform, but rather lies in an intermediate case.
Funding
We acknowledge the Swiss National Science Foundation under grant 200021_178971.
Conflicts of interest
The authors report no conflict of interest.
Appendix A. Convergence analysis for the eigenvalue calculations and the amplitude equation coefficients
The convergence analysis for the eigenvalue calculations presented in § 4 is shown in table 1 for five different meshes M1–M5, which differ by the vertex densities  $n_i$ in the various sub-domains displayed in figure 2.
Eigenvalue convergence associated with the computational domain presented in figure 2. Tolerance on the real part of the eigenvalues  $\lambda ^A$ and
 $\lambda ^B$, associated to global modes
 $A$ and
 $B$, is set to
 $\textrm {tol}_{Re(\lambda )}=5\times 10^{-5}$. When
 $|Re{(\lambda )}|<\textrm {tol}_{Re(\lambda )}$, the modes are considered marginally stable for such a combination of Reynolds number,
 $Re$, and aspect ratio,
 $AR$, which will define a codimension-2 point
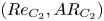 $(Re_{C_2},AR_{C_2})$. Mesh M1 ensures the convergence of the eigenvalue computations in a range of
 $AR$ and
 $Re$ is explored; however, mesh M5 must be adopted to guarantee an acceptable convergence in the WNL (see table 2). Here
 $L_{out}$ is fixed to
 $70$.

A similar convergence analysis for the nonlinear coefficients of the normal form (5.16) and (5.17) derived in § 5 is provided in table 2. As shown in table 1, mesh M1 is already excellent for the linear eigenvalue problem. Moreover, the structural sensitivity presented in § 7 highlights the fluid domain region in which all the physical mechanisms occur, suggesting that the length of the computational domain could be reduced from  $L_{out}=70w$ up to
 ${\approx }30w$, without any influence on the eigenvalue calculation (numerically verified). However, the weakly nonlinear problem and the calculation of the coefficient of the normal form requires a finer mesh and an adequate domain length in order to get an optimal convergence. Table 2 shows that when the mesh is refined from M4 to M5 the major relative error (coefficient
 $\eta _A$) is less than
 $1\,\%$. Note that this is the numerical precision of the calculation performed, which is not linked to the convergence of the asymptotic expansion, whose precision increases as
 $|Re-Re_{C_2}|$ and
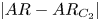 $|AR-AR_{C_2}|$ decrease.
Values of the amplitude equation coefficients for global modes  $A$ and
 $B$ corresponding to the case of a fully developed inlet velocity profile and calculated for different meshes M1–M5.

The expression of the various normal form coefficients are provided in the following:
 \begin{equation} \zeta_A={-}\langle \hat{\boldsymbol{q}}_1^{A{\dagger}ger},(\mathscr{D}_{AR_{C_2}}\hat{\boldsymbol{q}}_1^{A} +\mathscr{C}_{AR_{C_2}}[\hat{\boldsymbol{q}}_1^{A},\hat{\boldsymbol{q}}_2^{\delta}])\rangle , \end{equation}
 \begin{equation}\zeta_B={-}\langle \hat{\boldsymbol{q}}_1^{B{\dagger}ger},(\mathscr{D}_{AR_{C_2}}\hat{\boldsymbol{q}}_1^{B} +\mathscr{C}_{AR_{C_2}}[\hat{\boldsymbol{q}}_1^{B},\hat{\boldsymbol{q}}_2^{\delta}])\rangle, \end{equation}
 \begin{equation}\eta_A={-}\left\langle \hat{\boldsymbol{q}}_1^{A{\dagger}ger},\left(-\frac{2}{Re_{C_2}}\mathscr{D}_{\alpha AR_{C_2}}\hat{\boldsymbol{q}}_1^{A}+\mathscr{G}_{\alpha}\hat{\boldsymbol{q}}_1^{A}+\mathscr{C}_{\alpha} [\boldsymbol{q}_0,\hat{\boldsymbol{q}}_1^{A}]+\mathscr{C}_{AR_{C_2}} [\hat{\boldsymbol{q}}_1^{A},\hat{\boldsymbol{q}}_2^{\alpha}]\right)\right\rangle , \end{equation}
 \begin{equation}\eta_B={-}\left\langle \hat{\boldsymbol{q}}_1^{B{\dagger}ger},\left(-\frac{2}{Re_{C_2}}\mathscr{D}_{\alpha AR_{C_2}}\hat{\boldsymbol{q}}_1^{B}+\mathscr{G}_{\alpha}\hat{\boldsymbol{q}}_1^{B}+\mathscr{C}_{\alpha} [\boldsymbol{q}_0,\hat{\boldsymbol{q}}_1^{B}]+\mathscr{C}_{AR_{C_2}} [\hat{\boldsymbol{q}}_1^{B},\hat{\boldsymbol{q}}_2^{\alpha}]\right)\right\rangle , \end{equation}
 \begin{equation}\mu_A=\langle \hat{\boldsymbol{q}}_1^{A{\dagger}ger},\mathscr{C}_{AR_{C_2}} [\hat{\boldsymbol{q}}_1^{A},\hat{\boldsymbol{q}}_2^{A^2}]\rangle , \end{equation}
 \begin{equation}\mu_B=\langle \hat{\boldsymbol{q}}_1^{B{\dagger}ger},(\mathscr{C}_{AR_{C_2}} [\hat{\boldsymbol{q}}_1^{B},\hat{\boldsymbol{q}}_2^{|B|^2}] +\mathscr{C}_{AR_{C_2}}[\hat{\boldsymbol{q}}_1^{B^*},\hat{\boldsymbol{q}}_2^{B^2}])\rangle, \end{equation}
 \begin{equation}\chi_A=\langle \hat{\boldsymbol{q}}_1^{A{\dagger}ger},(\mathscr{C}_{AR_{C_2}} [\hat{\boldsymbol{q}}_1^{A},\hat{\boldsymbol{q}}_2^{|B|^2}] +\mathscr{C}_{AR_{C_2}}[\hat{\boldsymbol{q}}_1^{B^*},\hat{\boldsymbol{q}}_2^{AB}])\rangle, \end{equation}
 \begin{equation}\chi_B=\langle \hat{\boldsymbol{q}}_1^{B{\dagger}ger},(\mathscr{C}_{AR_{C_2}} [\hat{\boldsymbol{q}}_1^{B},\hat{\boldsymbol{q}}_2^{A^2}] +\mathscr{C}_{AR_{C_2}}[\hat{\boldsymbol{q}}_1^{A},\hat{\boldsymbol{q}}_2^{AB}])\rangle. \end{equation}
Here, given two generic vectors  $\boldsymbol {a}$ and
 $\boldsymbol {b}$,
 $\mathscr {C}_{AR_{C_2}}[\boldsymbol {a},\boldsymbol {b}]=\{\mathcal {C}_{AR_{C_2}}(\boldsymbol {a},\boldsymbol {b}),0\}^{\textrm {T}}$,
 $\mathscr {D}_{AR_{C_2}}\boldsymbol {a}=\{\varDelta _{AR_{C_2}}\boldsymbol {a},0\}^{\textrm {T}}$ and
 $\mathscr {C}_{\alpha }[\boldsymbol {a},\boldsymbol {b}]=\{\mathcal {C}_{\alpha }(\boldsymbol {a},\boldsymbol {b}),0\}^{\textrm {T}}$,
 $\mathscr {D}_{\alpha AR_{C_2}}\boldsymbol {a}=\{\varDelta _{\alpha AR_{C_2}}\boldsymbol {a},0\}^{\textrm {T}}$, while
 $\mathscr {G}_{\alpha }\hat {\boldsymbol {q}}_1^{A,B}=\{\boldsymbol {\nabla }_{\alpha }\hat {p}_1^{A,B},\boldsymbol {\nabla }_{\alpha }^{\textrm {T}}\hat {\boldsymbol {u}}_1^{A,B}\}^{\textrm {T}}$. The star
 $^*$ denotes the complex conjugate.
Appendix B. Flow behaviour at higher Reynolds numbers
In § 4.2 the existence of a second steady global mode (denoted by  $C$), which, from the global stability analysis, appears to be unstable for
 $Re=41.5$,
 $AR=6.5$ (see figure 19c), was mentioned. When the threshold for mode
 $C$ is met, global modes
 $A$ and
 $B$ are both unstable. This evidence does not justify either the application of the linear stability tools or the WNL (the corresponding thresholds are too far from each other). Nevertheless, some information can still be extracted by looking at the DNS results for higher Reynolds numbers, i.e.
 $Re=50$, and, in particular, at the spatial structure of this mode. Figure 19(a) shows the flow configuration for
 $Re=50$ and
 $AR=6.5$. As can be observed, in figure 19(b), where the magnitude of the velocity field is plotted for two symmetric slices at coordinates
 $x=-5$ and
 $x=+5$, for such combination of control parameters, the symmetry of the flow (in terms of field magnitude) with respect to the
 $y$-axis is lost.
Snapshot of the unsteady flow configuration in terms of dye concentrations for  $Re=50$ and
 $AR=6.5$. Two slices at
 $x=-5$ and
 $x=+5$ are extracted and used to plot the magnitude of the velocity field (b). (c) Marginal stability curves for global modes
 $A$,
 $B$ and
 $C$ as a function of
 $Re$ and
 $AR$ (as in figure 4). Here LS denotes linearly stable and LU denotes linearly unstable. Red circle: DNS parameters for the present case.

It can be argued that the cause of such a behaviour is the second steady mode,  $C$, which results to be unstable, with a growth rate
 $\sigma _C=0.016$ (and frequency
 $\omega _C=0$), for the DNS parameters here presented. Figure 20(a,b) displays the spatial structure of the
 $x$- and
 $y$-velocity components associated with the mode. The eigenfunctions for
 $\hat {u}^{C}_1$ and
 $\hat {v}^{C}_1$ exhibits the same symmetry properties characterizing the oscillating mode
 $B$ (see figure 5b,d). However, the steady nature of this mode leads to a double steady symmetry-breaking condition (both axes of symmetry). The associated wavemaker region, computed as described in § 7, is shown in figure 20(c). The overlapping region highlighted by the structural sensitivity appears to be approximately localized at the boundaries of the recirculation regions. The nature of this instability could be reasonably classified as a buckling-like instability, where the symmetric configuration with two facing jets, above a certain critical Reynolds number, which represents a measure of the jet intensities, becomes unstable and the jets tend to bend towards opposite directions, as clearly shown in figure 20(d). The shape and size of the four recirculation regions are then readapted to the new steady configurations.
Spatial structure of the  $x$- and
 $y$-velocity components associated with the direct global mode
 $C$ for
 $Re=50$ and
 $AR=6.5$, for which the base flow is marginally stable. (a) Plot of the
 $x$-velocity component. (b) Plot of the
 $y$-velocity component. (c) Colour map: structural sensitivity to a local feedback of the steady global mode
 $C$, expressed as
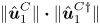 $\|\hat {\boldsymbol {u}}^{C}_1\|\boldsymbol {\cdot }\|\hat {\boldsymbol {u}}^{C{\dagger}ger }_1\|$ and normalized by its maximum value. Black contours: magnitude of the base-flow field. Red dashed lines: boundaries of the recirculation bubbles. (d) Streamline associated with the sum of the steady base flow and the steady unstable mode
 $C$. A fictitious amplitude of
 $0.25$ is imposed to the perturbation in order to get a good visualization of the streamlines modification. Red solid lines: axes of symmetry.

In the recent 3-D experimental and numerical investigation proposed by Bertsch et al. (Reference Bertsch, Bongarzone, Duchamp, Renaud and Gallaire2020a) for straight output channels, as the 2-D one analysed in the present paper, the self-sustained oscillatory regime, observed in a certain range of Reynolds numbers, is seen to be strongly altered as  $Re$ is increased (
 $Re\approx 100$ or higher). In particular, the two facing jets tend to suddenly switch left or right (and vice versa) and to keep that position steadily for a while. Fast oscillations are simultaneously present and sometimes the jets switch side. The existence of an analogous steady symmetry-breaking condition in the 3-D problem is in principle expected and its strong nonlinear interaction with the self-sustained oscillations for high Reynolds numbers could hypothetically and qualitatively justify the flow behaviour shown in Bertsch et al. (Reference Bertsch, Bongarzone, Duchamp, Renaud and Gallaire2020a) (see associated supplemental material at http://link.aps.org/supplemental/10.1103/PhysRevFluids.5.054202).
Appendix C. Temporal linear stability of the local velocity profiles in the lateral channel
The wavemaker analysis proposed in § 7 suggests that the Kelvin–Helmholtz mechanism plays an important role in the oscillatory instability. Nevertheless, the Kelvin–Helmholtz instability has an inviscid origin, while the low Reynolds numbers encountered in this flow suggest that viscous effects could be dominant and consequently that they could inhibit the Kelvin–Helmholtz instability. In this appendix we propose a temporal linear stability of the local velocity profiles in the lateral channel (see figure 15b), which highlights that the Kelvin–Helmholtz mechanism is actually active in the underlying process.
If we assume that the steady base flow in the right (or left, symmetric base flow) output channel is locally parallel, i.e. we assume that the  $y$-steady base-flow velocity component is zero and the
 $x$-component depends only on
 $y$,
 $\boldsymbol {u}_0=\{u_0(y),0\}^{\textrm {T}}$, then we can tentatively apply the parallel stability theory. Linearizing the Navier–Stokes equation around the locally parallel base flow and using the ansatz,
 $\boldsymbol {u}(x,y,t)=\hat {\boldsymbol {u}}(y)\,\textrm {e}^{\text {i}(kx-\lambda t)}$ and
 $p(x,y,t)=\hat {p}(y)\,\textrm {e}^{\text {i}(kx-\lambda t)}$, with
 $k$ spatial wavenumber, we obtain the linear system
 \begin{equation} 0=\text{i}k\hat{u}+\frac{\partial\hat{v}}{\partial y}, \end{equation}
 \begin{equation}-\text{i}\lambda\hat{u}={-}\text{i}ku_0\hat{u}-\hat{v}\frac{\partial\widehat{u_0}}{\partial y}-\text{i}k\hat{p}+\frac{1}{Re}\left({-}k^2+\frac{\partial^2}{\partial y^2}\right)\hat{u}, \end{equation}
 \begin{equation}-\text{i}\lambda\hat{v}={-}\text{i}ku_0\hat{u}-\frac{\partial p}{\partial y}+\frac{1}{Re}\left({-}k^2+\frac{\partial^2}{\partial y^2}\right)\hat{v}, \end{equation}
subjected to a no-slip boundary condition at the upper and lower walls. The system above, formally equivalent to the Orr–Sommerfeld equation expressed in primitive variables, reduces to a generalized eigenvalue problem in  $\lambda$ (the real wavenumber
 $k$ is an input), whose temporal stability associated with the base flow for each
 $x$-slice is studied numerically using a validated Chebyshev pseudo-spectral code. A one-dimensional grid in the
 $y$-direction made of 100 collocation points ensures convergence for the present case. The main results are shown in figure 21.
Temporal analysis of the  $x$-velocity profiles shown in figure 15(b) and corresponding to
 $Re = Re_{C_2}=22.65$ and
 $AR = AR_{C_2}=6.98$. Left plot: frequency
 $-\omega$ versus wavenumber
 $k$. Right plot: growth rate
 $\sigma$ versus wavenumber
 $k$. The maximum growth rate is found for
 $x = 2$ and corresponds to
 $k \approx 0.71$ (wavelength
 $\approx$8.8) and to an oscillation frequency
 $\omega = 0.101$.

We observe that there exists a spatial region, approximatively between  $x=1$ and
 $x=5$, in which the local profiles are temporally unstable. Interestingly, the maximum growth rate, obtained for
 $x=2$, is characterized by a spatial wavenumber
 $k\approx 0.7$, which corresponds to a wavelength
 $\approx 9$, in good agreement with the one observed in our oscillatory global mode (see figure 5d). Furthermore, the associated oscillation frequency is
 $\omega =0.1$, a value which matches the global frequency well. Lastly, the local temporal analysis predicts a sinuous mode (not shown here), while varicose modes are always stable, in agreement with global observations again.
A similar analysis can be repeated for the jet profiles selected along the  $y$-axis (figure 15a). These profiles are also found to be temporally unstable, but the interpretation of the results in terms of wavenumber and frequency is far from being trivial, since the features of the instability are clearly visible only in the lateral output channels.
We then performed a spatio-temporal instability analysis, where  $\lambda$ and
 $k$ are both complex quantities, but we found that the pocket of temporal instability is associated to a convective instability (results not shown here).
As stated in § 7 and highlighted by the wavemaker (figure 15c), the instability mechanism seems to be intrinsically global and due to the interaction of multiple shear layers (jets and horizontal flows), which communicate in the central region of the domain, where the flow is strongly non-parallel. For all these reasons, we believe that the employment of the classic local theory is not legit in our case. Nevertheless, the temporal analysis proposed in this appendix, together with consideration about the location of the maximum shear made in § 7, shows that the Kelvin–Helmholtz instability is active and that it could play a relevant role in the instability mechanism, despite the potentially high viscous effects.



