Quality healthcare delivery and patient safety are a priority to all healthcare stakeholders, and recent changes in national health policies reflect this focus on quality of care. Many healthcare reforms focus on payments, such as value-purchasing programs that reward better outcomes delivered at lower costs.Reference VanLare and Conway 1 To identify target outcomes that can be monitored in such programs, the national quality forum defined several serious medical errors that are of concern to both patients and providers and are potentially preventable with focused quality improvement efforts, commonly known as “never events.” 2
In October 2008, to improve patient safety and reduce medical errors, the Centers for Medicare and Medicaid Services (CMS) implemented a policy that penalizes hospitals for certain never events occurring during hospitalization among the Medicare population. Surgical site infection (SSI) following certain orthopedic procedures was among these targeted hospital-acquired conditions (HACs). Under this new policy, hospitals could no longer use a higher-level Medical Severity Diagnosis-Related Group (MS-DRG) denoting a complication that would result in higher reimbursements if the complication occurred after admission. 3 , 4
Orthopedic procedures, which are among the most commonly performed surgical procedures in the United States,Reference Rockvelle 5 have become an important focus among efforts to reduce SSI rates.Reference Greene 6 The CMS policy specifically prohibits the designation of a higher-reimbursement MS-DRG group for SSIs following spine fusion, shoulder and elbow arthrodesis and repair, and spinal refusion procedures, but it does not include more common, less invasive orthopedic procedures such as hip and knee replacements. Surgical site infection rates range from 1% to 14% for these surgeries, and spinal fusion surgeries are usually associated with a higher risk of complications and mortality due to the invasiveness of these procedures and the placement of foreign implants.Reference Radcliff, Neusner and Millhouse 7 – Reference Belatti and Phisitkul 9 Taken together, the estimated annual cost to Medicare for SSIs following these orthopedic procedures is approximately $3.5 million,Reference Kandilov, Coomer and Dalton 10 and they cost up to 3.8 times more than an uncomplicated procedure.Reference Daniels, Kawaguchi and Hart 11 , Reference Coomer and Kandilov 12 Other estimates have cited $565 million additional costs to hospitals annually due to HACs targeted by CMS, with most of the added cost attributable to orthopedic infections.Reference McNair and Luft 13 To date, the effect of the CMS nonpayment penalty on patient outcomes has remained unclear.
To examine the policy’s impact on targeted orthopedic SSI rates, we conducted a difference-in-difference analysis comparing the change in SSI rates among the Medicare population, who were directly affected by the policy before and after October 2008 to the change in rates among a similar age group in the non-Medicare population (control group) from 2000 to 2013. Our study provides new information about the relationship between the CMS nonpayment penalty and the targeted patient safety event.
METHODS
Data
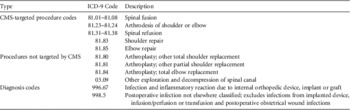
We analyzed data from the Healthcare Cost and Utilization Project (HCUP) National Inpatient Sample (NIS) from 2000 to 2013, the largest publicly available all-payer administrative database on hospital discharges. Following sampling redesign in 2012, the NIS approximates a 20% sample of discharges from all US community hospitals. We selected all inpatient discharges for 60–80-year-old patients who underwent spinal fusions, spinal refusions, and shoulder and elbow arthrodesis and repair procedures. Patients were identified using primary International Classification of Disease, Ninth Revision (ICD-9) procedure and diagnosis codes as defined by CMS. 14 (Table 1). Primary payer status was used to differentiate Medicare and non-Medicare patients.
Diagnosis and Procedure ICD-9 Codes Identifying Orthopedic Procedures and Surgical Site Infections

NOTE. ICD-9, International Classification of Disease, Ninth Revision; CMS, Centers for Medicare and Medicaid Services.
In the analyses, we controlled for several patient and hospital characteristics. At the patient level, we controlled for age, gender, race (white, black, Hispanic, Asian, other/missing), elective admission, and comorbidities present on admission. We also controlled for hospital variables, including median household income for the patient’s ZIP code, teaching hospital, and urban or rural location.
Analysis
Looking at SSI rates during pre- and postpolicy periods, we compared the change in rates of SSI among discharges having Medicare as the primary expected payer (60–80-year-old patients), relative to changes in rates among the non-Medicare population (60–80-year-old patients). The prepolicy period was defined as January 1, 2000, through September 30, 2008, and the postpolicy period was defined as October 1, 2008, through December 31, 2013.
The analysis first identified the discharge rates of any diagnosed SSI as defined by the policy (Table 1) among the Medicare and control populations. The rate of SSI was compared pre- and postpolicy implementation among the 2 populations using a difference-in-difference approach,Reference Farrar, Yi, Sutton, Chalkley, Sussex and Scott 15 – Reference Bertrand, Duflo and Mullainathan 17 as in previous studies.Reference Dimick and Ryan 18 , Reference Gidwani and Bhattacharya 19 We assumed that both Medicare and non-Medicare populations were similarly affected by larger secular trends and therefore had parallel time trends in SSI rates prior to the intervention. To determine prepolicy parallelism, we tested whether the regression mean functions of the Medicare and control groups were parallel. Because the policy only applied to Medicare patients, the difference in the change in SSI rates after policy implementation between Medicare and non-Medicare populations would be the policy’s intervention effect. Given that SSIs after these procedures were relatively rare events, we estimated rate ratios (RRs) using a Poisson regression model, and we adjusted for other patient- and hospital-level variables. The interaction between time period and payer status (Medicare vs non-Medicare) variables represent the intervention effect. Because not all sampled hospitals had discharges for spinal fusion or shoulder and/or elbow repairs, the use of sampling weights would result in erroneously smaller standard errors.Reference Houchens and Elixhauser 20 Thus, we chose to report unweighted results in our regression models to reduce type 1 error, as others have done.Reference Gidwani and Bhattacharya 19 However, we reported weighted results for population demographics and other descriptive statistics to obtain nationally representative estimates.
For our sensitivity analysis, we included an intervention washout period in our model from January to December 2008 to account for anticipatory or lagged responses to CMS policy. Second, we ran a hierarchical regression model with hospital random effects to cluster patients by hospital and to detect any differential effect. This analysis was limited to data prior to 2012 due to NIS sampling redesign. Third, for patients undergoing lumbar laminectomies or total shoulder and elbow replacement procedures not targeted by CMS policy (identified using International Classification of Disease, Ninth Revision codes), we compared the Medicare group against 3 different control groups: non-Medicare 60–64-year-old patients, 65–69-year-old patients with private insurance, and Medicare 60–80-year-old patients (Table 1). These procedures had been used as comparisons in previous studies examining SSIs.Reference Coomer and Kandilov 12 Patient visits that included a CMS targeted procedure were excluded from the control group. Finally, we ran the difference-in-differences models in 3 all-capture state inpatient databases (SID) from California, Florida, and New York.Reference Rockvelle 5 These states were chosen because of data availability and sizeable state populations. SID databases had the added value of tracking patient visits across different hospitals and facilities within the state. Thus, we ran another analysis that included readmissions due to SSIs that occurred within 30 days postdischarge. Prepolicy parallelism was tested in all models to ensure that difference-in-difference assumptions were satisfied. Analyses were performed using SAS 9.4 software (SAS Institute, Cary, NC) and STATA v14 software (StataCorp, College Station, TX). This study was determined by our institutional review board to be exempt from the need for approval.
RESULTS
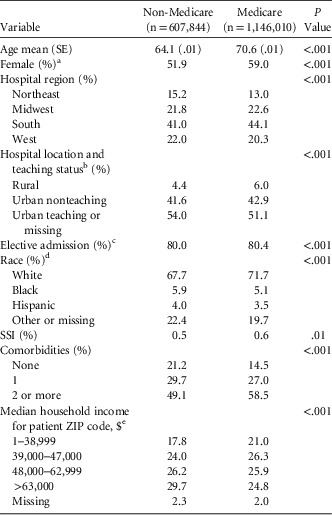
We identified 1,753,854 orthopedic discharges (unweighted: 367,017) and 10,211 SSIs (unweighted: 2,136) in our population. The probability of an SSI pre- and postpolicy were 0.7% and 0.5%, respectively, for the Medicare population and 0.6% and 0.5%, respectively, for the non-Medicare population. Figure 1 presents weighted quarterly data from 2000 to 2013 on number of SSIs per 1,000 procedures for Medicare and non-Medicare populations. This figure shows qualitatively that rates of SSI were decreasing steadily in parallel. In addition, our parallel trends test showed that trends prior to October 2008 SSI rates did not differ significantly (P=.6287), which satisfies difference-in-difference assumptions. The demographics of the 2 groups were clinically similar despite having significant P values (Table 2).
Crude surgical site infection (SSI) rates from 2000 to 2013 by payer status. SSI rates were calculated as the number of SSIs that occurred per 1,000 orthopedic procedures performed for each discharge quarter. National Inpatient Sample data sampling weights were applied to account for variations in sampling method over the years. The vertical line represents the Centers for Medicare and Medicaid Services (CMS) policy implementation date. Trend lines (dashed: Medicare; solid: non-Medicare) for both populations were not adjusted for patient and hospital variables.

Characteristics of Hospitals and Patients Who Underwent Orthopedic Procedures

NOTE. SSI, surgical site infection; SE, standard error.
a Missing 0.02% of observations.
b Missing 0.5% of observations.
c Missing 7.8% of observations.
d Missing 17.6% of observations.
e Missing 2.0% of observations.
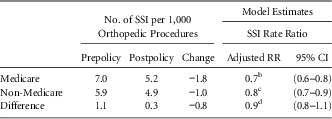
Table 3 shows that the number of SSIs per 1,000 orthopedic procedures decreased by 1.8 and 1.0 for Medicare and non-Medicare populations, respectively, after policy implementation. Therefore, the absolute difference was −0.8 SSI per 1,000 orthopedic procedures. The adjusted regression-based RR estimates of SSI were similar, with decreases of 0.7 (95% confidence interval [CI], 0.6–0.8) for the Medicare population and 0.8 (95% CI, 0.7–0.9) for the non-Medicare population. The estimated policy effect to reduce SSI among the Medicare population compared to the control population was not significant (RR, 0.9; 95% CI, 0.8–1.1).
Changes in Surgical Site Infection Rates by Payer Status, 2000–2013Footnote a

NOTE. SSI, surgical site infection; CI, confidence interval.
a The model was unweighted and adjusted for age, sex, race, and median household income for patient’s zip code, comorbidities, elective admission, and hospital characteristics including hospital region and hospital teaching status. The interaction of postpolicy period and payer status variable was the difference-in-difference estimate. Any discharge before October 1, 2008, was considered to have occurred in the prepolicy period.
b P<.0001.
c P=.0006.
d P=.2821.
Our results were robust across a series of sensitivity analyses. First, we tested our model with an intervention washout period for 2008 and did not find a significant intervention effect (RR, 0.9; 95% CI, 0.8–1.1). Second, we found that clustering patients by hospital in a hierarchical regression model showed similar results (RR, 0.9; 95% CI, 0.8–1.1). Third, we examined the policy effect using 3 separate controls: 60–64-year-old patients not in Medicare (RR, 1.0; 95% CI, 0.8–1.3), 65–69-year-old patients with private insurance (RR, 1.0; 95% CI, 0.8–1.3), and 60–80-year-old patients with Medicare undergoing nontargeted spine, shoulder, and elbow procedures (RR, 0.9; 95% CI, 0.5–1.4). Finally, we tested the results in 3 diverse, all-capture state claims datasets (SID) from 2005 to 2011 (ie, from California, Florida, and New York) (RR, 1.2; 95% CI, 0.9–1.7). We also ran another analysis that included SSIs occurring 30 days postdischarge (RR, 1.1; 95% CI, 0.9–1.3). Overall, all analyses showed the same general results.
DISCUSSION
Our results suggest that the provision of the 2008 CMS never-event policy that prohibited extra costs for treating SSIs following certain orthopedic procedures was not associated with a significant change in SSI rates following policy implementation among the Medicare population compared to similarly aged adults unaffected by the policy. We did identify a significant decrease in SSI rates pre- versus postpolicy in both the Medicare and non-Medicare populations. However, considering already decreasing SSI rates prior to policy implementation, the reduction in SSI rates was likely a continuation of prepolicy trends.
Overall, we could not associate this change with the CMS nonpayment policy with a reduction in SSI rates among Medicare patients compared to our control group. There are several possible reasons for the lack of significance. First, significant decreasing secular trends for orthopedic SSI rates prior to the CMS policy have been reported.Reference Skramm, Saltyte Benth and Bukholm 21 SSIs after these select orthopedic procedures are already rare events, so the added effect by this provision may be minimal. Others have suggested that the overall cost implications of this policy would be minor.Reference McNair, Luft and Bindman 22 Given the professional norms of preventing and caring for patients with SSIs and minimal financial disincentives imposed by the policy, the measureable effect of the CMS nonpayment policy for SSI following certain orthopedic procedures might be limited.Reference McNair, Luft and Bindman 22
Additionally, during the study period, other SSI prevention strategies were already in place.Reference Greene 6 The National Surgical Infection Prevention Project developed guidelines for prophylaxis timing and concentrations following orthopedic surgeries.Reference Bratzler and Houck 23 The Joint Commission and Association for Professionals in Infection Control had established guidelines to eliminate orthopedic SSIs that focused on teamwork and facility-wide interventions to reduce the risk of infection.Reference Greene 24 , 25 Furthermore, most US hospitals are compliant with the Surgical Care Improvement Project (SCIP), which has identified processes of care to improve surgical outcomes.Reference Ingraham, Cohen and Bilimoria 26 Given the numerous prevention strategies in place for all populations, the additional effect of CMS policy in Medicare patients might be minimal.
Furthermore, most SSIs occur after discharge but within 30 days after surgery and would not be identified in the index admission.Reference Levi, Dickman and Sonntag 27 , Reference Weigelt, Dryer and Haley 28 Under the CMS nonpayment policy, which targets only index admissions, most of orthopedic SSIs would not be penalized.Reference McNair and Luft 13 However, in our sensitivity analyses, which included SSI that occurred within 30 days postdischarge, results were similar to our main analyses that demonstrated significantly reduced rates for both Medicare patients and the control group following the CMS nonpayment policy, yet the policy itself was not associated with reduced rates of SSI in the targeted population compared to the unaffected control group.
Finally, we considered the possibility that the CMS nonpayment policy might have spillover effects to the non-Medicare population and thus could be associated with reduced rates of SSI in the pre- versus postpolicy period in both the Medicare and non-Medicare control populations. Hospital guidelines and prevention strategies for SSI would not be payer specific and would likely benefit non-Medicare patients as well, even though previous studies on other targeted HACs suggested that younger non-Medicare patients might not necessarily benefit from this policy.Reference Gidwani and Bhattacharya 19 However, this significant change in the SSI rates between the pre- versus postpolicy periods in both Medicare and non-Medicare groups was not robust across our sensitivity analyses; analysis using all-capture SID data did not show significant rate changes in any group. Thus, this difference could be due to potential confounding variables in the sample population. We could not conclude from our findings that the CMS nonpayment policy had a significant impact on both groups and, thus, the lack of a significant difference-in-difference effect. It is more likely that the decrease in SSI rates for both Medicare and non-Medicare populations is due to larger environmental trends driving an overall change in hospital culture related to infections and the concurrent emphasis on patient safety. Nevertheless, because of concerns for spillover effects into non-Medicare populations, we also ran sensitivity analyses with different control groups, including 60–80-year-old patients with Medicare that underwent orthopedic procedures not targeted by Medicare, and we found similar results.
This study had several limitations. First, we used a nonrandomized design that cannot prove that the CMS policy caused any differences in SSI rates between the 2 populations. However, we ran extensive sensitivity analyses with a carefully selected control population adjusting for various patient demographics, which should have reduced the chance that our findings were affected by unobservable confounding factors. While we were limited in our knowledge of how hospitals implement interventions—SSI prevention efforts might have improved for both nontargeted and targeted procedures, for example—we did not see a significant reduction in SSI rates for the group undergoing nontargeted procedures. Second, we used administrative data in our study, which might not have differentiated between changes in coding practice and true SSI incidence. Although there have been concerns about under-reporting,Reference Calderwood, Kleinman and Soumerai 29 chart review conducted by CMS for other HACs found minimal discrepancies between administrative and chart data. 30 Furthermore, ICD-9-CM coding in NIS data has also been estimated to be ~80% accurate.Reference Burns, Rigby and Mamidanna 31 Third, in the final model, we chose to report unweighted results to reduce type 1 error, as others have done.Reference Gidwani and Bhattacharya 19 However, our results were robust in the sensitivity analyses, where we tested our models in all-capture state databases.
Overall, our findings are consistent with previous studies investigating at other targeted HACs, which also showed minimal to no significant changes in HAC rates following the policy implementation. Studies examining other SSIs after cardiac (ie, mediastinitis) and bariatric surgeries found no significant policy impact on SSI rates.Reference Calderwood, Kleinman and Soumerai 29 , Reference Lidor, Moran-Atkin and Stem 32 Nevertheless, some studies have shown significant decreases in the rates of several targeted HACs, suggesting that the impact might be outcome specific and dependent on the availability of proper evidence-based guidelines for prevention.Reference Gidwani and Bhattacharya 19 , Reference Anderson, Hussey, Frogner and Waters 33
In conclusion, the CMS nonpayment policy can play an important role in directing the attention of healthcare providers toward the need to eliminate these serious hospital-acquired complications. However, the limitations of the current policy likely contribute to its minimal effect on reducing SSI rates; the policy does not capture a majority of SSIs that occur postdischarge. As CMS continues to expand on its programs to reduce HACs, 34 it is important to evaluate the policy’s design and effectiveness in achieving intended outcomes for patients.
ACKNOWLEDGMENTS
The Stanford MedScholars program and the National Institute on Aging had no role in the design and conduct of the study; collection, management, analysis, and interpretation of the data; preparation, review, or approval of the manuscript; or decision to submit the manuscript for publication.
Potential conflicts of interest: All authors have no conflicts of interest to disclose.
Financial support: Funding for this study was provided by the funders of Stanford MedScholars program. Dr Bhattacharya was partially funded by the National Institute on Aging (grant no. R37-AG036791).