Following on a previous article, we will start to look at agreement for categorical data, that is, the extent to which two raters provide the same ratings, where the ratings use a scale, or set of options, with a small number of categories (say, 2–5).
Depending on the kind of raters involved, the agreement can be viewed as telling us about reliability or validity: thus if the two raters are clinicians, then we are concerned with reliability; whereas if one is a gold standard diagnostic test and the other is a screening test, then we are examining validity. While noted in the statistical literature, this is not a distinction that is always made in research practice.
Our focus here will be on measuring agreement, that is, calculating a single number that expresses the degree of agreement. It is also possible to model agreement, that is, to provide a description that goes beyond a single number, but this is more complex and rarely used in the psychiatric research literature.
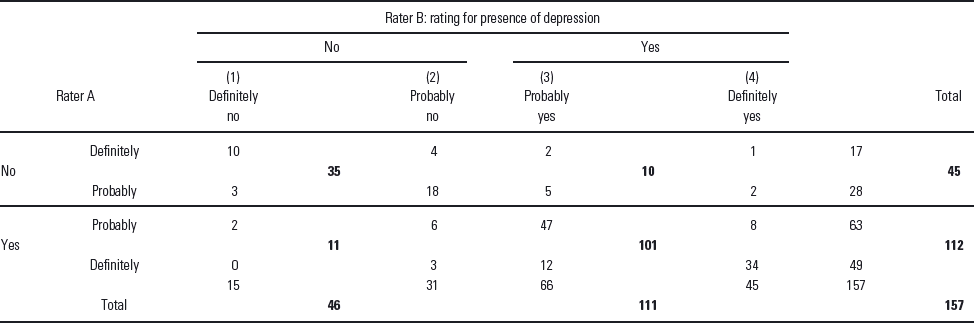
Table 1 shows the results from two raters rating a number of patients for the presence of depression. The raters used four categories ranging from ‘definitely no’ through to ‘definitely yes' (or 1–4). The table also shows the results from collapsing the two ‘no’ categories and the two ‘yes’ categories so that the original 4 × 4 table is reduced to a 2 × 2 table. While the original ratings could simply have been ‘no’ versus ‘yes’, it is not uncommon for categories to be collapsed: often this is done because the sample size is not adequate for a 4 × 4 table and sometimes to examine specifically the agreement for ‘no’ versus ‘yes’, although in neither case should we assume that raters using four categories is simply a more detailed exercise than their using two categories. When the categories are ordered (in this case, by definiteness), the ratings are called ordinal and many ratings are indeed ordinal (e.g. symptom severity).
Example of ratings from two raters
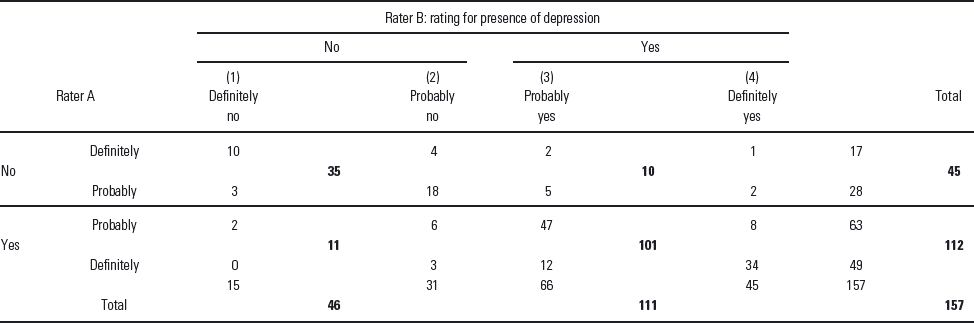
The same data are used for the example based on assigning a diagnosis (anxiety, depression, etc.). Figures in bold represent the collapsed 2 × 2 table.
If the task, however, had been different, with the patients rated for their primary disorder (namely, one of anxiety, depression, bipolar disorder or schizophrenia), then the categories would not have had an order and the ratings would be called nominal. The 2 × 2 table in this case would represent something like neurosis versus psychosis—although of course in a 2 × 2 table there is no difference between ordinal and nominal.
Because nominal and ordinal ratings are quite different they potentially require different assessments of the agreement, but this too is a distinction often not made. Somewhat simplistically, agreement for nominal data involves adding up the areas of agreement, whereas for ordinal data it involves measures that are quite similar to correlations.
The simplest measure is percent agreement which is the percentage of ratings for which the two raters agree [in Table 1 this is (10 + 18 + 47 + 34)/157 = 69.4%]. While informative, there are two problems with this measure. Firstly, it is affected by chance: imagine two raters randomly saying ‘no’ half the time and ‘yes’ half the time; these two raters would agree on 50% of occasions, but we would not regard that as real agreement. Secondly, percent agreement ignores the fact that there are degrees of disagreement, with some more worrying than others: two raters saying ‘absent’ and ‘mild’ respectively are in greater agreement (or lesser disagreement) than two raters saying ‘absent’ and ‘severe’.
A solution to the first problem is to use a chance-corrected measure of agreement, one which measures how much better than chance our raters have done. The most commonly used statistic of this kind is Cohen's kappa (κ) and the descriptive formula for κ given below shows how observed and possible agreement are reduced by chance (expected) agreement before calculating the ratio of ‘observed’ to ‘possible’ agreement:
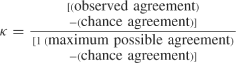
The values of κ range from − 1 to 1: the more raters agree the closer κ is to 1; if they only agree by chance then κ is around 0. The more raters disagree (i.e. say the opposite) κ will tend to move towards − 1, but the extent to which this happens is unfortunately affected by the proportions of ratings in each category: under complete disagreement κ can only equal − 1 if the proportions are equal. This sensitivity of κ (both positive and negative) to these proportions has been a frequent criticism of the statistic, and because in a 2 × 2 table the proportions often reflect the prevalence of a disorder, it is sometimes called the base rate problem.
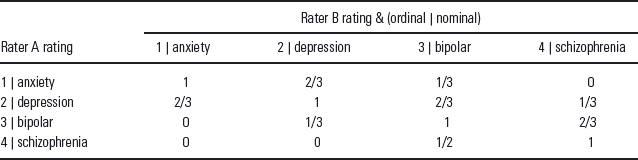
A solution for degree of disagreement is to weight the various possible outcomes of a pair of ratings. Consider ratings on a 1–4 scale: those that agree are given a weight of 1; those at opposite ends (‘1’ and ‘4’) are given a weight of 0; those one step apart receive a weight of 2/3; and those ratings two steps apart receive a weight of 1/3. Weights such as these make sense when the ratings are ordered severity scales. They have the added advantage of making κ– which was developed for nominal ratings – more appropriate for ordinal data; analyses of ordinal rating scale agreement should favour weighted κ over unweighted as the standard approach.
If the ratings are diagnoses we might consider other weights. For example, in a context where most patients have a first onset of a disorder, so that some differential diagnoses are very unclear, we might decide that disagreement between depression and anxiety is relatively minor and give it a weight of 2/3; give disagreement between depression and bipolar a weight of 1/3; that between schizophrenia and bipolar a weight of 1/2; whereas a weight of 0 for other disagreements. We have set out the two weighting schemes in Table 2.
Weights used in calculating weighted κ statistic
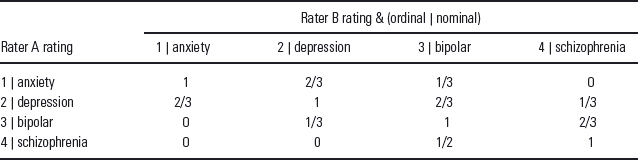
Weights above the diagonal are for the 1–4 ordinal (severity) scale; those below are for the nominal diagnosis rating. Both types weight agreement as 1 (diagonal).
Although we can use κ for both the 2 × 2 and 4 × 4 tables, the weighted version makes sense only for tables that are 3 × 3 or greater. There are alternatives to Cohen's κ; indeed for a 2 × 2 table, there are over 20 measures of agreement, association or similarity which might serve our purpose; for larger tables fewer.
2×2 tables. If one of the raters is a gold standard diagnostic test we can use statistics, such as sensitivity and specificity, which are routine in assessing diagnostic test performance. Some other statistics that have been suggested are the odds ratio (OR); a transformation of the OR called Yule's Y, which has been recommended in the psychiatric literature as avoiding κ's base rate problem; the phi coefficient which is a correlation; and the tetrachoric correlation which is appropriate if the two categories are defined by a cut-off on an underlying continuous measure (such as severity). In passing, we should note that a chi-square statistic is not a measure of agreement, and that if it is highly significant it should not be interpreted as ‘high’ agreement or association.
3×3 tables and larger. If the ratings are truly nominal then κ appears to be overwhelmingly used. If the ratings are ordinal then we can also consider the polychoric correlation (a version of the tetrachoric for more than two categories) and the intra-class correlation coefficient.
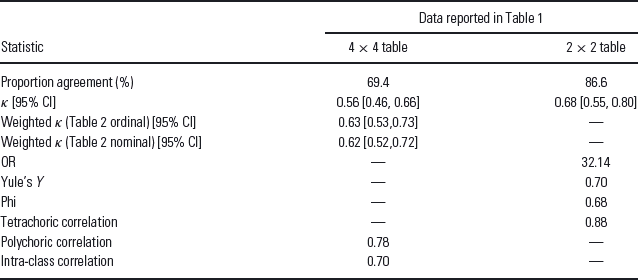
In Table 3, we report the measures of agreement for the data in Table 1. We can see how collapsing into a 2 × 2 table increased agreement (as usually happens), however, that should not be seen as reason for doing so. The statistics tell similar stories and that again is not uncommon; differences tend to emerge in smaller samples and where some of the categories are being used to a quite different extent by the two raters. The weighted κ coefficients are similar, the weights after all are fairly similar, but there is a non-trivial change from the unweighted to weighted κs. For κ, we have provided confidence intervals – even with 157 ratings the confidence interval is not narrow.
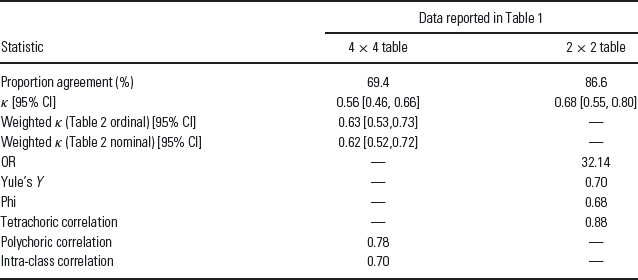
A common question is ‘how good is the agreement?’. While there are some published descriptors for κ (by one convention the values in Table 3 below 0.6 would be described as ‘moderate’, those above as ‘substantial’), it is far more preferable if researchers relate their values to those typically found in their field. As well, the implications of disagreement need to be evaluated – in some contexts even small disagreements might be costly.