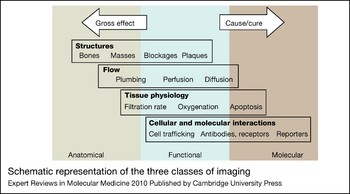


Medical imaging has traditionally been used to diagnose disease using inherent differences in tissue contrast to locate and measure the extent of the pathology. In the past, most medical imaging could be divided into two classes: anatomical and functional. Advances in the molecular understanding of disease have fuelled the emergence of a third class: molecular imaging. A comparison of all three imaging classes is schematically represented in Figure 1.
Schematic representation of the three classes of imaging. Broad categories of applications are shown with a few examples from each category. Many applications, such as structures and flow, span more than one class of imaging. Adapted, with permission, from Ref. Reference Wagenaar, Patt, Pomper and Gelovani88 (© 2008 by Informa Healthcare USA, Inc.).

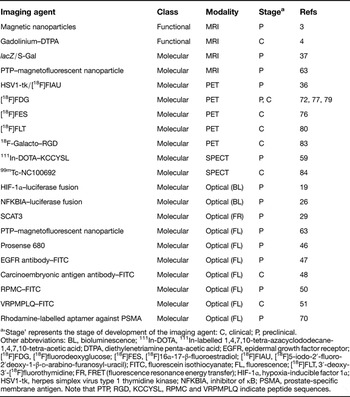
Functional and molecular imaging probes discussed in this review, organised by imaging modality

a‘Stage’ represents the stage of development of the imaging agent: C, clinical; P, preclinical.
Other abbreviations: BL, bioluminescence; 111In-DOTA, 111In-labelled 1,4,7,10-tetra-azacyclododecane-1,4,7,10-tetra-acetic acid; DTPA, diethylenetriamine penta-acetic acid; EGFR, epidermal growth factor receptor; [18F]FDG, [18F]fluorodeoxyglucose; [18F]FES, [18F]16α-17-β-fluoroestradiol; [18F]FIAU, [18F]5-iodo-2′-fluoro-2′deoxy-1-β-d-arabino-furanosyl-uracil); FITC, fluorescein isothiocyanate; FL, fluorescence; [18F]FLT, 3′-deoxy-3′-[18F]fluorothymidine; FR, FRET (fluorescence resonance energy transfer); HIF-1α, hypoxia-inducible factor 1α; HSV1-tk, herpes simplex virus type 1 thymidine kinase; NFKBIA, inhibitor of κB; PSMA, prostate-specific membrane antigen. Note that PTP, RGD, KCCYSL, RPMC and VRPMPLQ indicate peptide sequences.
Classes of imaging used in oncology
Anatomical imaging
In oncology, anatomical images are used to locate, demarcate and quantify the size of the tumour – important information in planning or monitoring treatment as it progresses and guiding necessary adjustments to the therapy. During the past three decades, sophisticated technologies such as ultrasound (US), computed tomography (CT), and magnetic resonance imaging (MRI) have entered clinical practice, providing increasing anatomical definition of the disease. However, these approaches provide only limited insight into the pathophysiology of the tumour since the anatomical images contain no molecular information. Moreover, if the tumour and the tissue surrounding it share similar physical properties (e.g. the same density), the tumour may be hard to image with CT and in some cases MRI (Ref. Reference Evans1).
Functional imaging
Functional imaging provides measurements of physiological processes such as alterations in blood flow or oxygenation that underlie disease at the tissue or cellular levels. Many cancer therapies involve antiangiogenic strategies leading to loss of blood vessels, which can be detected via functional imaging and precede tumour volume decreases by days (Ref. Reference Baka, Clamp and Jayson2). In a preclinical experimental model, injection of a high molecular weight MRI-compatible nanoparticle that remains in the vessels enables MRI-based detection of vascular impairment – resulting from genetic inactivation of an HRas1 transgene – a few days before a decrease in tumour volume is observed (Ref. Reference Tang3). It follows that quantification of vessel volume by functional imaging in a clinical setting might provide an earlier indicator of therapeutic efficacy compared with anatomical imaging alone. Functional imaging has also recently been utilised to determine a blood vessel normalisation window – a time frame when oedema is decreased and blood vessels take on a more ‘normal’ appearance (Ref. Reference Batchelor4). Drug delivery has been shown to increase when chemotherapeutics are given in this window (Ref. Reference Tong5).
Overview of molecular imaging
Improved understanding of disease mechanisms through genomics, proteomics and animal models along with advances in chemistry and molecular biology have fuelled the development of a third class of imaging. This class, molecular imaging, has been formally defined as ‘the visualization, characterization and measurement of biological processes at the molecular and cellular levels in humans and other living systems’ (Ref. Reference Mankoff6). Whereas anatomical, and in some cases functional, imaging provides information on gross effects, molecular imaging reports what is happening at the cellular and molecular level, including information on receptor number, signal transduction aberrations and enzymatic activities. Coupled with the improved knowledge of cancer biology and genetics, and the growing number of targeted drugs entering clinical trials, it is clear that molecular imaging will continue to provide increasingly sensitive approaches for early cancer detection and staging, prediction of therapeutic response, and monitoring of therapeutic efficacy. Moreover, these approaches can enable unprecedented insights into the molecular pathogenesis of evolving cancers in the laboratory setting. Commonly used laboratory techniques rely on lysis or other means of destructive sampling of cells or tissues at defined time points (Ref. Reference Naik, Moss, Piwnica-Worms, Pomper and Gelovani7). This gives a static glimpse of the cell or tissue at that time point, but often a more dynamic and prolonged monitoring is desired. Investigations using animal models of disease, in particular, benefit from more temporal and dynamic observation tools such as those afforded by noninvasive molecular imaging approaches (Ref. Reference Naik, Moss, Piwnica-Worms, Pomper and Gelovani7).
Multimodal imaging
Recently, multimodal imaging has emerged, combining multiple classes of imaging. Fusing the molecular information from a tumour with anatomical or functional information provides an accurate understanding of the tumour while also providing greater sensitivity and specificity. Positron emission tomography (PET)–MRI (Ref. Reference Donati8), PET–CT (Ref. Reference Antoch9), single-photon emission computed tomography (SPECT)–CT (Ref. Reference Barwick10) and MRI–optical (fluorescence) (Refs Reference Mishra11, Reference Huber12) are all examples of this type of imaging. One retrospective study found that PET–CT imaging was significantly more accurate for staging patients' tumours using the tumour–node–metastasis system: tumour staging with PET–CT showed an accuracy of 84% compared with 76%, 63% and 64% in ‘side-by-side PET + CT’, CT alone and PET alone, respectively (Ref. Reference Antoch9).
Development of molecular imaging probes
The field of molecular imaging relies on the availability of (1) relevant biomarkers and the ability to produce targeted contrast agents that are specific and selective for those biomarkers (Ref. Reference Kelly, Reynolds, Kristof, Pomper and Gelovani13) and (2) improvements in detection technologies. Detailed analyses of cancer mechanisms have identified a wealth of potential cancer markers, including altered proteins and metabolites, that are diagnostic for many aspects of the disease state (e.g. the presence of a given cancer type, the pathological subtype and grade, and the presence of specific oncogenic alterations). The two major types of probes to these biomarkers are exogenous probes (e.g. small molecules, antibodies) and genetically encoded probes (Table 1).
Exogenous probes
One of the earliest molecular imaging methods was provided by the creation of [18F]fluorodeoxyglucose (FDG), thus enabling PET-based monitoring of glucose uptake as a measure of the tumour's metabolic activity. Increased glucose metabolism in cancer cells was first observed by Otto Warburg in the 1950s (Ref. Reference Warburg14) and is now referred to as the ‘Warburg effect’. However, any cells that have high glucose metabolism are labelled by FDG, including cardiac myocytes (Ref. Reference Taegtmeyer and Dilsizian15) and inflammatory cells (Ref. Reference Matsui16); therefore, in the background of inflammation, such as colitis (Ref. Reference Rubin17) for colon cancer or pancreatitis (Ref. Reference Takuma, Kamisawa and Itoi18) for pancreatic cancer, FDG-mediated PET imaging will not be specific.
In addition to the use of labelled metabolites, biomarkers can be targeted with various molecules such as antibodies, proteins, peptides, aptamers or small molecules, which are conjugated to imaging agents suitable for detection with imaging modalities (optical, US, MRI, PET, SPECT and CT approaches). Alternative approaches include various types of probes that can be activated by specific enzymes and therefore gauge their catalytic activity. The application of these probes is discussed in detail below.
Genetic probes
Advances in transgenic technology and bioluminescence or chemiluminescence reporters have fuelled the development of powerful genetic tools for imaging in the laboratory setting. Genetically encoded reporters allow spatial and temporal visualisation of molecular events in vivo via transgenes whose level of expression at the transcript level correlates with specific molecular changes, or that encode modified proteins whose expression level or biochemical activity tracks with such changes.
Luciferase reporters
Genetic reporters encoding chemiluminescence proteins related to the firefly luciferase enzyme have found great utility for in vivo imaging. The activity of such reporters can be readily detected using a CCD (charge-coupled device) camera following injection of the appropriate chemiluminescent substrate. This type of approach has been used to generate mouse models that enable monitoring of tumour microenvironments. For example, regional hypoxia has been studied using a transgene that drives the expression of a chimeric protein consisting of the oxygen-dependent degradation domain (ODD) of the hypoxia-inducible factor (HIF-1α) fused to firefly luciferase (Ref. Reference Safran19). HIF-1α is constitutively expressed, but is degraded by the ubiquitin–proteasome degradation pathway under normoxic conditions because of the presence of the ODD. Under hypoxic conditions, HIF-1α becomes stabilised. Therefore, ODD–luciferase reporters, whose stability is also regulated by tissue oxygen levels, serve as a gauge of both the degree of hypoxia and the relative stability of HIF-1α in vivo (Ref. Reference Safran19).
A different type of genetic reporter system has been used to monitor the activity of the NF-κB (nuclear factor kappa-light-chain-enhancer of activated B cells) pathway in vivo. Defects in this pathway have been implicated in a myriad of diseases including cancer (Refs Reference Karin20, Reference Li and Verma21, Reference Aggarwal22). In resting cells, the heterodimeric NF-κB transcription factor is sequestered in the cytoplasm through dimerisation with inhibitor of κB (NFKBI) family proteins (Refs Reference Karin20, Reference Li and Verma21, Reference Ghosh and Karin23, Reference Karin and Ben-Neriah24, Reference Hayden and Ghosh25). Inhibitor of κB kinase (IKBK) activates the transcriptional function of NF-κB by phosphorylating specific serine residues on NFKBI, resulting in its degradation (Ref. Reference Karin and Ben-Neriah24). An NFKBI-α (NFKBIA)–luciferase fusion reporter has been engineered to study IKBK activity (Ref. Reference Gross and Piwnica-Worms26). Alterations in the bioluminescence signal can be correlated with IKBK activity and thus this presents a method to monitor the activity of IKBK in vivo in relation to pathophysiological stimuli or to drugs that are designed to manipulate this pathway.
FRET signal reporters
Fluorescence resonance energy transfer (FRET) signal reporters, designed to lose signal intensity upon proteolytic cleavage, have been used to track protease activity in vivo. Recently, fluorescent proteins were shown to be suitable for FRET and to be useful in a wide range of applications, including the study of protein binding interactions and conformational changes, assessment of GTPase, protease and kinase activity, and monitoring of metabolism (Refs Reference Shaner, Steinbach and Tsien27, Reference Li, Pham and Truong28). FRET-based approaches have been used to track in vivo caspase 3 (CASP3) activity, an important measure of apoptosis that can be utilised to determine extent of therapeutic response. Tumour cells have been engineered to express SCAT3, which is composed of cyan fluorescent protein (CFP) and yellow fluorescent protein (YFP) linked through a DEVD caspase 3 cleavage site (Ref. Reference Takemoto29). Caspase 3 activation leads to cleavage at the DEVD site, resulting in separation of the fluorescent proteins and a decreasing FRET signal (Ref. Reference Takemoto29). Therefore, activation of caspase 3 can be correlated directly with a decrease in FRET signal, as shown in a recent study (Ref. Reference Zhou30): following subcutaneous injection of lung cancer cells expressing SCAT3 into mice, monitoring of the FRET signal allowed assessment of caspase 3 activity after photodynamic therapy (PDT) or treatment with a chemotherapeutic.
Detection of genetic reporters with PET and MRI
PET reporter transgene systems have been used both in vitro and in vivo (Ref. Reference Blasberg and Gelovani-Tjuvajev31). One of the most common reporter genes is herpes simplex virus type 1 thymidine kinase (HSV1-tk) (Ref. Reference Tjuvajev32). The encoded enzyme phosphorylates a wider range of substrates than mammalian thymidine kinase (TK1), permitting imaging of thymidine analogue substrates such as 5-iodo-2′-fluoro-2′deoxy-1-β-d-arabino-furanosyl-uracil (FIAU), which are preferentially phosphorylated and accumulated in transduced cells (Ref. Reference Blasberg and Gelovani-Tjuvajev31). HSV1-tk has also been used as a suicide gene in the treatment of cancer. Animal models in which HSV1-tk-transduced tumour cells were treated with ganciclovir (prodrug cleaved by HSV1-tk) have shown success (Refs Reference Culver33, Reference Moolten34). However, clinical results have shown limited gene transfer to tumour cells, ultimately limiting therapeutic efficacy (Ref. Reference Ram35). Therefore, a noninvasive system to monitor the effectiveness of gene transfer may be valuable. An in vivo experiment using [18F]FIAU to image HSV1-tk suicide gene expression in transduced tumours showed uptake of [18F]FIAU in HSV1-tk-transduced HT-29 tumours was much greater than in wild-type HT-29 tumours (Ref. Reference Alauddin36). Molecular–genetic PET imaging provides exquisite sensitivity that can be exploited to detect small changes noninvasively in induced, normal and aberrant gene expression.
Until recently, there was a lack of genetic reporters for molecular MRI, but an MRI-compatible lacZ genetic reporter system has now been described (Ref. Reference Bengtsson37). The lacZ gene encodes β-galactosidase (β-gal), which can be detected by cleavage of the commercially available substrate S-Gal, both in vitro and in vivo: cleaved S-Gal chelates ferric iron (derived from ferric ammonium citrate, FAC) and creates a dark-coloured reaction product (Ref. Reference Heuermann and Cosgrove38). Iron accumulation in lacZ + cells was predicted to be detectable by MRI, and indeed injections of S-Gal and FAC into the muscles of lacZ + animals and lacZ +-tissue-implanted animals allowed visualisation of labelled cells by MRI (Ref. Reference Bengtsson37). This finding, which utilised an already commercially available reagent, provided a new application of the lacZ genetic reporter system, allowing noninvasive MR imaging in vivo.
Clinical applications of molecular imaging
Beyond its use in the laboratory setting, molecular imaging has also made considerable contributions to oncological practice in the clinic. Moreover, evolving understanding of the molecular signatures associated with different aspects of tumour biology or drug responsiveness will ensure that molecular imaging has an increasingly important role in future cancer care.
Early detection, diagnosis and prognosis
The 5-year survival rate is greatly increased when cancer is detected and diagnosed in its earliest stages (when it is confined locally or regionally) (Ref. 39). Extensive progress has been made in early detection of some cancers, including colon, breast and bladder, and, correspondingly, screening programs have been developed with the aim of reducing mortality (Ref. 39). Significantly, these cancers are readily accessible to noninvasive or minimally invasive techniques. Since molecular imaging can provide reliable information about the biology and natural history of the detected lesions, it still has considerable value as a prognostic tool for cancers arising at these physically accessible sites. Molecular imaging can enhance traditional imaging because of its ability to highlight small abnormalities and allow the distinction between normal or inflammatory tissues and cancer tissue based on early molecular changes and not gross anatomical difference. High sensitivity and specificity of molecular biomarkers is a requirement that, when fulfilled, offers the ability to acquire quantitative data from repeat studies (e.g. pre- and post-treatment). Molecular imaging also serves as an important adjunct to traditional imaging; for example, molecular imaging via colonoscopy adds molecular information, which enhances the sensitivity and diagnostic power of the original technique. Molecular imaging has the potential to allow accurate staging, prediction of prognosis, and the stratification of patients into appropriate treatments based on staging and the pathways that are aberrant for each patient.
Endoscopic molecular imaging in colorectal cancer diagnosis
As mentioned above, existing noninvasive and minimally invasive imaging methods are currently available for early detection of colorectal cancer. Endoscopic colonoscopy has been widely used as a first- or second-level examination for specific ages among the general population and high-risk groups with familial aggregation for colorectal cancer (Ref. Reference Wallace and Keisslich40). This examination allows the identification of precancerous lesions, commonly polyps, and their concurrent sampling or resection, and has been shown to reduce incidence of colorectal cancer and improve cancer outcomes. However, improvement is still needed, as routine endoscopy is reported to have miss rates of early adenomas of up to 20% (Ref. Reference Rex41), especially in flat polyps (Ref. Reference Rembacken42) or in polyps that are present in inflammatory environments (i.e. colitis) (Ref. Reference Krok and Lichtenstein43). Therefore, an approach of emerging importance is the implementation of fibre-optic endoscopy with high-affinity optical molecular imaging agents that aid in the identification of difficult-to-detect early malignant adenomas (and to reduce the overtreatment of benign lesions).
One example of such an application has been the development of methods for monitoring cathepsin B (CTSB) activity in vivo. Cathepsin B proteolytic activity is commonly present in the tumour microenvironment and contributes to the regulation of angiogenesis and invasion during cancer progression (Refs Reference Sloane44, Reference Joyce45). A probe that fluoresces in response to cathepsin activity (ProSense 680) has been used to image cathepsin activity in vivo by intravital endoscopic microscopy in a mouse model of intestinal polyposis (Ref. Reference Gounaris46). Notably, cathepsin B is a biomarker of cancer-associated inflammation in tumour-infiltrating myeloid cells, but it can be used as a surrogate marker for demarcation of dysplasia (Ref. Reference Gounaris46). Indeed, the fact that more than three-quarters of the probe signal was localised in CD11b+Gr1+ (Itgam- and Ly6g-expressing) myeloid-derived suppressor cells (MDSCs) and CD11b+F4/80+ (Itgam- and Emr1-expressing) macrophages infiltrating the lesions in the mouse polyposis model also suggested a pathogenic role of MDSCs in polyp development and/or maintenance. Furthermore, treatment of mice with an anti-inflammatory targeting tumour necrosis factor (anti-TNF) was shown to suppress cathepsin activity (Ref. Reference Gounaris46). This cathepsin-sensing system is therefore also a suitable approach to monitoring response to therapy.
Additional approaches have used antibodies and peptides to target imaging agents to emerging colorectal cancer. An example of this is the use of fluorescently labelled anti-epidermal growth factor receptor (EGFR) antibodies for in vivo endomicroscopic molecular imaging. This approach successfully visualised and differentiated human colorectal cancer tumour types based on their EGFR expression in a rodent xenograft model (Ref. Reference Goetz47). Intravenous application of labelled anti-EGFR in this same study resulted in a quick delivery to the tumour without the necessity to clear the tissue from adherent tissue or mucus. However, topical application might prove more practical for clinical use during colonoscopy and might be associated with less immunogenicity and other adverse events.
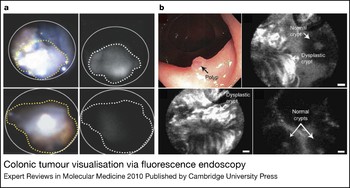
Molecular endoscopy has started to be applied in humans. A pilot colonoscopy trial used labelled monoclonal antibodies against carcinoembryonic antigen (CEACAM) with a prototype fluorescence endoscope for macroscopic tumour detection. Specific fluorescence after topical administration was seen in 19 of 25 carcinomas (Ref. Reference Keller48). Other investigators have sought to identify new markers for colonic dysplasia. Peptide probes against colorectal cancer have been developed using a cell-based phage-display approach (Ref. Reference Kelly and Jones49). Intravenous injection of fluorescein isothiocyanate (FITC)-conjugated peptides into mice harbouring orthotopically implanted colon tumours resulted in enhanced tumour detection upon fluorescence endoscopy (Ref. Reference Kelly50) (Fig. 2a). Further, Hsiung et al. performed screens to isolate a heptapeptide with preferential binding to premalignant lesions in ex vivo human colonic biopsies. The FITC-labelled peptide imaging agent was topically administered through the instrument channel of a standard colonoscope in patients undergoing colonoscopy and enabled effective detection of dysplastic regions by an endoscopic fluorescence confocal imaging system (Fig. 2b). The agent is bound more strongly to dysplastic colonocytes than to adjacent normal cells and allows imaging of dysplastic crypts with a reported 81% sensitivity and 82% specificity (Ref. Reference Hsiung51). The combination of endoscopy with intravital microscopy appears likely to translate into a significant shift in the approach to treatment of many premalignant lesions such as colorectal polyps.
Colonic tumour visualisation via fluorescence endoscopy. (a) Endoscopy of mice with orthotopically implanted colon tumours. A targeting peptide was previously identified through a phage- display screen against HT29 colon carcinoma cells (Ref. Reference Kelly and Jones49). After 1 h, the targeted peptide (RPMC-FITC) fluorescence signal (a, top right) is much higher than control near-infrared signal (a, bottom right). (a, top and bottom left) Light endoscopy images; notice that polyps are not as easily detected via light endoscopy compared with fluorescence endoscopy. The dotted line demarcates colonic lesions from normal colon tissue. Reproduced and adapted with permission from the American Association for Cancer Research: Ref. Reference Kelly50 (© 2004). (b) In vivo confocal fluorescence endoscopy in human patients showing targeted peptide binding (bright signal) to dysplastic colonocytes, but weak binding to adjacent normal mucosa (weak to no signal). Reprinted by permission from Macmillan Publishers Ltd: Nature Medicine (http://www.nature.com/nm/index.html) (Ref. Reference Hsiung51), © 2008. FITC, fluorescein isothiocyanate; RPMC, peptide sequence.

Detection of breast cancer with antibodies and peptides
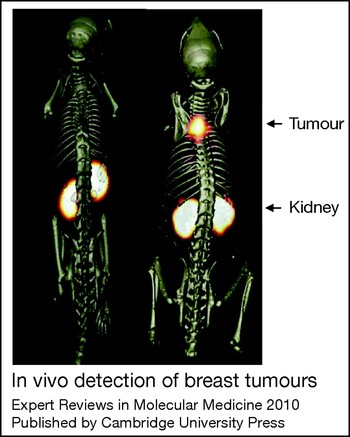
Similarly, molecular imaging probes have also been developed for the early detection of breast cancer. The receptor tyrosine kinase ErbB2 (also known as HER2/neu) is overexpressed in a subset of breast cancers and is a marker of poor clinical prognosis (Ref. Reference Ross and Fletcher52). A variety of molecules and modalities have been used to target the ErbB2 receptor as a therapeutic approach. These include monoclonal antibodies (Ref. Reference Weiner53), vaccines (Ref. Reference Disis54) and gene therapy (Ref. Reference Harris55). Trastuzumab (Herceptin, Genentech), a humanised monoclonal antibody against ErbB2, was the first agent to be widely used in the clinic, and its use is still widespread. However, patients treated with trastuzumab are found to be at a higher risk for cardiac dysfunction (Refs Reference Baselga56, Reference Cobleigh57, Reference Seidman58). Because they are less immunogenic, peptides, such as those developed against colorectal cancer biomarkers, have shown lower toxicity and exhibit desirable pharmacokinetic properties combined with high affinity and selectivity (Ref. Reference Kelly and Jones49). Therefore, a targeted peptide conjugated with a contrast agent of any relevant modality provides a minimally toxic, noninvasive imaging tool for the detection of ErbB2-positive breast cancer. Such a peptide was identified using a phage-display peptide screen directed against the extracellular domain of ErbB2. This peptide was conjugated to 111In-labelled 1,4,7,10-tetraazacyclododecane-1,4,7,10-tetraacetic acid (111In-DOTA) and injected intravenously into mice bearing human breast cancer xenografts. SPECT imaging revealed that the tumour was clearly demarcated by the labelled peptide (Ref. Reference Kumar, Quinn and Deutscher59) (Fig. 3). This strategy could potentially be extended to the clinic for noninvasive assessment of the molecular status of the developing tumour.
In vivo detection of breast tumours. (left) 111In-labelled scrambled peptide against ErbB2-expressing MDA-MB-435 breast tumour; (right) 111In-labelled ErbB2-targeted peptide. SPECT images were fused with conventional microCT images for spatial validation. Note the effective labelling of the tumour with targeted peptide, but absence of accumulation when scrambled peptide is injected. Imaging was performed 2 h after injection of labelled probes. Reproduced and adapted with permission from the American Association for Cancer Research: Ref. Reference Kumar, Quinn and Deutscher59. (© 2007). Abbreviations: CT, computed tomography; ErbB2, v-erb-b2 erythroblastic leukaemia viral oncogene homologue 2 (also known as human epidermal growth factor 2; HER2/neu); SPECT, single-photon emission computed tomography.

Peptide probes for early detection of pancreatic cancer
In comparison with the examples above, several other cancers have been more difficult to detect at an early stage as a result of their propensity to metastasise when relatively small (<10 mm) or their location within the body. Additionally, the vagueness of symptoms associated with some of these cancers results in patients presenting with advanced disease. Examples of these types of cancers include pancreatic ductal adenocarcinoma (PDAC) and ovarian cancer, which elude today's tests.
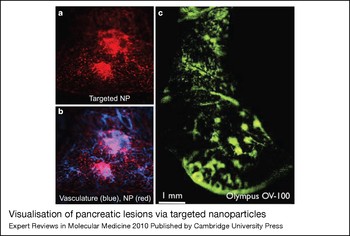
PDAC is among the most lethal types of cancer, with median survival of 6 months and a 5-year survival rate of only 4% (Refs Reference Li60, Reference Jemal61). Currently the only potential cure is surgical resection; however, 80–90% of patients with PDAC present with surgically unresectable disease (Ref. Reference Gillen62). These statistics highlight the need for identification of biomarkers and subsequent development of noninvasive molecular imaging probes for early detection and diagnosis of PDAC. Although the incidence of PDAC is relatively low and therefore population-based screening using imaging would not be cost-effective, subjects with increased risk such as those with hereditary disease or patients with new-onset diabetes would benefit from such agents. Furthermore, clinical benefits would come from monitoring cancer spread before surgery and recurrence after surgery. Recent efforts have been made to develop noninvasive molecular imaging probes capable of detecting early-stage PDAC and identifying extent of metastases. Toward this end, peptides that distinguish between PDAC and normal pancreatic ductal cells in humans and mice were identified through a cell-based phage-display screen against cells isolated from murine models of PDAC (Ref. Reference Kelly63). Further proteomic studies identified the target of one of the isolated peptides, plectin-1 (PLEC), as a potential novel biomarker of PDAC (Ref. Reference Kelly63). The peptide identified by the phage screen was conjugated to magenetic and fluorescent nanoparticles (MFNPs) and injected into genetically engineered mice that develop PDAC that is histopathologically similar to human cancer (Refs Reference Kelly63, Reference Bardeesy64). Molecular imaging through targeting plectin-1 allowed the detection of tumours via both MR and optical methods (Fig. 4). The immunohistochemical data combined with the imaging data suggest that this molecularly targeted imaging agent could identify PDAC at a stage in which it is still susceptible to potentially curative surgery. In addition, this approach has the potential to detect metastasis noninvasively as well as differentiate between benign and malignant lesions. Since only patients with locally invasive disease confined to the pancreas benefit from surgical resection, this approach could aid in clinical decision-making and potentially help avoid the high mortality and morbidity commonly associated with major pancreatic interventions.
Visualisation of pancreatic lesions via targeted nanoparticles. (a) Intravital confocal microscopy of targeted nanoparticles (Cy5.5) to pancreatic lesions. (b) Merge of targeted nanoparticles (Cy5.5, red) and blood-pool agent (AF-750, blue). (c) Intravital low-magnification view of targeted nanoparticle (FITC, green) on a larger section of the pancreas. The development and in vivo visualisation of targeted nanoparticles to pancreatic tumours allows noninvasive diagnoses. Adapted from Ref. Reference Kelly63. Abbreviations: FITC, fluorescein isothiocyanate; NP, nanoparticle(s).

Practical considerations regarding the implementation of cancer screening programs
While the discovery of cancer biomarkers and molecular probes that target them holds considerable promise for improvement in cancer detection, it should be noted that the availability of such tools does not necessarily justify the development of a pan-screening programme. In 1968, the World Health Organization (WHO) commissioned Wilson and Jungner to write a report on screening (Ref. Reference Wilson and Jungner65). The original criteria they set forth remain ‘classic’ (Ref. Reference Andermann66), although the criteria have now changed slightly. Considerations such as the frequency of the cancer type, the amount of knowledge of the cancer, the availability of treatments should a tumour be discovered, and the cost of the test need to be taken into account in order to select the population most likely to benefit from such a test.
Molecular imaging and cancer therapy
The emergence of molecularly targeted therapies and personalised medicine in oncology has the potential to revolutionise patient care. Compounds such as imatinib in chronic myelogenous leukaemia and gastrointestinal stromal tumours, or trastuzumab in breast cancer, are integral parts of established therapeutic protocols, and an increasing number of molecules see their indications expanding on the basis of the results of clinical trials or on earlier phases of development. Despite the wide diffusion of targeted therapies, there has yet to be a commensurate cultural and technological shift able to hold to the promise of personalised medicine based on the biological characteristics of the patient (for example, with regard to drug-metabolising pathways) and the disease in that patient (for example, the main oncogenic pathway activated in a tumour). To date, not only are we unable to predict the response to most available cancer therapies, but also the imaging criteria we use to define response to therapy, namely ‘Response Evaluation Criteria in Solid Tumours’ (RECIST), is not informative with respect to important biological endpoints (Ref. Reference Desar67). RECIST is a set of criteria that defines if a patient responds, stabilises or progresses and it is used to objectively evaluate treatments in the majority of solid-tumour clinical trials today (see http://www.recist.com/). Molecular imaging is a natural counterpart of targeted therapies in that it has the potential to help clinicians match specific therapies to patient populations most likely to respond, to more accurately track individual response, and to allow monitoring of therapeutic resistance (Ref. Reference Jackson68).
Assessment of drug distribution
An important consideration in the case of therapeutic approaches to most cancer types is that the majority of patients have tumours that are refractory to current therapies or develop resistance over the course of treatment. This may relate to the intrinsic molecular features of the tumour. Alternatively, although usually ignored, another cause might be poor perfusion and consequently reduced drug distribution (Ref. Reference Minchinton and Tannock69). So, which is it? Molecular imaging can answer this question, as a wide variety of targeted molecules can be modified to include imaging and/or therapeutic agents. Aptamers are short DNA or RNA oligonucleotides that bind specific targets and can be used in both imaging and therapeutic applications. An example of this involves the use of two aptamers that bind the extracellular portion of prostate-specific membrane antigen (FOLH1) – a prostate cancer marker – which were identified through high-throughput screening techniques. These aptamers, short 40mer synthetic oligonucleotides that bind with low-nanomolar affinity, could be used to carry a drug [e.g. N-acetylated α-linked acidic dipeptidase (NAALADA) inhibitor] or modified to carry both imaging and therapeutic agents (Ref. Reference Lupold70). Although this approach has yet to be widely adopted it may be of particular value in the study of tumours types in which there is speculated to be a stromal barrier to drug delivery.
Overview of use of molecular imaging in prediction of response to therapy and monitoring therapeutic efficacy
Independent of perfusion and drug distribution, many tumours are initially resistant or later acquire resistance to therapies. The question of identifying which patients will respond to particular drugs is an important one as nonresponders in a drug study decrease the apparent effectiveness of the drug and could potentially stall or halt the trial of a drug. In turn, more patients will need to be enrolled to achieve statistical significance, driving up the costs of the trial. Additionally, a nonresponder who receives therapy might unnecessarily suffer from drug side effects while also not receiving the appropriate treatment regimen. Therefore, it is important to identify patients who will respond favourably to treatment (Ref. Reference Jackson68).
Another critical element in the implementation of targeted therapeutics is the development of pharmacodynamic markers of drug effects (i.e. biomarkers that document that the drug is able to hit its specific target) (Ref. Reference Sarker and Workman71). Such markers are essential in the validation of appropriate targets by enabling correlation between effective modulation of the molecular target and whether the desired biological effect is being obtained. In addition, during preclinical and clinical drug development, measurement of biomarkers via noninvasive molecular imaging is important to aid in the selection of the appropriate patients, to provide demonstration of proof of concept for target modulation, to help the interpretation of clinical trial data, and to inform the identification of the optimal dose and schedule. Most current approaches to assess the pharmacodynamic effects of a drug rely on measuring target inhibition by analysis of tumour biopsies. However, this approach suffers from a number of drawbacks including invasiveness, sampling error, and lack of broad applicability because many patients will not be suitable for biopsy. In some cases, measurement of target inhibition by sampling of normal tissues (e.g. in the blood) may have utility, but this approach requires demonstration that target level in the surrogate tissue correlates with that in the tumour and suffers from the same disadvantages of tumour biopsies. Recently, molecular imaging of glucose metabolism via FDG-PET has been used as an assay for mechanistic target of rapamycin (MTOR) inhibition, providing a proof of concept for the use of noninvasive approaches to measure target inhibition (Ref. Reference Thomas72).
Because molecular imaging allows monitoring of molecular processes, it lends itself to responsiveness prediction and pharmocodynamic monitoring of therapeutic efficacy. Identifying biomarkers and designing molecular imaging probes that can be used to predict whether a patient is likely to be a responder or develop resistance could greatly drive down drug development time and cost, while prolonging patient life as patients that will not respond or develop resistance will be switched to a more effective course of treatment.
Development of probes predictive of therapeutic response
Using phage display, systematic evolution of ligands by exponential enrichment (SELEX), or other high-throughput screening techniques, fundamental molecular differences between responders and nonresponders can be ascertained. The molecular differences between responders and nonresponders can direct the creation of molecular imaging probes to quickly and noninvasively determine if the patient is likely to respond. A rapid in vitro screen might involve collecting cells from patients in the responder and nonresponder groups, then screening for molecular differences between the two populations of cells. The molecular differences can be used to develop an imaging probe, appropriately validated in vivo, thus allowing prediction of the therapeutic outcome before initiation of therapy. In a similar situation, treating cells with a drug of interest, then screening for molecular differences between the treated and vehicle-treated cells could provide useful information for the design of an imaging probe to monitor therapeutic progress. After initiation of therapy, a molecular imaging probe could be used to determine if the cells have changed their molecular phenotype to one that is indicative of drug response. Alternatively, transgenic mouse models of human cancers can be used for in vivo screening, or mouse models where human biopsy specimens are orthotopically implanted can be used.
Prescreening patients to predict therapeutic outcome has shown some success. One study divided osteosarcoma patients into two groups: those with ≥90% necrosis (good responders) and those that exhibit <90% necrosis (poor responders) after preoperative chemotherapy. Despite efforts to modify postoperative chemotherapy, the poor responders still suffered from a poor prognosis (Ref. Reference Man73). Therefore, therapy for poor responders is essentially not helpful, despite the cost and use of clinical resources. A noninvasive screen to determine which group (good responder or poor responder) the patient should be placed in is needed at the time of diagnosis so that the most effective treatment regimen can be established. In the same study, analysis of 34 paediatric osteosarcoma samples revealed 45 genes that are predictors of responsiveness to therapy (Ref. Reference Man73). In another study, researchers collected tumour interstitial fluid (TIF) and normal interstitial fluid (NIF) of breast cancer and compared the proteins through two-dimensional electrophoresis and mass spectrometry. Analysis revealed significant differences in protein expression between TIF and NIF. Protein expression differences were also found in interstitial fluid between responders and nonresponders to chemotherapy (Ref. Reference Cortesi74). Using this information, imaging probes can be designed and a noninvasive early-detection and responsive-predictor test can be created.
In breast cancer, several molecular features predict drug responsiveness. Specifically, the status of oestrogen (estrogen) receptor (ER/ESR) and progesterone receptor (PR/PGR) expression or the overexpression/amplification of the receptor tyrosine kinase ErbB2 are useful predictors of the response to endocrine and anti-ErbB2 (e.g. trastuzumab and lapatinib) therapies, respectively. Therefore, knowing the status of these biomarkers is the milestone for any therapeutic planning including neoadjuvant therapies. Furthermore, it has been shown that the status of ER and PR expression changes between primary and recurrent tumours (Ref. Reference Kuukasjarvi75), but this cannot be easily taken into account in most cases, as it requires additional invasive procedures. Noninvasively measuring ER expression with [18F]16α-17-β-fluoroestradiol (FES)-PET has shown promise (Ref. Reference Sundararajan76). In another application of this work, ErbB2 status could be noninvasively obtained with the 111In-DOTA peptide discussed previously in this review (Ref. Reference Kumar, Quinn and Deutscher59). Continuously monitoring the ER, PR and/or ErbB2 status of the patient might provide insightful correlations in clinical trials and help to refine indications for breast cancer therapies.
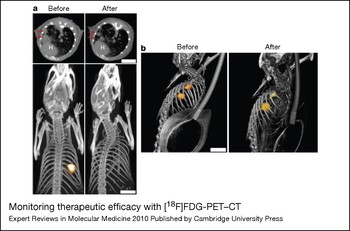
Preclinical animal screening for drug therapies can be used to predict patient responsiveness in the clinic. In a novel phosphoinositide 3-kinase (PIK3) mutant mouse model of lung cancer, tumour treatment with a dual pan-PIK3 and MTOR inhibitor (NVP-BEZ235) (already in clinical development) led to a marked decrease in tumour avidity detected by FDG-PET (Fig. 5a), MRI and microscopy techniques (Ref. Reference Engelman77). Furthermore, mouse cancers initiated by mutation in KRAS did not respond well to treatment with NVP-BEZ235 (Fig. 5b), but combination therapy with a mitogen-activated protein kinase kinase (MEK/MAP2K) inhibitor (ARY-142886) produced marked tumour reduction (Ref. Reference Engelman77). These in vivo experiments suggest that knowing the mutation status of a patient's lung cancer may predict which drug(s) should be used to obtain the most efficacious therapeutic response.
Monitoring therapeutic efficacy with [18F]FDG-PET–CT. (a) CT (top) and PET (bottom) scans of PIK3CA H1047R–CCSP-rtTA double transgenic mice treated with doxycycline until tumours developed (before) then treated with NVP-BEZ235 for 4 days (after). In this animal model, tumours develop from expression of mutant PIK3CA (H1047R) in type II endothelial cells. Expression of mutant PI3KCA is turned on by ingestion of doxcycline. Red arrows indicate the tumour, and the heart is indicated by ‘H’. A marked reduction in tumour size is seen after just 4 days of NVP-BEZ235 treatment. (b) Tet-op-Kras mice developed tumours (before). The tet-op-Kras model is similar to the model described in part (a). Tumours develop due to mutant KRAS (G12D) expression induced by ingestion of doxycycline. Treatment with NVP-BEZ235 for 2 weeks produced no substantial shrinkage (after). Therapeutic response to NVP-BEZ235, measured by [18F]FDG-PET–CT, differs in the two induced tumors (PI3KCA- and KRAS-induced), providing an example of how PET–CT imaging might be used in a personalised treatment regimen. Reprinted by permission from Macmillan Publishers Ltd: Nature Medicine (http://www.nature.com/nm/index.html) (Ref. Reference Engelman77), © 2008. Abbreviations: CT, computed tomography; [18F]FDG, [18F]fluorodeoxyglucose; KRAS, v-Ki-ras2 Kirsten rat sarcoma viral oncogene homologue; PET, positron emission tomography; PIK3CA, phosphoinositide 3-kinase, catalytic, α polypeptide.

Pharmacodynamic markers
Without molecular imaging, tumour treatment efficacy can only be assessed by anatomical or structural measurements; in fact, the evaluation of treatment still lags behind the advances in molecular imaging and primarily consists of determination of the size of the tumour before and after treatment (Ref. Reference Lee, Pomper and Gelovani78). The inadequacy of size measurements is illustrated by a study of the EGFR inhibitors erlotinib and gefitinib. These inhibitors prolonged median survival of chemotherapy-refractory patients by 50%, yet CT-acquired size measurements showed only a 9% tumour-response rate (Ref. Reference Lee, Pomper and Gelovani78). Responses to targeted therapies might be cytostatic or cause fibrosis, meaning the tumour does not decrease in size. Therefore, in this instance, tumour size measurements are a rather poor indicator of therapeutic outcome and success (Ref. Reference Lee, Pomper and Gelovani78).
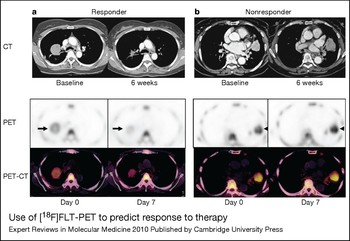
PET allows quantification of FDG uptake in tissues, and previous studies have shown that standardised uptake values (SUVs) are accurate indicators of tumour glucose metabolism. Following therapy, the reduction of glucose metabolism is correlated to therapeutic efficacy. After the first round of chemotherapy, FDG-PET can be used to determine the progress of the chemotherapy, and effectiveness can be assessed before future surgical procedures (Ref. Reference Dose Schwarz79). Quantification of 3′-deoxy-3′-[18F]fluorothymidine (FLT) uptake can also be used to quickly predict response to therapy. In one study, response to gefitinib in lung cancer patients as measured by chest CT (after 6 weeks of therapy) could be predicted with positive and negative predictive values of 92.9% by FLT-PET just 7 days after initiation of treatment (Ref. Reference Sohn80) (Fig. 6). Also noteworthy, the time to progression was significantly increased in the patients who showed response by FLT-PET (median 7.9 months) compared with those patients who did not (median 1.2 months) (Ref. Reference Sohn80). Similarly, molecularly targeted agents to integrin αVb3 (ITGAVB3) and vascular endothelial growth factor (VEGF) have shown promise in predicting therapeutic response. VEGF is the key mediator of angiogenesis and has become one of the most targeted molecules in antiangiogenic and anticancer therapies (Ref. Reference Jain81). Likewise, ITGAVB3 has been identified as a marker of angiogenic tissue (Ref. Reference Brooks, Clark and Cheresh82), and molecular probes for use in PET (Ref. Reference Beer83) and SPECT (Ref. Reference Bach-Gansmo84) have been developed. Using molecular imaging agents targeted to these molecules, tumour angiogenesis and vascular response to antitumour therapies can be assessed noninvasively (Ref. Reference Dayton, Borden, Pomper and Gelovani85).
Use of [18F]FLT-PET to predict response to therapy. In lung cancer patients, FLT uptake is substantially decreased 7 days after initiation of gefitinib treatment in responders compared with nonresponders. (a) By day 7, marked decreases in FLT uptake are seen in responding patients. Subsequent CT image taken 6 weeks after initiation of gefitinib treatment shows tumour size is markedly decreased. (b) Nonresponder shows no visible change in FLT uptake, and CT images taken 6 weeks after treatment initiation confirm nonresponder status. Reproduced and adapted with permission from the American Association for Cancer Research: Ref. Reference Sohn80 (© 2008). Abbreviations: CT, computed tomography; FLT, 3′-deoxy-3′-[18F]fluorothymidine; PET, positron emission tomography.

In order to maintain the most cost- and time-effective therapy, imaging screens for responsive status as well as real-time monitoring of therapeutic progress are required. Because molecular imaging can noninvasively examine the tumour and its microenvironment, it is a natural fit for this type of predictive information. A series of imaging probes could be used to predict the outcome and monitor the progress of chemotherapy. Knowing how the therapy is progressing and whether tumours are acquiring resistance would allow physicians to make more-informed adjustments to the treatment. The limitations of anatomical tumour-response measurements coupled with the widespread use of FDG-PET to assess early treatment response have led to the creation of new criteria, appropriately called ‘PET Response Criteria in Solid Tumours’ (PERCIST). In PERCIST, response to therapy is continuously assessed and expressed as a percentage change between pre- and post-treatment maximum SUL (SUV corrected for lean body mass) (Ref. Reference Wahl86). Establishing endpoints through molecular imaging would allow physicians to know when chemotherapy has successfully run its course and the next procedure should be initiated.
Research in progress
There is a clear need to improve the drug development pipeline. The reality is that the vast majority of new therapeutic approaches fail somewhere in the bench to bedside transition. As a result, considerable amounts of time and resources are expended without any improvement in detection and diagnosis or treatment. In fact, in 2004, the US Food and Drug Administration (FDA) released its ‘Critical Path Report’ explaining that, to reduce the expenditures on candidate products that are unlikely to succeed, new tools are needed to distinguish those that are likely to succeed from those that show very little promise (see http://www.fda.gov/ScienceResearch/SpecialTopics/CriticalPathInitiative/CriticalPathOpportunitiesReports/ucm077262.htm). Molecular imaging can certainly provide the tools that are needed and called for by the FDA; however, there is a paucity of approved molecular imaging agents. In a 2006 report titled ‘Guidance for Industry, Investigators, and Reviewers: Exploratory IND Studies’, the FDA encourages researchers to take advantage of ‘Exploratory IND (eIND) Studies’, which are being underutilised (see http://www.fda.gov/downloads/Drugs/GuidanceComplianceRegulatoryInformation/Guidances/UCM078933.pdf). An eIND Study involves very limited human exposure but allows a quick and more cost-effective mechanism to determine whether lead agents might have clinical relevance. Combined information including pharmacokinetics and toxicity obtained from eIND studies can allow researchers to select the most promising product from a group of candidates.
Additional challenges in the development of molecular imaging agents are discussed in an outstanding review written by John Frangioni (Ref. Reference Frangioni87). Frangioni describes five basic roadblocks that stand in the way of successful imaging-probe development: inadequate preclinical critique and acceptance of small effect sizes, financial and time costs of the regulatory system, intellectual property issues, fear of litigation, and slow and unpredictable industrial timeframes. It is estimated that the cost of development (Phases I–III) of a novel in vivo imaging agent is in the range US$35–61 million (Ref. Reference Frangioni87). As such, industrial investment follows a ‘$100 million market’ rule, meaning a company will not invest unless sales of the novel agent will exceed US$100 million per year. Most diseases do not affect enough people to bring sales above that threshold. By their very nature, molecular imaging and personalised medicine decrease the size of the possible patient set, further ensuring that novel probes and therapies designed with these characteristics in mind will not reach the industry-prescribed threshold. The result is that the majority of new agents are ignored. Frangioni proposes a paradigm shift, one in which academic institutions take a more involved role, utilising the eIND approach to further their novel agents. Academic institutions can accomplish most eIND studies using smaller amounts of money – US$20 000–100 000 (Ref. Reference Frangioni87). This amount of money can be obtained from institutional funds, US National Institutes of Health (NIH) grants, or philanthropic/interest groups. Not only can molecular imaging probes aid in the eIND process, but their development will increasingly depend on eIND studies, further cementing the relationship between molecular imaging probes and eIND studies.
The FDA, National Cancer Institute (NCI), and Centers for Medicare & Medicaid Services (CMS) of the USA have proposed a new initiative called ‘Oncology Biomarker Qualification program’ (OBQI) (see http://www.cancer.gov/newscenter/pressreleases/OBQI). In this program, biomarkers are defined as ‘indicators of disease or therapeutic effects, which can be measured through dynamic imaging tests, as well as tests on blood tissue, and other biologic samples’. Biomarkers are needed to help reduce the time and cost of drug trials and to provide a better way to monitor therapy. A more effective assessment of clinical trials is needed and can easily be accomplished with molecular imaging of biomarkers. Biomarker assessment of progression and outcome is desired due to the wealth of information that is provided. Current methods to assess the response to treatment rely primarily on structural and anatomical methods like RECIST, and so expansion of biomarkers is greatly needed. The search for novel biomarkers is on and many researchers from all corners of the world are discovering biomarkers at a rapid pace. In an effort to reduce time wasted on redundant findings, the NIH has developed a database called the Molecular Imaging and Contrast Agent Database (MICAD; http://micad.nih.gov). MICAD is a freely accessible database that catalogues key research information on in vivo molecular imaging and contrast agents that was created as a key component of the ‘Molecular Libraries and Imaging’ program of the NIH's ‘Roadmap for Medical Research’. The MICAD database includes information on agents developed for PET, SPECT, MRI, US, CT, optical imaging, planar radiography, and planar gamma imaging. Information is in the form of text, references, links to MEDLINE and other resources.
Conclusions
As more information about diseases and their genetic, biochemical and cellular aberrations becomes available, tools such as molecular imaging are needed to diagnose and monitor treatment. Although highly sought after as a means to detect and diagnose disease, molecular imaging finds important roles in basic science as well. The study of protein–protein interactions, gene regulation, and metabolism are areas of research that have benefited from advances in molecular imaging. Key areas of future development include the need for improved methodologies to serially monitor changes in the activity state of intracellular signal transduction pathways as well as metabolic function. Applications in the cancer clinic include early detection and diagnosis, prediction of response to therapy, and monitoring therapeutic efficacy once treatment has commenced. Using molecular imaging, two potential causes of unresponsiveness to treatment can be studied with the goal of eliminating resistance (inherent and physical) and providing the best treatment possible. Molecular imaging is an emerging field with important implications to the clinic. Institutions such as the NIH, NCI, CMS and FDA realise the importance of biomarkers and developing molecular imaging technologies. As such, infrastructure and databases are already being put in place to handle the rapid expansion of biomarkers and molecular imaging technologies.
Acknowledgements and funding
K.K. is funded by Johnson & Johnson Corporate Office of Science and Technology, and Wallace H. Coulter Foundation; K.K., M.S. and N.B. are funded by NCI RO1 CA137071; N.B. is supported by R01 CA133557, P01 CA117969 and the Harvard Cancer Center GI SPORE; G.C. is supported by an American-Italian Cancer Foundation Post-Doctoral Research Fellowship and a grant from the Fondazione Umberto Verones. The authors thank the peer reviewers for their consideration and thoughtful suggestions.