





1. Introduction
Flow-induced vibration (FIV) of slender structures is a result of fluid–structure interactions, which can be observed in many engineering fields, such as offshore drilling platforms and suspension bridges. When fluid flow passes these slender structures, they may undergo vortex-induced vibration (VIV) and/or galloping, both of which are commonly known as FIV. Blevins (Reference Blevins1990) defined galloping as a large-amplitude and low-frequency self-excited vibration of non-circular structures at a reduced velocity higher than a threshold. The galloping vibration is initiated when the overall damping of the system is negative because of negative flow-induced damping, given that the structural damping is positive (Blevins Reference Blevins1990; Païdoussis, Price & Delangre Reference Païdoussis, Price and Delangre2010; Qin, Alam & Zhou Reference Qin, Alam and Zhou2017, Reference Qin, Alam and Zhou2019).
Structural mass ratio m*, damping ratio ζ, natural frequency fn, Reynolds number Re, reduced velocity Ur, structure shape and turbulent intensity all play important roles in galloping. Barrero-Gil, Sanz-Andres & Roura (Reference Barrero-Gil, Sanz-Andres and Roura2009) concluded that a square cylinder cannot gallop at Re < 159 with m*ζ = 0.25, 1.25 and 2.5, while Joly, Etienne & Pelletier (Reference Joly, Etienne and Pelletier2012) observed galloping for Re > 140 with m* = 20, ζ = 0. The latter threshold Re value is much lower than the former. When Re was systematically increased with m* = 10, ζ = 0, Sen & Mittal (Reference Sen and Mittal2011) found that the oscillation frequency abruptly decreases at Re > 170 when a square cylinder vibrates in both transverse and streamwise directions, which points to the occurrence of galloping instability. The galloping vibration regime (Re > 170) corresponded to 2S (two single vortices in one oscillation period) and 2P (two paired vortices) vortex shedding modes. The 2S and 2P modes were associated with high-amplitude (Re < 215) and very-high-amplitude (Re ≥ 215) vibrations, respectively. At Re ≥ 220, the transverse vibration amplitude when the cylinder was only allowed to vibrate in the transverse direction was much smaller than that when it was allowed to vibrate in both transverse and streamwise directions. For the transverse vibration, the 2S mode prevailed. Sen & Mittal (Reference Sen and Mittal2015) investigated the influence of m* on galloping instability for m* = 1, 5, 10 and 20, ζ = 0 and Re = 50–250. Galloping was only found for high m* = 5, 10 and 20 with the onset of galloping at Re = 186, 174 and 169, respectively. With increasing m*, the critical Re (or critical reduced velocity Urc) marking the onset of lock-in and galloping increases and decreases, respectively. They varied Ur by increasing the free-stream flow velocity (i.e. Re), where the Strouhal number and forces of a fixed cylinder are very sensitive to Re. Given that they increased Ur by varying Re, their m* effect is contaminated by the Re effect, as is shown later. They identified three vortex-shedding modes: 2S, C(2S) and 2P + 2S. Modes 2S and C(2S) are involved in VIV, whereas the galloping vibration features 2S mode for A* (= A/D) < 0.7 and 2P + 2S mode for A* > 0.7, where A is the vibration amplitude and D is the cylinder width.
For a square cylinder with m* = 10, Bhatt & Alam (Reference Bhatt and Alam2018) reported the occurrence of galloping at Re = 200 but not at Re = 100. In the case of galloping vibrations, they observed N(2S) vortex shedding mode, where the wake is akin to the wake of a 2S mode. Zhao (Reference Zhao2015) examined the FIVs of a square cylinder and a rectangular cylinder at m* = 10, Re = 200, and found that Urc for galloping increases with increasing cylinder cross-sectional aspect ratio α, with Urc = 13 for the square cylinder. Zhao et al. (Reference Zhao, Leontini, Jacono and Sheridan2019) experimentally investigated the effect of m* on the vibration response of a square cylinder at ζ = (1.31–2.58) × 10−3. When m* was increased, the combined VIV–galloping response weakened and ceased to exist for m* ≥ 11.31. Sourav & Sen (Reference Sourav and Sen2019) for Re ≤ 250 identified the threshold m* = 3.4 above which VIV and galloping were separated. Han & Langre (Reference Han and Langre2022) at low Reynolds numbers pointed out that galloping may occur even for a very low mass ratio, and there is no critical mass ratio for galloping of a square cylinder. The galloping onset is delayed at a low mass ratio.
The effects of m*, ζ and m*ζ on the response of a freely vibrating circular cylinder were numerically investigated by Bahmani & Akbari (Reference Bahmani and Akbari2010) for Re = 80–160. When m* or ζ was increased, both A* and Ur ranges of VIV shrank. They further noted that the oscillator system behaves nonlinearly with m* and ζ. Rabiee & Farahani (Reference Rabiee and Farahani2020) numerically investigated FIV of a heated square cylinder with ζ = 0, 0.01, 0.05, 0.1, 0.25 and 0.5 at Re = 80, 90, 220 and 250. They also observed an inverse relationship between A* and ζ. At Re = 220 involving galloping vibrations, as ζ increases from 0 to 0.1 and 0.25, A* reduces by 36 % and 91 %, respectively.
As Re, Ur, m ∗ and ζ all play key roles in vibration generation, they all must simultaneously exceed their threshold values for the onset of galloping. In general, if any of these parameters falls short of the corresponding threshold value with the remaining parameters being sufficiently high, the cylinder will execute VIV alone, and the transition to galloping will not take place.
Sen & Mittal (Reference Sen and Mittal2016) found that the wake mode type is a direct function of the synchronization type; it is a 2S or C(2S) mode for 1:1 synchronization between the oscillation and shedding frequencies, a 2P + 2S mode when the synchronization is very close or equal to 1:3 and a 3(2S) or unstable 2S mode when the synchronization is a little far from 1:3. Zhao et al. (Reference Zhao, Leontini, Jacono and Sheridan2014) experimentally observed an increased A* for 1:3 synchronization, deviating from the trend of the typical galloping response. Yao & Jaiman (Reference Yao and Jaiman2017) found a low-frequency galloping instability and a kink in the amplitude response around 1:3 synchronization for a triangular cylinder. Daniel, Todd & Yahya (Reference Daniel, Todd and Yahya2021) observed amplitude deviations from a typical galloping response at higher synchronizations.
Beating phenomena in instantaneous vibration responses were observed in some studies on VIV of a circular cylinder. Khalak & Williamson (Reference Khalak and Williamson1999) indicated that this beating is associated with the transition between the lower and upper branches, and hence between the 2S and 2P modes. Voorhees et al. (Reference Voorhees, Dong, Atsavapranee, Benaroya and Wei2008) pointed out that the difference in frequencies between the cylinder vibration and the vortex shedding gives rise to the beating. Shen, Chan & Wei (Reference Shen, Chan and Wei2018) reported similar observations. The modulation frequency equals the difference between the two frequencies. In the galloping branch, the vibration of a square cylinder is generally quasi-periodic, but it is periodic only when the vortex-shedding to oscillation frequency ratio fs/fo = 3 (Zhao et al. Reference Zhao, Leontini, Jacono and Sheridan2014; Zhao Reference Zhao2015; Sen & Mittal Reference Sen and Mittal2016). We focus on not only the effect of m* but also ζ and a combined mass-damping parameter on the vibration responses of a square cylinder, and revisit the mechanisms and roles of the 1:3 and 1:5 synchronizations further.
1.1. Objective
The transverse dynamic response of a cylinder can be simplified as a spring–damper–mass system expressed in non-dimensional form as
 \begin{equation}\ddot{Y} + 4{\rm \pi} \left( {\frac{1}{{{U_r}}}} \right)\zeta \dot{Y} + {\left( {\frac{{2{\rm \pi} }}{{{U_r}}}} \right)^2}Y = \frac{{{C_L}}}{{2{m^\ast }}},\end{equation}
where Y,  $\dot{Y}$ and
 $\ddot{Y}$ are respectively the instantaneous displacement, velocity and acceleration of the cylinder in the transverse direction. The non-dimensional parameters are defined and listed in table 1, where c and k are the damping and spring constants of the cylinder system, respectively. Parameter m is the mass of the cylinder per unit length and ρ is the density of the fluid. Terms fo and fs are the cylinder vibration frequency and vortex shedding frequency, respectively. Force FL is the lift force acting on the unit span of the cylinder.
Definitions of non-dimensional parameters.

In (1.1), Ur, ζ and m* are the parameters involved in FIVs while CL is the flow-induced lift force that depends on Ur, ζ, m* and Y. One can estimate CL from (1.1) when Ur, ζ, m* and Y are all known. Undoubtedly, ζ and m* are the structural parameters, the latter indicating the heaviness of the structure. On the other hand, Ur (= U ∞/fnD, as defined in table 1), consists of a structural parameter (i.e. fn) and a flow parameter (i.e. U ∞/D), the former representing the structural rigidity or strength (how many oscillations per second) while the latter indicating the flow strength (how many D the flow can travel per second) or forcing frequency in other words. Thus, Ur represents a competition between the structural rigidity and flow strength. That is, the smaller the Ur, the higher the structural rigidity and/or the smaller the flow strength, and vice versa. If Ur with a constant fnD is varied by changing U ∞ (i.e. Re), it acts as a flow parameter. Conversely, if Ur is varied via fn, keeping U ∞ (i.e. Re) constant, it acts as a structural parameter. When the effect of Ur on A* (i.e. A* versus Ur graph) is investigated with increasing Ur via U ∞, the effect involves the combined influence of Ur and Re. On the other hand, when the same is done via fn, it solely involves the influence of Ur. When Re is kept constant, a better presentation of the Ur effect is provided.
We aim to investigate the effects of m* (= 2–50), ζ (= 0–1), m*ζ (= 0–50) and Ur (= 1–80) on vibration and frequency responses, flow structures, added mass and forces of an elastically mounted square cylinder at Re = 170. This investigation further explores whether m*ζ is an appropriate parameter to characterize FIV. If not, what is the appropriate parameter? To guarantee the occurrence of galloping and avoid the three-dimensional effect, we select Re = 170 based on investigations by Barrero-Gil et al. (Reference Barrero-Gil, Sanz-Andres and Roura2009), Joly et al. (Reference Joly, Etienne and Pelletier2012) and Sen & Mittal (Reference Sen and Mittal2011).
2. Methodology
2.1. Governing equations and numerical set-up
The flow is assumed to be incompressible, viscid and two-dimensional while the physical properties of the fluid are constant. The governing equations to simulate the flow field around an elastically mounted rigid square cylinder are the continuity and Navier–Stokes equations, which can be written in a non-dimensional form as
 \begin{equation}\textrm{continuity:}\quad \boldsymbol{\nabla }{\boldsymbol{u}^\ast } = 0\end{equation}
and
 \begin{equation}\textrm{momentum:}\quad \frac{{\partial {\boldsymbol{u}^\ast }}}{{\partial {t^\ast }}} + {\boldsymbol{u}^\ast }\boldsymbol{\nabla }{\boldsymbol{u}^\ast } =- \boldsymbol{\nabla }{p^\ast } + \frac{1}{{Re}}{\nabla ^2}{\boldsymbol{u}^\ast },\end{equation}
where p* ( $= p/\rho U_\infty ^2$), u* and t* (= tU ∞/D) are the normalized static pressure, normalized velocity and normalized time, respectively. Term u* is composed of two velocity components u* = (u*, v*) = (u/U ∞, v/U ∞) in the streamwise and transverse directions, respectively. Parameter D is the width of the square cylinder. Reynolds number is defined as Re = ρU ∞D/μ, where μ is the viscosity of the fluid, ρ is the fluid density and U ∞ is the free-stream flow velocity. The reduced velocity Ur = U ∞/(fnD), where fn (
 $= 1/2{\rm \pi} \sqrt {k/m} $) is the natural frequency of the cylinder.
Ansys-Fluent 17.2 based on the finite-volume method is utilized as the solver. The second-order upwind scheme and the central differencing scheme are used to discretize the convective and diffusion terms, respectively. A first-order implicit formulation is adopted for time discretization because of its unconditional stability (Manson, Pender & Wallis Reference Manson, Pender and Wallis1996) and compatibility with the dynamic mesh (Shaaban & Mohany Reference Shaaban and Mohany2018). The pressure-correction-based iterative algorithm SIMPLE (semi-implicit method for pressure-linked equations) proposed by Patankar (Reference Patankar1980) is employed for coupling the velocity and pressure fields.
The dynamic response of the cylinder system is given by (1.1). The fourth-order Runge–Kutta method is employed to solve this second-order differential equation at each time step, where the fluid forces acting on the cylinder are composed of pressure and shear stress forces, obtained directly from the ANSYS-Fluent 17.2 solver. The lift force is provided on the right-hand side of (1.1), which is integrated to advance the cylinder motion. In the next time step, the cylinder displacement, velocity and acceleration are updated, and the equation of fluid motion is integrated to complete the fluid–solid coupling. At each time step, the deformation of the computational domain is managed by the dynamic meshing tool in ANSYS-Fluent 17.2, with the mesh updated using the Laplace smoothing and layering methods. In the subsequent time step, the field variables (u, v and p) within the entire computational domain are updated based on each node's information, which involves solving the governing equations: the continuity (2.1) and the Navier–Stokes (2.2) equations.
2.2. Domain size, grid resolution and time-step dependence test
A schematic of the cylinder configuration is shown in figure 1. The computational domain is rectangular, scaled with D as a length of Lu + Ld = 75D in the flow direction and a height of H = 50D in the transverse direction. It gives a blockage ratio D/H = 2.0 %, which is less than the 3.3 % used in Zheng & Alam (Reference Zheng and Alam2017) and Bhatt & Alam (Reference Bhatt and Alam2018). The boundary conditions at the inlet are u* = 1.0, v* = 0. Symmetry conditions (v* = 0, ∂u*/∂y* = 0 and ∂p*/∂y* = 0) are applied to both upper and lower boundaries. The inlet boundary is set as the velocity inlet (u* = 1, v* = 0), while the outlet boundary is given as ∂u*/∂x* = 0, ∂v*/∂x* = 0 and ∂p*/∂x* = 0. No-slip boundary conditions are deployed on the cylinder surface. The initial flow field in the computation domain is given as u* = 1, v* = 0 and p* = 0.
A schematic of the flow configuration and computational domain.

Figure 2(a) shows a global view of grid distributions in the entire computational domain, and figure 2(b) shows a zoom-in view of grid distributions around a quadrant of the square cylinder. The entire flow field is given a structured quadrangular grid system. The oscillating cylinder is surrounded by a central box of size 8D × 8D (figure 2a). The central box of high grid density moves with the vibrating cylinder, while the remaining grids in the domain are stationary. A dynamic mesh scheme is utilized to move the cylinder including the central box and to adjust the mesh accordingly. The motion of the cylinder is defined by the user-defined function. At each time step, smoothing and layering are applied at each new position of the cylinder.
(a) Global view and (b) zoomed-in view of the meshes around the square cylinder.

Grid and time-step independence tests were performed for a vibrating cylinder with m* = 10 and Ur = 7 (table 2). Four grids M1 = 22 292, M2 = 44 799, M3 = 76 622 and M4 = 145 232 were tested, each with time steps Δt = 0.001, 0.002, and 0.005. The values of A*, fr = fo/fn and  ${C^{\prime}_L}$ are presented in table 2, where fo was estimated from the fast Fourier transform (FFT) of the Y signal, A* was obtained from the root-mean-square value of Y as
 ${A^\ast } = {Y_{rms}} \times \sqrt 2 /D$ and
 ${C^{\prime}_L}$ was calculated from the lift signal. The percentage deviation is provided in parentheses with increasing node numbers. When the grid system increases from M1 to M4, the deviations get smaller. The deviations in the results between M3 and M4 for Δt = 0.001, 0.002 and 0.005 are less than 3.52 %, 3.87 % and 4.71 %, respectively. Grid M3 is considered, given that the node number for M4 is approximately twice that for M3 and the deviations in the results between M4 and M3 are small. The deviations in the results for M3 are less than 4.3 % between Δt = 0.002 and 0.001, while it is 13.08 % between Δt = 0.005 and 0.002. Grid M3 and Δt = 0.002 are thus chosen for further successive simulations. There were 240 nodes on each side of the cylinder surface for M3. The first layer of elements had a radial distance of 0.005D from the cylinder surface.
Grid and time-step independence tests for vibrating cylinder at Re = 170, m* = 10 and Ur = 7.

2.3. Validation
In addition to the grid and time-step validation, the model for FIVs was validated for a square cylinder vibration at Re = 200 for Ur = 3–22. This Re = 200 is chosen to compare the results from Zhao (Reference Zhao2015). Figure 3 compares the vibration and frequency responses between the present and Zhao's works for a cylinder with m* = 10, ζ = 0, and Re = 200. The present results of A* and fr concur well with those of Zhao (Reference Zhao2015).
Comparisons of (a) response amplitude A* and (b) frequency ratio fr (= fo/fn) of a square cylinder at mass ratio m* = 10, damping ratio ζ = 0 for Re = 200.

3. Results and discussion
3.1. Effect of m* on vibration response
We present here the effect of m* on vibration and frequency responses at ζ = 0 (figure 4). The cylinder responses can be divided into three branches, namely the initial branch (IB), lower branch (LB) and galloping branch (GB). For m* = 20, the vortex excitation regime (including IB and LB) appears when Ur ≤ 12, whereas GB occurs when Ur > 12. Following Bhatt & Alam (Reference Bhatt and Alam2018), the identifications of IB and LB are made based on the relationship between St and Ur shown in figure 5(a). The Strouhal number St – the dimensionless vortex shedding frequency of the vibrating cylinder – was estimated from the power spectral density functions of the lift signals. Here, St 0 is used to denote the dimensionless shedding frequency of a fixed cylinder (figure 5a). The IB corresponds to St < St 0 while the LB to St > St 0. The boundary between IB and LB is characterized by a jump in St, e.g. between Ur = 5.7 and 5.77 for m* = 20, between Ur = 5.45 and 5.5 for m* = 10 and between Ur = 5.2 and 5.3 for m* = 5 (figure 5a). The value of A* increases with increasing Ur in IB, which is accompanied by a declining St and a constant fs/fo = 1.0 (figures 4a,b and 5a). The fs/fo = 1.0 indicates the lock-in (figure 4b). On the other hand, fr grows with increasing Ur (figure 5b).
Dependence on reduced velocity Ur and mass ratio m* of (a) response amplitude A* and (b) fs/fo. (c) Zoom-in view of A*–Ur plot in (a) for Ur = 1–12. Here, ζ = 0 and Re = 170.

Variations of (a) Strouhal number St, (b) oscillation frequency ratio fr, (c) time-mean drag coefficient  ${\bar{C}_D}$ and (d) fluctuating lift
 ${C^{\prime}_L}$ with reduced velocity Ur for different mass ratio m* values. Here, damping ratio ζ = 0 and Re = 170.

A marked rise in A* also characterizes the boundary between IB and LB (figure 4c). In the LB regime, A* after reaching a peak declines with increasing Ur. The LB is further characterized by fs/fo = 1.0 (lock-in, figure 4b), declining St and increasing fr. These three attributes are similar to those in IB. How do IB and LB differ? Why are there jumps in St and fr between IB and LB? The distinct phase lag ϕ between CL and Y*  $(=Y/D)$ answers these two questions: ϕ = 0° in IB and ϕ = 180° in LB (not shown), given ζ = 0. The jump in ϕ from 0° to 180° occurs at the boundary between IB and LB.
The GB can be identified from the recovery in the increase of A* (figure 4a) and jump in fs/fo (figure 4b) or from the plunge in fr (figure 5b). Therefore, the critical reduced velocity Urc for the onset of galloping is 13, 12 and 12 for m* = 5, 10 and 20, respectively. In GB, A* increases rapidly with Ur. Deviating from this trend, A* surges at 1:3 (i.e. fs/fo = 3) and 1:5 (i.e. fs/fo = 5) synchronizations (figure 4a,b). The surge is stronger at 1:3 synchronization than at 1:5 synchronization. The onset of galloping for m* = 5 coincides with 1:3 synchronization. Sen & Mittal (Reference Sen and Mittal2016), Yao & Jaiman (Reference Yao and Jaiman2017) and Daniel et al. (Reference Daniel, Todd and Yahya2021) all observed 1:3 synchronization. Here, we find that 1:5 synchronization also plays a role in the vibration responses. The vibration response is generally quasi-periodic (amplitude varying with time) but is periodic (constant amplitude) for 1:3 and 1:5 synchronizations. Sen & Mittal (Reference Sen and Mittal2016) reported that the vibration response for m* = 5 was quasi-periodic for the entire GB because they ignored the 1:5 synchronization.
Term fs/fo in GB generally increases linearly with increasing Ur except for the occurrence of synchronizations around fs/fo = 3 or 5 (figure 4b). The linear relationship between fs/fo and Ur can be expressed as
 \begin{gather}{f_s}/{f_o} = 0.1638{U_r} + 0.0939\quad \textrm{for}\;{m^\ast } = 20, \end{gather}
 \begin{gather}{f_s}/{f_o} = 0.1708{U_r} + 0.2432\quad \textrm{for}\;{m^\ast } = 10,\end{gather}
 \begin{gather}{f_s}/{f_o} = 0.1923{U_r} + 0.4505\quad \textrm{for}\;{m^\ast } = 5.\end{gather}
The value of St is more or less independent of Ur in the galloping regime while fr being smaller than 1.0 slightly increases with Ur (figure 5a,b).
Parameter m* plays a crucial role in A*. It is a well-accepted argument that an increase in m* reduces A* (e.g. Bahmani & Akbari Reference Bahmani and Akbari2010). In the vortex excitation regime (including IB and LB), a larger m* leads to a smaller A* and a postponement of the A* peak. On the other hand, in the GB regime, the scenario is the opposite: the larger the value of m*, the larger is A* and the smaller is Ur for galloping onset (figure 4a). That is, the vortex excitation regime shrinks, and the onset of galloping advances when m* is increased. The surge in A* at 1:3 synchronization grows with increasing m*. In addition, a larger m* in the GB regime leads to (i) reductions in fs/fo and gradient of fs/fo with Ur (figure 4b; (3.1)), (ii) a decrease of St and (iii) an augmentation of fr.
The maximum A* of a square cylinder in the VIV regime is much smaller than that of a circular cylinder case (Sen & Mittal Reference Sen and Mittal2011, Reference Sen and Mittal2015; Li et al. Reference Li, Lyu, Kou and Zhang2019). Li et al. (Reference Li, Lyu, Kou and Zhang2019) for a square cylinder at Re = 150 demonstrated that the maximum A* is 0.17, 0.14 and 0.11 at m* = 5, 10 and 20, respectively. Zhao (Reference Zhao2015) observed the maximum A* of 0.11 at m* = 10 and Re = 200. The maximum A* in our study (Re = 170) is 0.18, 0.14 and 0.1 at m* = 5, 10 and 20, respectively. Thus, the observed influence of m* on the vibration response within the VIV regime in our study appears to be consistent with the previous findings. Experimental results, typically obtained at higher Re values, feature larger A* values in the galloping regime (Zhao et al. Reference Zhao, Leontini, Jacono and Sheridan2014) than the numerical results at lower Re values.
3.2. Effect of m* on fluid forces
Figure 5(c,d) illustrates dependencies of  ${\bar{C}_D}$ and
 ${C^{\prime}_L}$ on Ur for different m* values. The corresponding
 ${\bar{C}_{D0}}$ and
 ${C^{\prime}_{L0}}$ for the fixed cylinder are represented by blue dashed lines. In IB, with increasing Ur,
 ${\bar{C}_D}$ (
 $< {\bar{C}_{D0}}$) declines and
 ${C^{\prime}_L}$ (
 $> C^{\prime}_{L0}$) grows for all m* values. A larger m* corresponds to a larger
 ${\bar{C}_D}$ but a smaller
 ${C^{\prime}_L}$. The scenario is the opposite in LB, i.e.
 ${\bar{C}_D} > {\bar{C}_{D0}}$ and
 ${C^{\prime}_L} < {C^{\prime}_{L0}}$, the former declining and the latter growing. On the other hand,
 ${\bar{C}_D}$ augments in GB, with surges at 1:3 synchronization. Although rising in the early part of GB (i.e. up to 1:3 synchronization for m* = 10 and 20, and 1:5 synchronization for m* = 5),
 ${C^{\prime}_L}$ does not appreciably vary in the late part of GB.
Parameter m* has distinct influences in different regimes. Increasing m* renders increased  ${\bar{C}_D}$ and decreased
 ${C^{\prime}_L}$ in IB but the reverse correspondence in LB. In GB, relationships of
 ${\bar{C}_D}$ and
 ${C^{\prime}_L}$ with m* are straightforward, both increasing with m*. A fixed cylinder, complementing fn = ∞, corresponds to Ur = 0. Parameters
 ${\bar{C}_D}$,
 ${C^{\prime}_L}$ and St all approach their fixed cylinder values when Ur decreases toward Ur = 0.
3.2.1. Quiescent fluid added-mass force and flow-induced force
According to Lighthill (1986), the lift force (FL) can be decomposed into a ‘potential force’ component and a ‘vortex force’ component, where the ‘potential force’ is caused by the potential added-mass force and the ‘vortex force’ is due to the dynamics of vorticity in the flow. Given that the fluid is viscous, Alam (Reference Alam2022) proposed a quiescent-fluid added-mass force FLa 0 (replacing the potential force) and a flow-induced force FLf (replacing the vortex force). Naturally, the magnitude of the quiescent-fluid added-mass force differs from that of the potential force, depending on the body shapes and orientations (Chen, Alam & Zhou Reference Chen, Alam and Zhou2020). Alam (Reference Alam2022) further proved that the quiescent-fluid added-mass force must be considered to correctly estimate the flow-induced force and the phase lag between force and displacement. The total lift force is expressed as
 \begin{equation}{F_L} = {F_{La}}_0 + {F_{Lf}}.\end{equation}
Normalizing all forces by  $(1\textrm{/}2\rho U_\infty ^2D)$,
 \begin{equation}{C_L}(t) = {C_{La}}_0(t) + {C_{Lf}}(t).\end{equation}
Here,  ${C_L}(t)$ is the lift force coefficient, defined as
 ${C_L}(t) = {F_L}(t)/(0.5\rho DU_\infty ^2)$, and
 ${F_L}(t)$ is the total force on the cylinder in the y direction. Coefficients CLa 0(t) and CLf(t) are the instantaneous quiescent-fluid added-mass force coefficient and flow-induced force coefficient, respectively.
Force FLa 0(t) is given by
 \begin{equation}{F_{La\textrm{0}}}(t) =- {m_{a{\kern 1pt} \textrm{0}}}\ddot{y}(t)\quad (\textrm{neglecting}\;\textrm{quiescent - fluid}\;\textrm{damping}\;\textrm{force}).\end{equation}
Here,  ${m_{a\textrm{0}}}$ is the quiescent-fluid added mass and is expressed as
 ${m_{a\textrm{0}}} = m_{a\textrm{0}}^\ast{\times} {m_d}$, where
 $m_{a\textrm{0}}^\ast $ is the quiescent-fluid added-mass ratio and
 ${m_d} = \rho {D^2}$ is the fluid mass displaced by the cylinder.
The quiescent-fluid added mass and potential added mass are the added masses measured in the quiescent fluid (still and viscid fluid) and potential fluid (inviscid, incompressible fluid), respectively. The former is generally measured numerically while the latter can be measured both numerically and experimentally by plucking the cylinder in quiescent fluid. When the damping is small, the natural frequency of the cylinder system in a vacuum can be considered as
 \begin{equation}{f_n} = \frac{1}{{2{\rm \pi} }}\sqrt {\frac{k}{m}} .\end{equation}
When the cylinder is submerged in a fluid (e.g. water), the natural frequency of the cylinder oscillation changes because of the added mass ma generated by the fluid. The modified natural frequency fnf of the cylinder in a fluid can be expressed as
 \begin{equation}{f_{nf}} = \frac{1}{{2{\rm \pi} }}\sqrt {\frac{k}{{m + {m_a}}}} .\end{equation}
 \begin{equation}{m_a} = m\left[ {{{\left( {\frac{{{f_n}}}{{{f_{nf}}}}} \right)}^2} - 1} \right].\end{equation}
When fnf is measured directly from the decay of the cylinder oscillation, all the parameters on the right-hand side of (3.7) are known, which leads to the estimation of ma. See Chen et al. (Reference Chen, Alam and Zhou2020) and Alam (Reference Alam2022) for details of measuring ma. The quiescent-fluid added-mass coefficient  $m_{a\textrm{0}}^\ast $ is coincidentally about 1.0 for a circular cylinder but approximately 1.5 for a square cylinder with zero incidence angle (Chen et al. Reference Chen, Alam and Zhou2020).
Following (3.3), CL(t) is then decomposed into CLa 0(t) and CLf(t), and their corresponding fluctuating (root-mean-square) coefficients  ${C^{\prime}_{La\textrm{0}}}$ and
 ${C^{\prime}_{Lf}}$, respectively, are obtained as presented in figure 6. Coefficient
 ${C^{\prime}_{La\textrm{0}}}$ gets smaller with increasing m* in all branches. In IB, the growth in
 ${C^{\prime}_{La\textrm{0}}}$ is very high for all m* values, largely following A* trends in IB. On the other hand,
 ${C^{\prime}_{Lf}}$ in IB does not change appreciably for the high m* = 10 and 20 but does increase for the low m* = 5. Both
 ${C^{\prime}_{La\textrm{0}}}$ and
 ${C^{\prime}_{Lf}}$ decline in LB for all m* values. This suggests that the increase of A* in IB is largely due to the imminent resonance effect (vortex shedding frequency approaching the cylinder natural frequency), while the decrease of A* in LB results from the decreasing
 ${C^{\prime}_{Lf}}$ and the retreating resonance effect (vortex shedding frequency retreating from the cylinder natural frequency). A larger m* leads to a smaller
 ${C^{\prime}_{Lf}}$ in LB but the opposite scenario takes place in GB. Interestingly, in GB, although A* increases with increasing Ur for all m* values,
 ${C^{\prime}_{Lf}}$ and
 ${C^{\prime}_{La\textrm{0}}}$ gently increase and decrease (Ur > 16), respectively. This indicates that flow-induced force (FLf) and added-mass force (FL 0) in GB vary with
 $U_r^{2 + }$ and
 $U_r^{2 - }$, respectively. There are peaks in
 ${C^{\prime}_{Lf}}$ at Ur = 16 and 17.7 for m* = 10 and 20, respectively, where both Ur values correspond to fs/fo = 3. Similar peaks are also observed for
 ${C^{\prime}_{La\textrm{0}}}$, albeit weaker than those for
 ${C^{\prime}_{Lf}}$.
(a) Variations of fluctuating quiescent-fluid added-mass force coefficient  ${C^{\prime}_{La\textrm{0}}}$ and flow-induced lift coefficient
 ${C^{\prime}_{Lf}}$ with Ur and m*. (b) Zoomed-in view of (a) for Ur = 1–8. Here, ζ = 0 and Re = 170.

3.3. Role of effective added mass ratio in vibration branches
When a square cylinder oscillates freely in the transverse direction, the effective added mass ratio  $m_{ae}^\ast $ and added damping ratio ζa can be presented as
 \begin{equation}m_{ae}^\ast= \frac{{{m_{ae}}}}{{\rho {D^2}}} = \frac{{{F_{L0}}\,\textrm{cos}\,\phi }}{{\rho {{(2{\rm \pi} {f_o})}^2}{Y_0}{D^2}}}\end{equation}
and
 \begin{equation}{\zeta _a} = \frac{{{c_a}}}{{{c_c}}} =- \frac{{{F_{L0}}\,\textrm{sin}\,\phi }}{{8{{\rm \pi} ^2}m{f_o}{f_n}{Y_0}}}.\end{equation}
The different branches of VIVs have different relationships of  $m_{ae}^\ast $ with Ur (figure 7e). In IB, the FL and Y signals are in phase, cos ϕ > 0;
 $m_{ae}^\ast $ is therefore positive. On the contrary, the FL and Y signals are out of phase, cos ϕ < 0, in LB, which makes
 $m_{ae}^\ast $ negative. The IB and LB are distinguished by
 $m_{ae}^\ast $ changing from positive to negative (figure 7e). In the IB and LB, the cylinder motion is sinusoidal. The natural frequency of the vibrating cylinder is then modified because of
 ${m_{ae}}$ generated by the surrounding fluid. The modified frequency fnf equals the natural frequency of the cylinder vibrating in the fluid, i.e. fnf = fo:
 \begin{equation}{f_o} = \frac{1}{{2{\rm \pi} }}\sqrt {\frac{k}{{m + {m_{ae}}}}} .\end{equation}
 \begin{equation}{m_{ae}} = m[{(\kern1pt{f_n}/{f_o})^2} - 1].\end{equation}
Parameter  $m_{ae}^\ast $ can be presented as
 \begin{equation}m_{ae}^\ast= \frac{{{m_{ae}}}}{{\rho {D^2}}} = {m^\ast }[{(\kern1.5pt{f_n}/{f_o})^2} - 1] = {m^\ast }[{(1/{f_r})^2} - 1].\end{equation}
The equation demonstrates that  $m_{ae}^\ast $ is proportional to
 $[{(1/{f_r})^2} - 1]$. Since fr being <1.0 linearly grows with Ur in IB (figure 5b),
 $m_{ae}^\ast $ being >0 declines parabolically with Ur. On the other hand, again fr grows with Ur in LB but now fr > 1.0, hence
 $m_{ae}^\ast $ is negative, declining with Ur at a smaller slope than that in IB. A large m* yields a greater
 $m_{ae}^\ast $ magnitude in both IB and LB as
 $m_{ae}^\ast $ is directly proportional to m* (figure 7e; (3.12)).
(a) Time histories, (b) power spectral density functions, (c) time histories of low-pass-filtered and(d) time histories of high-pass-filtered Y* (black lines) and CL (red lines) at Ur = 26 and m* = 20. (e) Variations of effective added mass  $m_{ae}^\ast $ with Ur and (f) zoomed-in view of
 $m_{ae}^\ast $ variations in GB. Here, ζ = 0 and Re = 170.

In GB, both FL and Y signals are composed of low- and high-frequency components corresponding to the oscillation and vortex shedding frequencies, respectively (figure 7a). These low- and high-frequency components were decomposed using the FFT-filter tool (figure 7c,d). The cutoff frequency for the decomposition was chosen as the average of the high and low frequencies. It can be observed that there are two major peaks in the power spectra (figure 7b) for the vibration in GB. The CL and Y* associated with the cylinder oscillation are in phase (figure 7c), while those with the vortex shedding frequency are antiphase (figure 7d). In GB, the effective added mass associated with the cylinder vibration can be referred to as  $m_{ae}^\ast $ while that with the vortex shedding frequency is termed as
 $m_{aes}^\ast $ (figure 7e). Here
 $m_{ae}^\ast $ jumps from negative to positive at the onset of galloping. The jump in
 $m_{ae}^\ast $ is caused by the drop in fr while
 $m_{ae}^\ast $ in GB is positive because fr < 1.0 (figure 5b; (3.12)). The value of
 $m_{ae}^\ast $ in GB slightly declines with increasing Ur and m* (figure 7f), following the increase of fr with Ur (figures 5b and 7e; (3.12)). On the other hand,
 $m_{aes}^\ast $ is negative and declines when Ur is increased, and a larger m* corresponds to a smaller
 $m_{aes}^\ast $ (figure 7e). In IB and LB, the cylinder vortex shedding frequency (fs) equals the vibration frequency (fo), i.e. fs = fo, where only one frequency persists in both FL and Y signals. Parameter
 $m_{aes}^\ast $ in IB and LB thus can be expressed as
 \begin{equation}m_{aes}^\ast= \frac{{{m_{ae}}}}{{\rho {D^2}}} = {m^\ast }[{(\,{f_n}/{f_s})^2} - 1] = {m^\ast }[{(1/{f_r})^2} - 1].\end{equation}
Therefore,  $m_{aes}^\ast= m_{ae}^\ast $ in IB and LB, where the dependence of
 $m_{aes}^\ast $ on Ur is the same as that of
 $m_{ae}^\ast $. The major features of different branches are summarized in figure 8.
Typical response curve showing major characteristics in IB, LB and GB as well as at their borders.

3.4. Identifications of IB–LB and LB–GB boundaries
In FIV experiments and simulations, researchers largely get vibration response (A* versus Ur) and have difficulty in identifying the borders between different branches in A* versus Ur curves, particularly when the A* variations with Ur are smooth. Bhatt & Alam (Reference Bhatt and Alam2018) showed that the borders between IB and LB can be distinguished from the relationship between St and Ur as St < St 0 for IB and St > St 0 for LB. That is, the IB–LB boundary (i.e. boundary between IB and LB) is accompanied by a jump in St (figure 8). Without measuring St, how can the borders be determined? Here are additional methods to identify the borders. Firstly, the IB–LB boundary can be identified from the change in  $m_{ae}^\ast $ from +ve to −ve, and the LB–GB boundary can be pinpointed from the change in
 $m_{ae}^\ast $ from −ve to +ve (figures 7e and 8). Secondly, the IB–LB boundary is characterized by a jump in Y* − CL phase lag from <90° to >90° (Williamson & Goverdhan Reference Williamson and Goverdhan2004; Bhatt & Alam Reference Bhatt and Alam2018). Thirdly, a dramatic drop and a rise in
 ${C^{\prime}_L}$ mark the IB–LB and LB–GB boundaries, respectively (figures 5d and 8). Fourthly, the IB–LB and LB–GB boundaries undergo a jump and a drop in fr, respectively. In the literature, the identification of different branches was made based on the relationship between St and Ur. Here, we explore more avenues and generalize them to expand the methodology for identifying these branches. Figure 8 encompasses all possible parameter changes (i.e.
 $m_{ae}^\ast $, St, ϕ,
 ${C^{\prime}_L}$ and fr), which aids in discerning distinct vibration branches when one of the parameters is measured.
3.5. Beat mechanism different from the classical beat
Next, we focus on the reasons for the uneven features of the vibration amplitude in the GB, taking the case of m* = 20 and ζ = 0 as an example. Except at Ur = 17.7–17.8 and Ur = 30–30.1, the vibrations in GB do not exactly repeat from one period to another (figures 9 and 10), which indicates that there are multiple frequency components, resulting in an obvious beat-like variation in the amplitudes of Y* histories. As already discussed with figure 4(a,b), Ur = 17.7–17.8 and Ur = 30–30.1 correspond to 1:3 (i.e. fs/fo = 3) and 1:5 (i.e. fs/fo = 5) synchronizations, respectively. Interestingly, the beating amplitude in Y* (i.e. the change in the vibration amplitude due to beating) grows and declines as fs/fo respectively approaches and departs from fs/fo = 3 and/or 5, as does the beating period (figures 9 and 10). The general consensus is that a beat is characterized by amplitude modulation. It is an interference pattern between two different frequencies, perceived as a periodic variation in amplitude. As two frequencies are close to each other (i.e. small difference between them), the beating period becomes longer and it will be infinite (constant amplitude) when the two frequencies are identical.
(a–l) Time histories of cylinder displacement Y* for different Ur. The red curve is the envelope of Y*. Here, m* = 20, ζ = 0 and Re = 170.

(a–i) Time histories of cylinder displacement response Y* for different Ur values. Here, m* = 20, ζ = 0 and Re = 170.

First, we analyse the beat phenomenon for fs/fo = 3. The Lissajous diagrams of CL–Y* for Ur = 15–20 presented in figure 11 also demonstrate that the vibration amplitude in GB changes from cycle to cycle except at Ur = 17.7–17.8 (i.e. fs/fo = 3), where the CL–Y* diagram is an enclosed curve (figure 11e,f), and the frequency in CL is three times that in Y* at Ur = 17.7–17.8. It can be deemed ‘1:3 lock-in’ where fs locks in with 3fo. Figure 12 shows power spectra (EY and ECL) and envelopes of Y* and CL at Ur = 17.5 and 19. For Ur = 17.5, fs/fo = 2.951 < 3, whereas for Ur = 19, fs/fo = 3.185 > 3. In the power spectra of EY (figure 12a,e), there is a minor peak ( $\,{f^{\prime}_o}$) on the left-hand side of fo for Ur = 17.5 (figure 12a) and on the right-hand side of fo for Ur = 19 (figure 12e). The beat frequency (i.e. the frequency of the envelope) in Y* can be represented as
 ${f_{bY}} = 1/{T_{bY}} = |\,{f_o} - {f^{\prime}_o}|$ (figure 12c,g). The question is, what is the origin of
 ${f^{\prime}_o}$? Generally, such a beat frequency is generated from the interference between two frequencies. One can expect this beat frequency is due to the difference between the vortex shedding frequency and cylinder vibration frequency as these two frequencies are predominantly active during the cylinder vibrations. This is, however, not the case here as is shown below.
(a–i) Lissajous CL–Y* diagrams for different Ur. Here, m* = 20, ζ = 0 and Re = 170.

Power spectrum of (a,e) Y* and (b,f) CL. Envelopes of (c,g) Y* and (d,h) CL. (a–d) Ur = 17.5, (e–h) Ur = 19. Here, m* = 20, ζ = 0 and Re = 170.

Similarly, there is a minor peak ( $\,{f^{\prime}_s}$) on the right-hand side of fs (i.e. fs/fo < 3) and on the left-hand side of fs (i.e. fs/fo > 3) for Ur = 17.5 and 19, respectively (figure 12b,f). The corresponding beat frequency is
 ${f_{bL}} = 1/{T_{bL}} = |\,{f_s}-{f^{\prime}_s}|$ (figure 12d,h).
For a given Ur,
 \begin{equation}{f_{bY}} = {f_{bL}}\quad (\textrm{i}\textrm{.e}\textrm{.}\;{T_{by}} = {T_{bL}})\end{equation}
and
 \begin{equation}|\,{f_o}-{f^{\prime}_o}|= |\,{f_s}-{f^{\prime}_s}|.\end{equation}
It is found that  ${f^{\prime}_s} = 3{f_o}$.
Using (3.14), it can, therefore, be written as
 \begin{equation}|\,{f_s}-{f^{\prime}_s}|= |\,{{f_s} - \textrm{ }3{f_o}} |= |\,{f_o}-{f^{\prime}_o}|.\end{equation}
This is to say that the beat frequency in both Y* and CL is fb = |fs − 3fo|. This explains that the beat frequency will be smaller as fs/fo gets closer to 3, and it will be zero (no beating) when fs/fo = 3. That is, the beating phenomenon is linked to the difference between fs and 3fo, tending to 1:3 synchronization, not directly linked to the difference between fs and fo. In GB, since fs/fo is proportional to Ur (figure 4b; (3.1)), the beating Ur around fs/fo = 3 can be predicted from (3.1) for different values of m*. The other peaks ECL and EY emerge at  $2{f_s} - {f^{\prime}_s}$ and
 $2{f_o}-{f^{\prime}_o}$, respectively. A beating phenomenon was also observed in some studies of the FIV of a circular cylinder associated with a mode change or mode competition. Voorhees et al. (Reference Voorhees, Dong, Atsavapranee, Benaroya and Wei2008), Zhang et al. (Reference Zhang, Li, Ye and Jiang2015) and Shen et al. (Reference Shen, Chan and Wei2018) indicated that this beating is due to the difference between the vibration frequency and the vortex shedding frequency (i.e. fo and fs), while Pan, Cui & Miao (Reference Pan, Cui and Miao2007) and Mittal (Reference Mittal2017) claimed that the beating is the modulation between the natural frequency fn of the cylinder and the Strouhal frequency fs ,fixed of the fixed cylinder. The beating phenomenon of a vibrating square cylinder in GB, however, is not the same as the cases of the circular cylinder mentioned above. It is the difference between fs and 3fo that gives rise to the beating phenomenon as fs/fo gets close to 3. This observation is made for the first time.
Apart from the 1:3 synchronization mentioned above, we also observed the 1:5 synchronization (fs/fo = 5) between the vibration frequency and the shedding frequency at Ur = 23.65, 27.6 and 30 for m* = 5, 10 and 20, respectively. Here the beat frequency fb = |fs − 5fo| as fs/fo gets close to 5. The beat amplitude (figure 10) is, however, much smaller than that in the case involving 1:3 synchronization (figure 9).
3.6. Effects of m*, ζ, m*ζ,  $({m^\ast } + m_{a\textrm{0}}^\ast )\zeta$ and $({m^\ast } + m_{ae}^\ast )\zeta$ on Urc for galloping onset


Next, we analyse the effects of m* and ζ on Urc for the onset of galloping. To save time and computational resources, we simulated the responses at high Ur values only (figures 13 and 14). Parameter Urc is identified from the abrupt increase in A* (figure 13) and/or from the sudden decrease in fr (figure 14). For all ζ values examined, A* decreases with increasing m* before the galloping onset (i.e. for Ur < Urc), which implies that A* in LB and/or DB (desynchronization branch) weakens with increasing m*. However, for a given m*, A* for Ur < Urc does not change appreciably with increasing ζ. Figure 14 displays that fr > 1.0 for Ur < Urc but fr < 1.0 for Ur > Urc. In the latter Ur regime, when m* is increased, fr increases to approach 1.0.
Variations of vibration amplitude A* with reduced velocity Ur for different m* and ζ values. Here, Re = 170.

Variations of frequency ratio fr with reduced velocity Ur for different m* and ζ. The red dotted line represents fr = 1. Here, Re = 170.

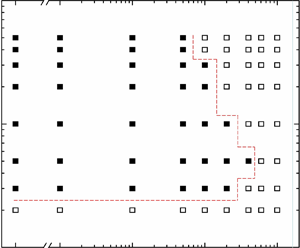
To further investigate the influence of m* and ζ on Urc, more cases of m* and ζ are also considered. Table 3 summarizes Urc for m* = 2, 3, 5, 10, 20, 30, 40 and 50 and ζ = 0, 0.001, 0.01, 0.05, 0.1, 0.2, 0.4, 0.6 and 1.0 at Ur ≤ 80. When ζ = 0, Urc is 17, 13, 12, 12, 12, 12 and 12 for m* = 3, 5, 10, 20, 30, 40 and 50, respectively, i.e. Urc decreases with increasing m* for 3 ≤ m* < 10 before being insensitive to m* for m* ≥ 10. Figure 15 shows the dependence of galloping occurrence on m* = 2–50 and ζ = 0–1. No galloping is observed at m* = 2 for all ζ values examined. Galloping is observed for m* = 3–10 when ζ = 0.2, while the same occurs at m* = 5 only for ζ = 0.4. For ζ ≥ 0.6, no galloping is observed, regardless of m*, until Ur = 80 examined. When m* is increased from 5 (i.e. m* ≥ 5), Urc changes insignificantly for ζ ≤ 0.01, but significantly for ζ ≥ 0.05 (table 3, figure 16a). Parameter Urc, however, significantly increases when m* is decreased from 5 to 3 for all ζ values (table 3, figure 16b). For all m* values examined, an increase in ζ makes Urc higher, particularly when ζ > 0.01 (table 3, figure 16b). That is, the effect of ζ on Urc is insignificant for ζ ≤ 0.01 but significant for ζ > 0.01, a higher ζ suppressing the cylinder vibration. Joly et al. (Reference Joly, Etienne and Pelletier2012) also found a higher Urc value at ζ = 0.1 than that at ζ = 0.
Effects of m* and ζ on Urc. ‘—’ means no galloping observed for Ur ≤ 80 examined.

Dependence of galloping occurrence on m* = 2–50 and ζ = 0–1. Here, Re = 170.

Effect of (a) mass ratio m* and (b) damping ratio ζ on critical reduced velocity Urc. Here, Re = 170.

The three-dimensional view of the dependence of Urc on m* and ζ shown in figure 17 allows us to observe the variations of Urc with m* and ζ more intuitively at ζ ≤ 0.2. The value of Urc achieves its maximum at m* = 30 and ζ = 0.1. For all m* values, an increase in ζ leads to a larger Urc. The increase is, nevertheless, larger for a large m*. Particularly for ζ > 0.01, Urc declines for m* ≤ 5 and rapidly increases with increasing m*. The degree of the decrease and/or increase becomes larger for a higher ζ value.
Relationship of Urc with m* (= 3–50) and ζ (= 0–0.2). Here, Re = 170.

Some researchers have debated whether m*ζ can serve as the FIV criterion of a circular cylinder. Griffin, Skop & Ramberg (Reference Griffin, Skop and Ramberg1975) and Griffin (Reference Griffin1980) used a Skop–Griffin parameter SG ( $= 2{{\rm \pi} ^3}{S^2}{m^\ast }\zeta $, where S is the Strouhal number of the static cylinder) to plot the maximum vibration amplitude
 $A_{max}^\ast $ against SG (i.e. m*ζ). It is known as the Griffin plot. However, this plot showed a large scatter of
 $A_{max}^\ast $ data. Later, Khalak & Williamson (Reference Khalak and Williamson1999) and Govardhan & Williamson (Reference Govardhan and Williamson2000) introduced a combined parameter
 $({m^\ast } + m_{a0}^\ast )\zeta$ to modify the Griffin plot, where
 $m_{a\textrm{0}}^\ast $ (i.e. potential added-mass ratio CA in their investigations) is the quiescent-fluid added-mass ratio and is about 1.0 for a circular cylinder. They demonstrated that
 $({m^\ast } + m_{a0}^\ast )\zeta$ collapses the
 $A_{max}^\ast $ data well for a wide range of
 $({m^\ast } + m_{a0}^\ast )\zeta > 0.06$. Sarpkaya (Reference Sarpkaya1978, Reference Sarpkaya1995) stated that the vibration response depends on m*ζ for SG > 1 (i.e. m*ζ > 0.4), while it depends on m* and ζ separately rather than on m*ζ for m*ζ < 0.4. Blevins & Coughran (Reference Blevins and Coughran2009) for two-degrees-of-freedom vibration found that the ratio of inline to transverse amplitudes is governed by m* and ζ independently. Bahmani & Akbari (Reference Bahmani and Akbari2010) claimed that m*ζ can be used to characterize
 $A_{max}^\ast $ with an acceptable accuracy. For a cylinder submerged in the wake of another cylinder, Alam (Reference Alam2021) claimed that m*ζ (i.e. m*ζ = 0–8) does not serve as a unique parameter to characterize the vibration amplitude. In addition, Bearman (Reference Bearman1984) reported that low values of m* affect the frequency ratio independently, not m*ζ. Williamson & Goverdhan (Reference Williamson and Goverdhan2004) and Govardhan & Williamson (Reference Govardhan and Williamson2004) demonstrated that the VIV range depends only on m* at (m* + CA)ζ < 0.05. Here, we will see whether m*ζ or
 $({m^\ast } + m_{a\textrm{0}}^\ast )\zeta$ works well to collapse Urc data. If not, what is the intrinsic parameter that dictates the vibration? Figure 18(a,b) shows the relationships of Urc with m*ζ and
 $({m^\ast } + m_{a\textrm{0}}^\ast )\zeta$. As shown in figure 18(a), there are more than one Urc data point, significantly different, for a given m*ζ (e.g. three Urc values for m*ζ = 1.0 and four Urc values for m*ζ = 2.0), which indicates that m*ζ cannot serve as the only criterion for galloping onset. In figure 18(b), the Urc data scattering alleviates, which points to a linear increase in Urc with
 $({m^\ast } + m_{a\textrm{0}}^\ast )\zeta$ overall at m* ≥ 5. But still, there are some scattered data points, and the collapse of Urc data on a line is still not credible. It hints that something is still missing in
 $({m^\ast } + m_{a\textrm{0}}^\ast )\zeta$. We find the missing parameter here.
Combined mass-damping parameter (a) m*ζ and (b)  $({m^\ast } + m_{a0}^\ast )\zeta $ with critical reduced velocity Urc. Here, Re = 170.

As m* decreases, fr in GB deviates considerably from unity, i.e. the vibration frequency differs from the natural frequency (figures 5b and 14). The deviation is attributed to the flow-induced added mass  $m_{af}^\ast $ that should be considered in
 $({m^\ast } + m_{a\textrm{0}}^\ast )\zeta$. The effective added mass is the quiescent-fluid added mass plus flow-induced added mass, i.e.
 $m_{ae}^\ast= m_{a0}^\ast+ m_{af}^\ast $ (Alam Reference Alam2022). While
 $m_{a\textrm{0}}^\ast $ is independent of Ur,
 $m_{af}^\ast $ is highly dependent on Ur and markedly changes at Urc. Therefore,
 $m_{af}^\ast $ is crucial and should be added with
 $m_{a\textrm{0}}^\ast $. That is, in the mass-damping parameter, we have to consider
 $m_{ae}^\ast $, not
 $m_{a\textrm{0}}^\ast $, i.e.
 $({m^\ast } + m_{a\textrm{0}}^\ast )\zeta$ should be replaced by
 $({m^\ast } + m_{ae}^\ast )\zeta$. As shown in figure 7(f),
 $m_{ae}^\ast $ jumps at Urc and declines with increasing m* and Ur. We consider
 $m_{ae}^\ast $ at the galloping onset for
 $({m^\ast } + m_{ae}^\ast )\zeta$, and the dependence of Urc on
 $({m^\ast } + m_{ae}^\ast )\zeta$ is presented in figure 19. For
 $({m^\ast } + m_{ae}^\ast )\zeta > 0.55$, as shown in figure 19(a), the Urc data points collapse well on a line at m* ≥ 5, showing that Urc linearly increases with
 $({m^\ast } + m_{ae}^\ast )\zeta$. The relationship between Urc and
 $({m^\ast } + m_{ae}^\ast )\zeta$ can be represented by a curve-fitting equation:
 \begin{equation}{U_{rc}} = 17.4({m^\ast } + m_{ae}^\ast )\zeta + 2.5\quad (\textrm{for}\;({m^\ast } + m_{ae}^\ast )\zeta > 0.55\;\textrm{and}\;{m^\ast } \ge 5).\end{equation}
(a) Relationship between critical reduced velocity Urc and combined mass-damping parameter  $({m^\ast } + m_{ae}^\ast )\zeta $. (b) Zoomed-in view of Urc variations at
 $({m^\ast } + m_{ae}^\ast )\zeta \le 0.55$.

For  $({m^\ast } + m_{ae}^\ast )\zeta \le 0.55$ as shown in figure 19(b), the Urc also increases linearly, albeit with a smaller slope, with increasing
 $({m^\ast } + m_{ae}^\ast )\zeta$ for m* ≥ 5. The Urc data points for m* = 5 appear more scattered when
 $({m^\ast } + m_{ae}^\ast )\zeta > 0.55$. The linear relationship at
 $({m^\ast } + m_{ae}^\ast )\zeta \le 0.55$ and m* ≥ 5 can be represented as
 \begin{equation}{U_{rc}} = 5.6({m^\ast } + m_{ae}^\ast )\zeta + 12.3\quad (\textrm{for}\;({m^\ast } + m_{ae}^\ast )\zeta \le 0.55\;\textrm{and}\;{m^\ast } \ge 5).\end{equation}
Equation (3.18) further proves that when ζ = 0 or is very small, Urc becomes independent (Urc = 12.3) of m*, which is consistent with the observation made in figure 16(a).
For m* = 3, Urc again linearly increases with  $({m^\ast } + m_{ae}^\ast )\zeta$, with a larger slope than the case for m* ≥ 5 (figure 19a). The relationship between Urc and
 $({m^\ast } + m_{ae}^\ast )\zeta$ can be expressed as
 \begin{equation}{U_{rc}} = 18.5({m^\ast } + m_{ae}^\ast )\zeta + 16\quad (\textrm{for}\;{m^\ast } = 3).\end{equation}
The slopes of Urc in (3.17) and (3.19) are close to each other although the Urc intercepts differ between the two cases.
The use of  $({m^\ast } + m_{ae}^\ast )\zeta$ in (3.17)–(3.19) can predict Urc. Term
 $({m^\ast } + m_{ae}^\ast )\zeta$ can, therefore, be considered a criterion for the prediction of galloping onset. Equation (3.17) also illustrates why galloping is not observed for m* = 20 and ζ = 0.2, where
 $({m^\ast } + m_{ae}^\ast )\zeta = 4.76$. The value of Urc predicted by (3.17) is 85.19 > 80 examined. It can therefore be concluded that the criterion for a fluid–structure system is
 $({m^\ast } + m_{ae}^\ast )\zeta$, not m*ζ or (m* + CA)ζ or
 $({m^\ast } + m_{a\textrm{0}}^\ast )\zeta$. For a given
 $({m^\ast } + m_{ae}^\ast )\zeta$, Urc is higher for m* < 5 than for m* ≥ 5. There is a threshold of m* (= 5) after (m* ≥ 5) or before (m* < 5) which the relationships between Urc and
 $({m^\ast } + m_{ae}^\ast )\zeta$ differ. We further shed light on this threshold in the next section.
3.7. Underlying physics of m* and ζ effects on galloping onset
3.7.1. Effects of m* and ζ when ζ = 0
Using the global linear stability analysis method, Meliga & Chomaz (Reference Meliga and Chomaz2011), Zhang et al. (Reference Zhang, Li, Ye and Jiang2015) and Yao & Jaiman (Reference Yao and Jaiman2017) investigated the mechanism of VIVs of a freely vibrating cylinder. They identified two modes responsible for the onset of instability in the fluid–structure system: wake mode (WM) and structure mode (SM). These two leading modes have a strong coupling for low m*, while they are decoupled for high m*. Parameter m* plays an important role in the selection of the leading mode. The essential characteristic of the flutter-induced lock-in is the competition between the two unstable modes (Zhang et al. Reference Zhang, Li, Ye and Jiang2015). Li et al. (Reference Li, Lyu, Kou and Zhang2019) utilized linear stability analysis and direct numerical simulations to investigate the underlying mechanisms of galloping of a square cylinder with zero damping. They concluded that the unstable SM leads to the low-frequency large-amplitude vibration of the cylinder, while the unstable WM results in the high-frequency vortex shedding in the wake. The instability of SM is the primary cause of the galloping phenomenon. The onset of galloping is postponed when SM and WM compete with each other. As such, the galloping phenomenon can be completely suppressed or Urc can be delayed at relatively low-Re and low-m* (< 5) conditions. In their study, the galloping vibration completely disappeared for low m* (m* < 4, Re = 150) because of the strong competition between the enhanced SM and WM at low m* (lighter structure). They also introduced a ‘pre-galloping’ region, located between VIV and galloping, where galloping does not occur but the SM is unstable.
Here, we investigate the influence of m* on galloping by analysing the high-frequency (fs) and low-frequency (fo) signals of the vibration. At ζ = 0, Urc remains constant for m* ≥ 10 while it increases with decreasing m* for 3 ≤ m* < 10. Ultimately, galloping is suppressed for m* ≤ 2, i.e. a relatively low m* inhibits galloping. Given that the maximum Ur examined in this study is 80, galloping may be observed for a smaller m* (≤ 2) if Ur is further increased (Han & Langre Reference Han and Langre2022). It has already been shown that the high-pass-filtered CL and Y* associated with the vortex shedding are antiphase, not auspicious for the cylinder vibration. Conversely, the low-pass-filtered signals are in phase, auspicious for the cylinder vibration. First, we analyse vibration signals (Y*) at m* = 20 with Ur = 12 and 13, corresponding to pre-galloping and galloping regions, respectively (figure 20a,d). To gain insight into the evolution of the frequency content over time, the continuous wavelet transform (CWT) is performed using the Morlet wavelet (figure 20b,e). The wavelet centre frequency Fc = 3 and the wavelet scales equal 2Fc–2Fc × 214, which allows us to measure frequency in the range of Fs/214–Fs/2 (where Fs is the sampling frequency). Additionally, power spectra of vibration responses in different developing regimes are shown in figure 20(c,f). The cylinder vibration in each signal comprises two distinct frequencies fo and fs, associated with SM and WM, respectively. Consider EY,fo and EY, fs as the energy intensity at fo and fs, respectively.
(a,d) Time histories of Y*. (b,e) Time–frequency spectrum of Y* based on CWT. (c,f) Power spectral density functions of Y* at different regimes. (a–c) m* = 20, Ur = 12; and (d–f) m* = 20, Ur = 13. Here, ζ = 0 and Re = 170.

In the pre-galloping region, the vibration amplitude rapidly develops and reaches its maximum at t* ≈ 200 (figure 20a). At t* < 800, there is an intensified competition between fo and fs, where EY, fo and EY,fs are considerable (figure 20c); this transition is marked as regime I. In regime II, EY, fo rapidly decreases and becomes insignificant while EY, fs dominates the competition, suppressing the vibration at fo (figure 20c). In regime III (t* > 2500), the cylinder vibration solely occurs at fs, and the amplitude remains constant.
After galloping, EY, fo increases gradually in regimes I and II, and it remains unchanged in regime III (figure 20e). In regime I, EY, fo is lower than EY, fs (figure 20f). Parameter EY, fo increases and EY, fs remains unchanged from regimes I to II; eventually, EY, fo becomes larger than EY, fs. This indicates that SM dominates the competition and results in the occurrence of galloping. In regime III, EY, fo remains unchanged, with EY, fo/EY, fs = 7.92 (figure 20f).
The EY values can be used to characterize the vibration amplitude. As shown in figure 21, the cylinder vibration is decomposed into low-frequency and high-frequency vibrations after the commencement of galloping. We define the vibration amplitudes of the low- and high-pass-filtered Y* as  $A_{low}^\ast $ and
 $A_{high}^\ast $ corresponding to EY, fo and EY, fs, respectively. In the pre-galloping region, the vibration amplitude A* in regime III can also be characterized by EY, fs, which declines gently with increasing Ur (figures 4a and 21). After the onset of galloping,
 $A_{high}^\ast $ remains almost unchanged. The almost unchanged EY, fs and
 $A_{high}^\ast $ nearly before the galloping occurrence and after the galloping occurrence indicate that vortex shedding is not involved in the occurrence of galloping. The value of
 $A_{low}^\ast $, however, increases markedly with the increase of Ur in the galloping regime. It is the low-frequency motion (SM) that is auspicious for the cylinder vibration, and consequently promotes the occurrence of galloping. As shown in figure 20(b,e), EY, fo at m* = 20 and 13 is significantly greater than that at Ur = 12, while EY, fs is almost the same.
Dependence of A* on Ur and m*. Here, ζ = 0 and Re = 170.

Since Urc is delayed with a decrease in m* from 5 to 3 and galloping is suppressed for m* = 2 (table 3, figure 16a), we will further investigate the mode competition phenomenon at m* = 3 to evaluate to influence of m* on the competition. At m* = 3, both A* in pre-galloping region and  $A_{high}^\ast $ in galloping regime increase compared to that at m* = 20 (figure 21), and the EY, fs value at m* = 3 is significantly intensified (figures 20b,e and 22b,e). Consequently, the competition between EY, fo and EY, fs becomes more intense at m* = 3, with EY, fo/EY, fs = 1.52 at the galloping onset in regime III (figure 22f). It can be inferred that if m* is further decreased, EY, fs could completely overpower EY, fo and suppress galloping. At the galloping onset, EY, fo/EY, fs, i.e.
 $A_{low}^\ast{/}A_{high}^\ast $, diminishes with decreasing m*. It can be reasonably inferred that if
 $A_{low}^\ast{/}A_{high}^\ast $ at the galloping onset drops to 1 with a further decrease in m*, then galloping will be completely suppressed. Figure 23 presents the influence of
 $A_{low}^\ast{/}A_{high}^\ast $ on m* at the galloping onset. It can be seen that
 $A_{low}^\ast{/}A_{high}^\ast $ decreases linearly with decreasing m*, and can be represented by a curve-fitting equation:
 \begin{equation}A_{low}^\ast{/}A_{high}^\ast= 0.41{m^\ast } + 0.155.\end{equation}
When  $A_{low}^\ast{/}A_{high}^\ast= 1$, the critical m* predicted by (3.20) is
 $m_c^\ast= 2.06 \approx 2$. Equation (3.20) explains why galloping is not observed for m* ≤ 2. Additionally, we observed galloping at m* = 2.5 and Ur = 40, further verifying the rationality of the prediction of
 $m_c^\ast $. Figure 23 also shows the dependence of
 $A_{low}^\ast{/}A_{high}^\ast $ on m* at Re = 150 and 160, where
 $A_{low}^\ast{/}A_{high}^\ast $ declines with decreasing m*, the declining rate increasing with decreasing Re. When
 $A_{low}^\ast{/}A_{high}^\ast $ decreases to 1,
 $m_c^\ast $ is larger at a smaller Re.
(a,d) Time histories of Y*. (b,e) Time–frequency spectrum of Y* based on CWT. (c,f) Power spectral density functions of Y* at different regimes. (a–c) m* = 3, Ur = 17; and (d–f) m* = 3, Ur = 18. Here, ζ = 0 and Re = 170.

Effect of m* and Re on  $A_{low}^\ast \textrm{/}A_{high}^\ast $ at the galloping onset. Here, ζ = 0.

In summary, at ζ = 0, as m* decreases, the contribution of WM becomes more significant, leading to a delay in the onset of galloping. Eventually, galloping can be completely suppressed at sufficiently low m* values. At m* = 3, the occurrence of galloping at ζ = 0 depends on the competition between SM and WM while the competition is contingent on m*. However, at m* ≥ 5, the contribution of WM becomes negligible; the cylinder vibration is thus dominated by SM, leading to a constant Urc as m* increases.
3.7.2. Effects of m* and ζ when ζ > 0
Moving on to discussing the influence of ζ on galloping, we observe that at ζ > 0, Urc increases with the increase of ζ. Additionally, Urc shows a nonlinear relationship with m*, initially decreasing and then increasing as m* increases. When ζ = 0 or is small, Urc is independent of m* (≥ 5). As previously discussed with figure 7, when the cylinder vibrates in GB without damping (ζ = 0), the phase lag between the low-pass-filtered CL and Y* is 0° (figure 7c), while that between the high-pass-filtered CL and Y* is 180° (figure 7d). As ζ increases from 0, taking ζ = 0.05 and m* = 20 as an example, where Urc = 22.5, the phase lag ϕlow (in degrees) between the low-pass-filtered CL and Y* at Ur = 23 (beyond the galloping onset) undergoes a shift from 0 to a positive value, i.e. ϕlow ≈ 27° (figure 24a). As discussed with figure 20(a–c), in regime I of the pre-galloping region, the cylinder vibration consists of both high- and low-frequency components. Therefore, at ζ = 0.05, ϕlow ≈ 26.5° is achieved in regime I of the pre-galloping region (i.e. Ur = 22.5) (figure 24c). The phase lag between the high-pass-filtered CL and Y* at ζ > 0, however, remains 180° both before and after Urc (figure 24b,d). Therefore, the presence of damping (ζ > 0) introduces a positive phase lag between the low-pass-filtered CL and Y*, both before and after galloping, modifying the coupling between the flow and cylinder vibration.
Time histories of (a,c) low-pass-filtered and (b,d) high-pass-filtered Y* (black lines) and CL (red lines) in GB. (a,b) m* = 20, ζ = 0.05 and Ur = 23 in regime III; (c,d) m* = 20, ζ = 0.05 and Ur = 22.5 in regime I. Here, Re = 170.

Figure 25(a) demonstrates the variations of  $m_{ae}^\ast,\ {\zeta}_a $ and ϕlow with Ur at m* = 20, ζ = 0.05. In GB,
 $m_{ae}^\ast > 0$, declining with increasing Ur, in a similar fashion to the case of ζ = 0. The added damping ratio
 $\zeta_{a} $ compensates the structural damping ratio −ζ (dashed line), so that
 $\zeta_{a}+\zeta=0 $. Notably, ϕlow is positive and rises with increasing Ur. Compared with ζ = 0, it is the positive phase lag that introduces a modification in the coupling between the cylinder vibration and the fluid dynamics.
(a) Variations of phase lag ϕlow (deg.), added damping ζa and effective added mass  $m_{ae}^\ast $ with Ur at m* = 20 and ζ = 0.05. The dashed line represents −ζ. (b) Dependence of Urc on phase lag ϕlow at the galloping onset. Here, Re = 170.

The energy Wf transferred from fluid to the cylinder for each cycle of oscillation is given by
 \begin{equation}{W_f} = \int {{F_L}\,\textrm{d}Y} = \int_t^{t + T} {{F_{L0}}\,\textrm{sin}(2{\rm \pi} {f_o}t + \phi )\,\textrm{d}({Y_0}\,\textrm{sin}\,2{\rm \pi} {f_o}t) = {\rm \pi}{F_{L0}}{Y_0}\,\textrm{sin}\,\phi } .\end{equation}
When CL leads Y* (ϕ > 0), positive work is done on the cylinder. An increasing ϕ (<90°) provides more energy to the cylinder vibration.
The presence of damping (ζ > 0) introduces a positive phase lag, modifying energy transfer between the flow and cylinder, so the relationship between Urc, ζ and m* becomes more complex and it is worth understanding the influence of ζ on galloping behaviour. The coupling in the presence of damping is crucial in determining the galloping onset, especially for lower m* (m* < 5) where the role of vortex shedding becomes significant.
Figure 25(b) shows the dependence of Urc on ϕlow. At m* ≥ 5, a larger ϕlow corresponds to a larger Urc overall. The value of Urc at m* = 3, however, is obviously larger than that at m* ≥ 5, which is due to the fierce competition between SM and WM at m* = 3. As discussed before, for ζ = 0, Urc at m* = 3 entirely depends on the competition between SM and WM. Therefore, for ζ > 0, because of the presence of non-zero ϕlow, Urc at m* = 3 is influenced not only by the competition but also by the magnitude of ϕlow. On the other hand, when m* ≥ 5, the competition is weak, with no influence on the galloping onset. The value of Urc is, therefore, mainly influenced by ϕlow, while a larger m* and/or ζ yields a larger Urc.
Overall, ϕlow being associated with work done is an important factor in determining the onset of galloping, and its magnitude is influenced by both m* and ζ. Understanding the interplay between m*, ζ and ϕlow provides valuable insights into the stability of the fluid–structure system during galloping.
Figure 26(a,b) shows the effect on ϕlow (in degrees) of m* and ζ at the onset of galloping. The relationship between ϕlow and m* or ζ is straightforward, where ϕlow increases with m* (figure 26a) and/or ζ (figure 26b). In the previous sections, the relationship of Urc with m*ζ, (m* + CA)ζ or  $({m^\ast } + m_{a\textrm{0}}^\ast )\zeta$ has been made clear. Is there any relationship of ϕlow with the same? Figure 26(c,d) shows the dependencies of ϕlow on m*ζ and
 $({m^\ast } + m_{ae}^\ast )\zeta$. It is evident that there is no clear relationship between ϕlow and m*ζ (figure 26c) or
 $({m^\ast } + m_{ae}^\ast )\zeta$ (figure 26d), which precludes the use of m*ζ or
 $({m^\ast } + m_{ae}^\ast )\zeta$ to predict ϕlow effectively. However, when
 $({m^\ast } + m_{a\textrm{0}}^\ast )\zeta$ is employed (figure 27), the ϕlow data points collapse well on a line for all m* values, following a quadratic polynomial relationship between ϕlow and
 $({m^\ast } + m_{a\textrm{0}}^\ast )\zeta$. This reiterates that it is
 $({m^\ast } + m_{a\textrm{0}}^\ast )\zeta$, not m*ζ, which intrinsically combines and reflects the mass-damping properties of the system. This relationship between ϕlow and
 $({m^\ast } + m_{a\textrm{0}}^\ast )\zeta$ can be obtained as
 \begin{equation}{\phi _{low}} =- 3.1{[({m^\ast } + \textrm{ }m_{a0}^\ast )\zeta ]^2} + 28.6({m^\ast } + \textrm{ }m_{a0}^\ast )\zeta .\end{equation}
This equation allows us to predict ϕlow using the value of  $({m^\ast } + m_{a\textrm{0}}^\ast )\zeta$. Parameter
 $m_{a\textrm{0}}^\ast= 1.5$ for a square cylinder with zero incidence angle (Chen et al. Reference Chen, Alam and Zhou2020). As long as m* and ζ are provided, we can obtain the phase lag ϕlow between the low-pass-filtered CL and Y* at the onset of galloping.
Effect of (a) mass ratio m*, (b) damping ratio ζ, (c) m*ζ and (d)  $({m^\ast } + m_{ae}^\ast )\zeta$ on phase lag ϕlow at the galloping onset. Here, Re = 170.

Effect of combined mass-damping parameter  $({m^\ast } + m_{a0}^\ast )\zeta $ on phase lag ϕlow at the galloping onset. Here, Re = 170.

As discussed with figure 19, the Urc data points collapse well on  $({m^\ast } + m_{ae}^\ast )\zeta$ at m* ≥ 5, where the influence of ϕlow is significantly greater and Urc is mainly determined by ϕlow. At m* = 3, however, Urc is influenced by both the competition and the magnitude of ϕlow. As a result, Urc at m* = 3 deviates from the fitting curve. The competition affects Urc at m* = 5 to some degree, where Urc at m* = 5 is 13, that is, slightly larger than 12 at m* ≥ 10. However, the influence of ϕlow on Urc at m* = 5 is greater than that at m* = 3. Particularly, at
 $({m^\ast } + m_{ae}^\ast )\zeta > 0.55$, Urc is largely determined by ϕlow, so that the Urc data points fit well on a line at m* ≥ 5 and
 $({m^\ast } + m_{ae}^\ast )\zeta > 0.55$ (figure 19a). At
 $({m^\ast } + m_{ae}^\ast )\zeta \le 0.55$, however, the Urc data points at m* ≥ 5 all lie above the fitted curve for
 $({m^\ast } + m_{ae}^\ast )\zeta > 0.55$ (figure 19b), as ϕlow at
 $({m^\ast } + m_{ae}^\ast )\zeta \le 0.55$ is not large enough to curb the mode competition.
4. Conclusions
Flow-induced vibrations of a square cylinder with mass ratio m* = 2–30, damping ratio ζ = 0–1.0 and mass-damping ratio m*ζ = 0–50 are numerically investigated. The investigation covers five aspects: (i) effect of m* on the vibration response, forces and frequency response, (ii) roles of effective added mass  $m_{ae}^\ast $ in different vibration branches, (iii) characteristic changes at the borders between different branches, (iv) combined effect of m* and ζ on critical reduced velocity Urc and phase lag ϕlow for galloping onset and (v) underlying mechanisms of the influences of m* and ζ on galloping.
The effect of m* is investigated on vibration responses, frequency responses, forces and effective added-mass ratio. An increase in m* reduces Ur range of VIVs and advances the galloping onset. Parameter m* has distinct influences in IB, LB and GB regimes. In IB, a larger m* leads to a smaller A*,  ${C^{\prime}_L}$ and
 ${C^{\prime}_{La0}}$, but a larger St,
 ${\bar{C}_D}$ and
 ${C^{\prime}_{Lf}}$. In LB, a larger m* corresponds to a smaller A*, St,
 ${\bar{C}_D}$,
 ${C^{\prime}_{La0}}$ and
 ${C^{\prime}_{Lf}}$, but a larger
 ${C^{\prime}_L}$. On the other hand, in the GB regime, an increasing m* enhances A*, fr,
 ${\bar{C}_D}$,
 ${C^{\prime}_L}$ and
 ${C^{\prime}_{Lf}}$, but reduces St,
 ${C^{\prime}_{La0}}$, fs/fo and its gradient with Ur.
The effective added-mass ratio ( $m_{ae}^\ast $) characterizes different vibration branches, being contingent on Ur and m*. The value of
 $m_{ae}^\ast $ in IB is positive and declines parabolically with Ur, which results from the fact that fr being <1.0 approaches 1.0. The value of
 $m_{ae}^\ast $ in LB is negative and further declines because fr being >1.0 shifts away from 1.0. A larger m* yields a greater
 $m_{ae}^\ast $ magnitude in both IB and LB. In GB,
 $m_{ae}^\ast $ is positive and decreases with increasing Ur. On the other hand,
 $m_{ae\textrm{s}}^\ast $ is negative, yet decreasing with Ur. A larger m* corresponds to a smaller
 $m_{ae}^\ast $ and
 $m_{ae\textrm{s}}^\ast $ while the effect of m* on
 $m_{ae\textrm{s}}^\ast $ is greater than that on
 $m_{ae}^\ast $.
It is challenging to distinguish the different vibration branches. Here, several techniques are remarked upon for identifying the borders between different branches. The IB–LB boundary can be identified from the change in  $m_{ae}^\ast $ from +ve to −ve, jumps in St, ϕ and fr or a dramatic drop in
 ${C^{\prime}_L}$. On the other hand, the LB–GB boundary can be pinpointed from the change in
 $m_{ae}^\ast $ from −ve to +ve, and a jump in
 ${C^{\prime}_L}$ or a drop in fr.
Vibration responses undergo beating, which is linked to the difference between fs and 3fo or 5fo, with a beating frequency of |fs − 3fo| or |fs − 5fo|. The beating amplitude in Y* or CL grows when fs/fo approaches fs/fo = 3 or 5 but declines when fs/fo departs from fs/fo = 3 or 5. The beating phenomenon of a square cylinder in GB is derived from the modulation between fs and (2n + 1)fo, where n = 1, 2, …, not directly caused by the difference between fs and fo.
Effects of m*, ζ, m*ζ,  $({m^\ast } + m_{a\textrm{0}}^\ast )\zeta$ and
 $({m^\ast } + m_{ae}^\ast )\zeta$ on Urc and ϕlow for galloping onset are revealed at Ur = 1–80. Parameter m* has a negligible influence on Urc for ζ ≤ 0.01. This is, nevertheless, not the case for ζ > 0.01 where Urc adjourns with increasing m* and/or ζ. The competition between vortex shedding associated with low-frequency vibration (SM) and high-frequency vibration (WM) determines Urc at low m* (= 3) as does ϕlow at a large m* ≥ 5. Term
 $({m^\ast } + m_{a\textrm{0}}^\ast )\zeta$ successfully collapses all ϕlow data on a line for all m* and ζ values, with a quadratic polynomial relationship between ϕlow and
 $({m^\ast } + m_{a\textrm{0}}^\ast )\zeta$. Similarly, Urc data fit well on
 $({m^\ast } + m_{ae}^\ast )\zeta$ at m* ≥ 5, where Urc grows linearly with increasing
 $({m^\ast } + m_{ae}^\ast )\zeta$. Term m*ζ as well as
 $({m^\ast } + m_{a\textrm{0}}^\ast )\zeta$ or
 $({m^\ast } + {C_A})\zeta$ does not serve well to characterize a fluid–structure system. We introduce a combined mass-damping parameter
 $({m^\ast } + m_{ae}^\ast )\zeta$ that serves as the unique criterion to predict the galloping onset. This indicates that
 $({m^\ast } + m_{ae}^\ast )\zeta$ works well to represent the property of a fluid–structure system.
Acknowledgements
The authors wish to acknowledge the support given by the National Natural Science Foundation of China through grant 11672096 and by the Research Grant Council of Shenzhen Government through grant JCYJ20180306171921088.
Declaration of interests
The authors report no conflict of interest.



