Recent literature has emphasized the pivotal role of the environment in shaping human development and social interactions. An important aspect of this relationship concerns the effects of extreme weather events, which can be a key source of economic disruption. This research examines the relationship between such shocks and local civil conflict in the context of pre-Industrial Europe over the years 900 to 1800. I first combine annual data on the local intensity of droughts and floods for 673 European cities with information on conflict to show that more severe droughts are associated with the outbreak of a local rebellion or civil disturbance. However, this relationship is attenuated among cities with participative governments, in the form of a commune or city council, during this 900-year time period. I then use an alternative sample of 324 cities within the Holy Roman Empire (HRE) to show that different forms of participative governance vary in their effectiveness in reducing drought-induced instability: city governments based in whole or in part on elections are significantly more effective in mitigating conflict than those based on representation by burghers or guilds.
Specifically, I find that a one-unit increase in drought severity, as measured by the Palmer Drought Severity Index (PDSI), is associated with a 0.06 percentage point increase in the probability of a civil disturbance (alternatively, a one standard deviation increase in drought severity is associated with a 0.02 s.d. increase in conflict probability). However, I show that the drought-conflict relationship exhibits nonlinearities, with disproportionately greater increases in the probability of a civil conflict with droughts in the upper tail of the severity distribution. In particular, a city experiencing an “extreme” drought, according to the PDSI classification scheme, would witness a 0.35 percentage point increase in the probability of conflict outbreak relative to cities experiencing normal conditions. I argue that such findings could be due to increases in food prices, as a one-unit increase in drought severity is also associated with a 1 percentage point increase in the local price of wheat. I find little evidence that flooding is associated with such conflict, and cities experiencing abnormally severe floods appear marginally less likely to witness unrest.
Importantly, the effect of drought severity on the outbreak of civil unrest is reduced by approximately one-half in cities with participative governance. However, communes themselves are unsuccessful in reducing the length of such conflict should it occur, likely because the moderating effect of participative governance depends significantly on the characteristics of this local rule. Utilizing the alternative dataset on local governance for cities within the Holy Roman Empire, I show that elected city governments are highly effective in reducing both the onset of civil unrest and its duration. Governments based on burgher or guild representation, however, are ineffective in reducing this violence. I argue that such results are consistent with elected officials acting in the interests of the broader urban population by insulating the public from drought-induced shocks to food prices. In contrast, burgher and guild-based governments were likely concerned with the interests of a much narrower electorate and were less proactive in ensuring a stable food supply. Here, I obtain suggestive empirical evidence that elected governments successfully moderated these food price shocks, whereas the less representative forms of government did not temper such price increases and may have even exacerbated them.
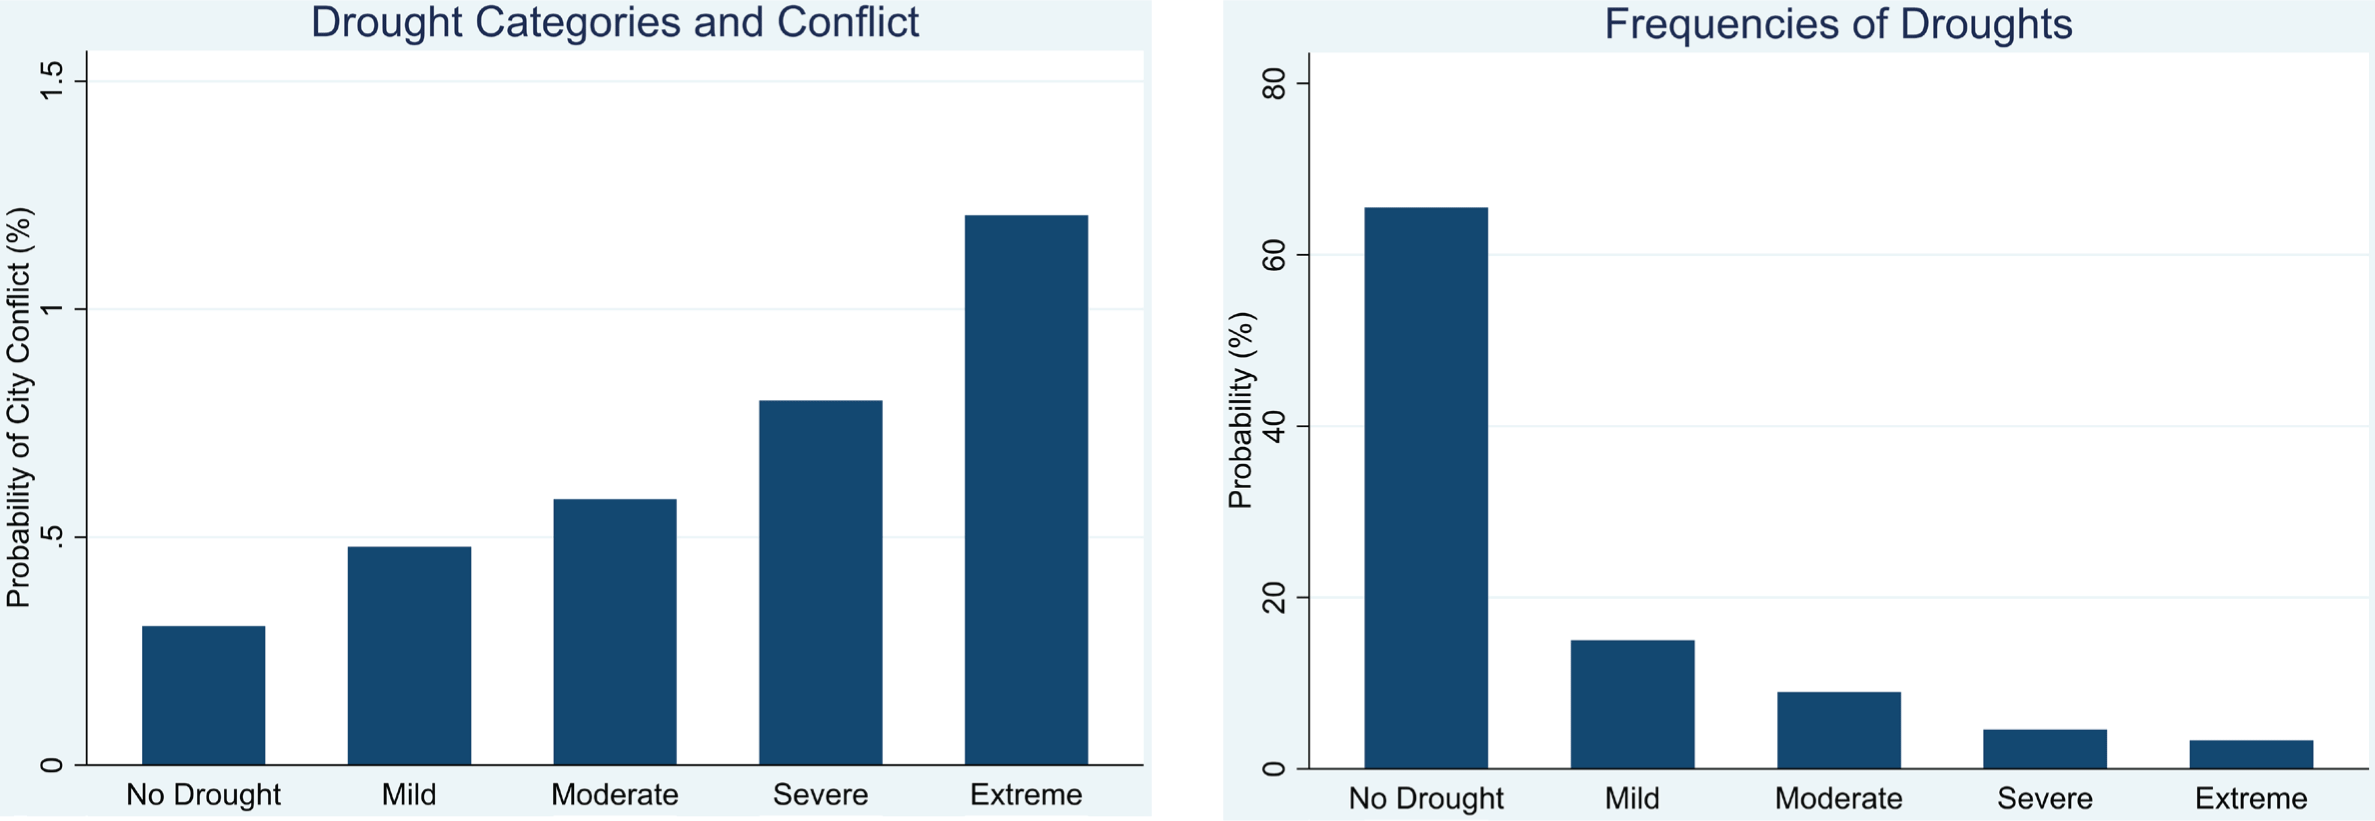
I argue that these findings are consistent with the importance of agriculture and the role of local government in pre-modern Europe. Throughout this period, agriculture constituted the dominant economic activity, but yields were generally low and production was vulnerable to adverse environmental shocks (Postan Reference Postan1973). The resulting famines often led to local violence (Renard Reference Renard1918). Figure 1 provides empirical evidence for this: While the most extreme droughts occurred relatively infrequently, it was during these years that the probability of conflict was highest. Yet this time period also coincided with a transformation in local governance. Across Europe, the merchant and urban middle classes assumed greater roles in city administration, and their rule was frequently more representative than the ecclesiastical and feudal authorities they replaced. Importantly, the legitimacy of these new authorities often rested on their ability to ensure an adequate food supply.
FREQUENCY OF DROUGHTS (LEFT) AND PROBABILITY OF CONFLICT DURING DROUGHTS (RIGHT)
Sources: Cook et al. (Reference Cook, Seager, Kushnir and Briffa2015), Brecke (Reference Brecke1999), and author’s calculations.

These changes in local administration first occurred in Northern Italy before spreading throughout Europe. Prior to the thirteenth century, most Italian cities were managed by a monarch-appointed official. The most common response to food shortages during this time involved banning the export of local grain. But higher urban populations in the North of the country during the late Middle Ages put pressure on food supplies, and such interventions were no longer sufficient to prevent famines. As the local merchant class began to assume more functions of city governance, there was a parallel rise in pro-active food provision policies (Dameron Reference Dameron2017). These new city councils included elected representatives who used public funds to purchase grain from outside the city, while simultaneously building larger granaries and other food storage facilities (Lantschner Reference Lantschner2022). As urbanization grew across Europe, these changes in local administration were replicated elsewhere. Importantly, these city governments were much more responsive to the needs of the local population than the previous forms of feudal administration.
The contribution of this paper is twofold. First, the quality of the data used in this study allows for a significantly more precise analysis of the relationship between environmental shocks and conflict. The drought and flood data, obtained from Cook et al. (Reference Cook, Seager, Kushnir and Briffa2015), are available at a highly dis-aggregated 0.5° spatial resolution (roughly 55km by 55km) for all of Europe. This information is also recorded on an annual basis over this 900-year time period, thus providing a relatively high frequency measure of environmental shocks given the long time horizon under consideration. Furthermore, the precision of the PDSI itself allows for an analysis of any potential non-linear effects of these weather patterns on civil disturbances. Finally, to match the precision of this environmental data, I compile a new dataset that identifies the specific cities in which a given civil conflict occurred. Here, I utilize the historical conflict database of Brecke (Reference Brecke1999), but I draw from a variety of secondary sources to code civil conflicts to the cities in which they originated.
The results of this study are consistent with the theoretical predictions of Grossman (Reference Grossman1991) and Hirshleifer (Reference Hirshleifer1995), who show that a population’s willingness to fight or rebel depends negatively on the income that can be generated from non-rebelling activities, such as home production. This paper also contributes to the literature on conflict in a historical context. For example, in pre-Industrial Europe cold, weather shocks have been associated with city-level Jewish persecutions (Anderson, Johnson, and Koyama Reference Anderson, Johnson and Koyama2017), as well as large-scale conflict more generally (Iyigun, Nunn, and Qian Reference Iyigun, Nunn and Qian2017). Droughts were a key determinant of theft and property crime in nineteenth-century Germany due to higher food prices (Mehlum, Miguel, and Torvik Reference Mehlum, Miguel and Torvik2006). Droughts have also been shown to influence peasant revolts across Chinese prefectures from 1470 to 1900 (Jia Reference Jia2013), and conflicts among nomads and settled Han Chinese over the years 220 to 1839 (Bai and Kung Reference Bai and Kung2011).
A second contribution of this paper is to show how local governance can moderate the adverse social consequences of economic shocks. This study first explores the moderating effects of participative governance generally, using data from Bosker, Buringh, and van Zanden (Reference Bosker, Buringh and van Zanden2013). This dataset contains information on whether a city had any type of local self-rule during this time period. I then draw from the dataset of Wahl (Reference Wahl2016, Reference Wahl2019) to assess the effectiveness of the three main types of city-level governance in reducing drought-induced conflict: that is, representation via elections, burghers, or guilds. Importantly, these three forms of participative governance constituted the universe of possible types over this period, with significant differences in the democratic extent of each. Hence, a key finding of this paper is that regimes with a greater degree of democratic legitimacy are advantageous for social stability, likely because they are more responsive to the needs of the general population.
Such results contribute to our understanding of how governance and social norms can affect the ways in which a population reacts to adverse economic shocks. This is a subject that has received significant attention in the area of historical political economy. For example, Kung and Ma (Reference Kung and Ma2014) show that Chinese regions with stronger Confucian norms were less likely to experience peasant rebellions in response to crop failures. Belloc, Drago, and Galbiati (Reference Belloc, Drago and Galbiati2016) argue that religious leaders, as opposed to secular authorities, were better able to restore order within medieval Italian cities after Earthquakes: The occurrence of such earthquakes subsequently inhibited the transition of such cities to secular self-rule. Finally, Chaney (Reference Chaney2013) obtains evidence that historical Egyptian rulers mitigated the probability of rebellion due to Nile flooding by increasing allocations to religious structures over the years 641 to 1438, as religious authorities were instrumental in their ability to encourage or discourage popular revolts. Importantly, in the context of pre-Industrial Europe, the mechanism through which elected city governments reduced the probability of civil disturbances appears to be through their moderation of food price shocks.
Finally, it is important to note that the time frame under consideration is generally regarded as a consequential period for Europe’s economic, social, and political development. Van Zanden (2009) argues that the roots of the Industrial Revolution were due to institutional changes over the 900–1300 time period, as this era coincided with the development of efficient institutions, including merchant guilds, which promoted the economic development and human capital accumulation that would later be necessary for industrialization. The rise of such institutions was also crucial for religious and social toleration: Here, more impersonal and inclusive institutions replaced those that relied on religious legitimation, which frequently entailed minority persecutions (Johnson and Koyama Reference Johnson and Koyama2019). While the focus of this research is on city-level forms of governance and administration, these local institutions were likely important for the development of national governance throughout Europe. For example, in the context of Great Britain, Angelucci, Meraglia, and Voigtländer (Reference Angelucci, Meraglia and Voigtländer2022) provide empirical support for this relationship by showing that medieval merchant towns, which obtained the right to self-administer tax collection were more likely to elect inclusive public officials, and were later more likely to support Parliament during Britain’s civil war in 1642, as well as to support the extension of the franchise via the Great Reform Act of 1832.
LOCAL GOVERNANCE AND FOOD PROVISION IN PRE-MODERN EUROPE
The first formalized systems of city administration and local autonomy in Europe were introduced by the Romans, although these institutions did not survive the collapse of their empire. Prior to the twelfth century, ecclesiastical authorities assumed most city-level administrative duties, including the provision and maintenance of infrastructure, toll collection, and market supervision (Pirenne Reference Pirenne1925). By the twelfth century, rising European trade and an expanding urban population resulted in merchants and other city elites assuming some functions of city governance. The acquisition of this autonomy was a gradual process that differed by city and involved balancing the interests of the local elite, church authorities, feudal lords, and representatives of the monarch (Le Galés Reference Galés2002). Importantly, food provision was a crucial function of early municipal governments, with local authorities first acquiring this responsibility from Bishops among cities in Tuscany in the early twelfth century (Dameron Reference Dameron2017).
More generally, city officials were frequently tasked with ensuring a stable food supply, and regularly employed different methods to insulate the urban population from price shocks. These local interventions became commonplace throughout Europe in the medieval period (Persson Reference Persson1999). For example, in the twelfth century, the city of Bologna acquired and operated public grain mills, while in Florence and Milan, local authorities utilized public funds to buy grain from outside the city (Dameron Reference Dameron2017). Further north, the city of Douai rationed the sale of grain during shortages in the thirteenth century (Daviron, Perrin, and Soulard Reference Daviron, Perrin, Soulard, Aubry, Duchemin and Nasr2019), while authorities in Lille set prices during shortages in 1436 and 1439 (Ewert, Roehl, and Uhrmacher Reference Ewert, Roehl and Uhrmacher2007). Notably, more centralized administration of food provision appears to have been less effective than when such policies were administered at the city-level: For example, when the French crown supplanted local authority over such policies in the late seventeenth century, food riots soon followed in Rouen, Lyon, Paris, and Abbeville over rising prices (Tilly Reference Tilly1971).
There is suggestive evidence that more representative forms of local government were the most successful in moderating price shocks and food shortages. Merchants would frequently profit from rising prices by keeping grain stocks off the market and releasing them in limited quantities, which could exacerbate food crises (Daviron, Perrin, and Soulard Reference Daviron, Perrin, Soulard, Aubry, Duchemin and Nasr2019). These were often guild merchants, who resisted any attempt to regulate trade and production in their areas of interest. Yet city councils were apt to intervene in guild affairs when the well-being of the urban population was involved, especially in regard to food production and distribution (Renard Reference Renard1918). Institutions representing the urban population thus served as an important counter-weight to those who had an incentive to profit from food crises. This seems to have been the case regardless of guild presence: In his study of early Italian communes, Dameron (Reference Dameron2017) finds that the most advanced and successful policies to combat food shortages occurred in those cities where the common people (popolo) held power in the local commune.
Nevertheless, the extent to which the broader public was represented in these city governments varied considerably. In general, representative institutions were curtailed in areas where the forces of feudalism were strongest. In some cases, this was due to a lack of a merchant or urban professional class. In others, the physical presence of a monarch, prince, or high ecclesiastical authority led to more limited local autonomy (Pounds Reference Pounds2005). The analysis described later uses data on city governance from the Holy Roman Empire, where most towns had some type of council; however, the presence of a more powerful prince or bishop meant that these members were not elected, but chosen by the resident secular or religious authority (Wahl Reference Wahl2016).
In contrast, representative government tended to arise in cities with a larger merchant class or urban population (Bartlett Reference Bartlett1993). In the context of the HRE, these cities gained representative self-government in different ways: Sometimes it was granted by the emperor, a prince, or an archbishop. In other cases, it was purchased by city authorities themselves. Occasionally, it was gained by the extinction of a ruling feudal family (Holland Reference Holland and Chisholm1911). In many of these cases, local governance remained oligarchical, and not all citizens were allowed to vote. Agitation for the franchise was typically stronger in cities with a larger urbanized population, as this social class did not fit easily into the feudal order (Downing Reference Downing1989). Importantly, these skilled urban workers provided an important source of tax and toll revenue, and the fiscal benefits of these urban markets often persuaded feudal authorities to grant greater political rights to the citizens of these new market towns (Blockmans Reference Blockmans, Lucassen and Willems2012).
DATA
The PDSI
I use the PDSI developed by Palmer (Reference Palmer1965) to quantify the magnitude of local droughts and floods. This index provides a quantitative measure of the relative wetness or dryness of the soil in a given area based on the extent to which moisture deviates from a climatological normal. Technically, the PDSI is unbounded, but values generally fall within the interval [–10, +10]. Negative values indicate a drought, while positive numbers signify flooding: Larger magnitudes of the PDSI denote a more severe drought or flood. For this study, I obtained PDSI data calculated on an annual basis over the past two millennia by Cook et al. (Reference Cook, Seager, Kushnir and Briffa2015), who calculated these indices at a 0.5° spatial resolution (roughly 55km by 55km) for Europe and parts of the Middle East from the year 0 to 2012. To produce these maps, the authors first model the effects of hydrological conditions on contemporary tree growth, and then apply this model to tree rings from sub-fossilized and preserved specimens to reconstruct annual PDSIs. Note that the number of tree specimens used for these reconstructions tends to be relatively large, which is necessary for the index’s level of disaggregation. For example, within Germany, the authors obtain 10,453 tree ring chronologies, with each tree providing roughly 100 years of usable data. A full description of their methodology can be found in Cook et al. (Reference Cook, Seager, Kushnir and Briffa2015).
The PDSI reflects spring and summer moisture conditions, including moisture due to spring snowmelt, and accounts for precipitation through August. In general, this timeframe aligns with the growing season for most cereal crops, although these seasons do vary by latitude within Europe. In the north, the primary harvest tends to take place in August or September (McCloskey and Nash Reference McCloskey and Nash1984), while in the south, this usually occurs in July (although in the southern extremities of Greece and Spain, it occurs in June) (Manning et al. Reference Manning, Kromer, Cremaschi and Dee2020). Despite this heterogeneity in growing seasons, Cook et al. (Reference Cook, Seager, Kushnir and Briffa2015) note that, regardless of latitude, the PDSI is consistent with historical records of droughts, floods, and the resulting food shortages. Here, the authors find that droughts, as identified by annual values of the PDSI, correspond to written records of droughts and famines in Turkey and Greece in the sixteenth and seventeenth centuries. The index also reflects droughts that led to poor cereal harvests in the Czech Republic in the sixteenth century, and in England and Wales in the eleventh through fourteenth centuries. Such findings are consistent with the nature of food production in Europe during this time period: agricultural technology was fairly primitive, and crops remained highly vulnerable to droughts and other environmental shocks (Postan Reference Postan1973).
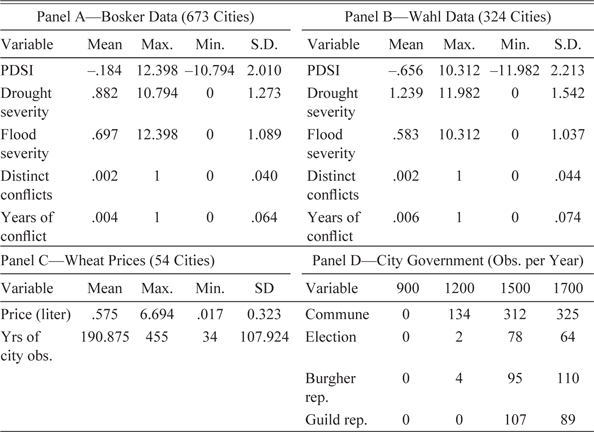
Finally, it is important to note that the PDSI quantifies droughts and floods relative to an area’s existing climate and provides a cumulative metric of soil moisture. That is, the PDSI is based on a recursive formula in which the severity of current droughts or floods is based on the PDSI from the previous period, as well as contemporaneous moisture accumulation. Importantly, this eases the econometric analysis since any interactive effects between contemporary and lagged droughts or floods are already incorporated into the index. Note that to assign PDSI values to cities, I use the PDSI of the grid cell in which a city is located. Additionally, as the coordinates for this data are measured in degrees, I project this map to a flat surface using a cylindrical equal area projection, which minimizes distortions to the areas of these grid cells as they are transformed from a round surface (the Earth) to a flat one. Summary statistics for the PDSI are given in Table 1 (Panel A displays these for Bosker’s sample of cities, while Panel B does so for Wahl’s). Finally, Figure 2 provides a visualization of the PDSI for the year 1300, which includes the locations of the Bosker and Wahl cities, which are described in more detail.
SUMMARY STATISTICS

Sources: Brecke (Reference Brecke1999) Cook et al. (Reference Cook, Seager, Kushnir and Briffa2015), Bosker, Buringh, and van Zanden (Reference Bosker, Buringh and van Zanden2013), Wahl (Reference Wahl2016), and Allen and Unger (Reference Allen and Unger2019).
SPATIAL DISTRIBUTION OF PDSI IN YEAR 1300 WITH CITIES IN BOSKER DATASET (LEFT) AND WAHL DATASET (RIGHT)
Sources: Bosker, Buringh, and van Zanden (Reference Bosker, Buringh and van Zanden2013), Wahl (Reference Wahl2016), and Cook et al. (Reference Cook, Seager, Kushnir and Briffa2015).

CONFLICT DATA AND CODING CITY-LEVEL CONFLICTS
My primary source of information on European conflicts is from Brecke (Reference Brecke1999), which I supplement with data from Bradbury (Reference Bradbury2004). Brecke’s database contains information on European conflicts from 900 to the near present and includes data on the year, location, belligerents, and type of conflict (e.g., whether it is civil or interstate). Here, conflicts are classified as civil if they occur within a political entity that possesses effective sovereignty: Inter-state conflicts are those between such entities. To be included in this database, the conflict must have resulted in 30 or more casualties. Large-scale conflicts, such as the Hundred Years’ War or the Thirty Years’ War, are typically broken down into major battles or campaigns. Similar information is included in Bradbury, although this dataset extends back to Roman times and is slightly narrower in scope, with a greater focus on large-scale conflict rather than smaller rebellions. When information on the originating cities of these conflicts is not given, I rely on secondary sources to identify where these civil disturbances occurred. These are either general social histories or sources on more specific regions and time periods. Importantly, conflicts are only included in this analysis if their origin can be traced to the specific cities from which they originated.
Note that not all conflicts classified as civil can be attributed to specific cities. This is frequently the case with dynastic disputes, where the belligerents might control entire regions or attempt to secure their rule of a country by launching an invasion from outside of it. On the other hand, some interstate conflicts included city-level rebellions as part of the broader war. For these reasons, I evaluate every conflict in the Brecke database (both civil and interstate) to assess whether it included any city-level civil conflict, including fighting within a city or conflicts between the local and national authorities. Note that I code these conflicts as civil even if a national authority had de jure rather than de facto authority over a given city. This is mostly relevant to the Holy Roman Empire, where Free Imperial Cities were nominally subordinate to the emperor, but in practice acted much like sovereign entities. Thus, I categorize conflicts between such cities and the emperor as civil, but conflicts between these cities and other nations are not. In Tables A5 and A6 of the Online Appendix, I examine the sensitivity of the main results to different coding schemes by omitting civil conflicts that occurred as part of an interstate war, as well as omitting rebellions in cities under Ottoman rule and in the Holy Roman Empire (the latter being notoriously decentralized). The main results presented later are robust to these checks.
LOCAL GOVERNANCE
I obtain information on city-level governance from two sources. The first is from Bosker, Buringh, and van Zanden (Reference Bosker, Buringh and van Zanden2013), who collect information on the characteristics of 729 cities in Europe, North Africa, and the Middle East over the years 800 to 1800. This dataset contains information on city-level geography, population, and religion, among other variables. Importantly, this dataset also contains an indicator variable for whether a city contained any participative administration, such as a commune or a city council. Unfortunately, the historical record cannot provide an exact year in which this occurred; therefore, the authors record the closest whole century in which the commune came into existence. That is, observations here are recorded for the years 900, 1000, 1100, and so on. Using the conflict data described previously, I obtain 963 distinct conflicts (or 2,475 conflict-years) for 673 European cities in this dataset. Summary statistics for droughts, conflict, and governance in this dataset are given in Panels A and D of Table 1.
While the Bosker dataset does not record the democratic extent of local governance, such information is available in an alternative dataset compiled by Wahl (Reference Wahl2016, Reference Wahl2019). This dataset contains information on government for 324 cities in the Holy Roman Empire (most of which lie within the modern borders of Germany and Austria, with others located in Poland, Belgium, the Netherlands, and France). Variables here include indicators for whether governance included elections (in which all male citizens of the city could vote), burgher representation (in which a narrower class of designated citizens could participate in government), or a city council with guild representation. Importantly, these three types of representation constituted the universe of possible forms of local participative governance over this time period (Wahl Reference Wahl2019). Most cities in this dataset are distinct from those in Bosker, with 112 cities common to both. Like the Bosker dataset, Wahl identifies the nearest century in which a given type of participative administration began. Here, I obtain 572 distinct conflicts (or 1,615 conflict-years) for the 324 cities in this dataset. Summary statistics for cities in the Wahl sample are given in Panels B and D of Table 1.
Note that the latter types of local governance differ significantly in their democratic extent. For example, cities holding elections typically allowed male citizens to elect all or parts of a local government, either directly or indirectly through a community assembly or electoral college. This contrasts with burgher representation, in which the right to participate in local politics was limited to members of the local elite; hence, a defining characteristic of this representation is that it was limited to a narrower class of the citizenry. Guilds, or associations of artisans and merchants, could also be granted political rights, although guild membership was only open to a privileged minority due to the high fees and substantial experience required for entry (Ogilvie Reference Ogilvie2014). For this reason, comparing the extent of representativeness between guild and burgher participation is somewhat difficult and may have varied by city. Notably, citizenship of a given city was normally a necessary but not sufficient requirement for guild membership or burgher status. Cities with elections were thus the most representative of these three types, in that only citizenship was required for enfranchisement.
Consistent with the earlier discussion, there is anecdotal evidence that more representative city governments in the HRE were the most proactive in ensuring a stable food supply. In the fifteenth century, Nuremburg had an elected city government, and during this time, it maintained some of the largest publicly-held grain stocks within the HRE. Local authorities would release these stocks in limited amounts to help mitigate price shocks. Similarly, in 1430, Cologne built a public granary soon after it adopted an elected city council (Keene Reference Keene1998). During this time, records show that the elected governments of Munster, Dortmund, and Cologne sought to utilize the common grounds of the surrounding countryside to help ensure an adequate food supply for their urban populations. This brought them into conflict with the clergy and other oligarchic families who attempted to convert this land into private property, sometimes via enclosure (Schilling Reference Schilling1998). Such policies were not limited to the large mercantile cities, but were present in smaller towns as well. For example, the (elected) city council of Biberach in southern Germany fought a protracted legal dispute with feudal lords over fishing rights in the surrounding rivers (Schlag Reference Schlag2024).
A final aspect of the Bosker and Wahl datasets concerns the selection criteria for these samples. Bosker’s data consists of all cities that, at some point over the 800- to 1800-time frame, reached a size of 10,000 or more inhabitants. Any analysis using this sample thus represents a relationship between climate shocks, governance, and conflict among relatively large cities. Wahl compiles his sample based on information from multiple sources, but primarily from the Deutsch Stadtbuch (German Handbook of Cities) (Wahl Reference Wahl2016). This sample contains both larger and smaller population centers, but may be more susceptible to survival bias, in that only those cities that retained their population over time are included. Unfortunately, the extent of this bias cannot be known with certainty. However, as noted in Wahl (Reference Wahl2016, Reference Wahl2019), the Deutsch Stadtbuch is a uniquely comprehensive and complete source of historical, city-level data and is well-suited for this type of analysis. A visualization of Wahl’s data is provided in the Online Appendix in Figures A3, A4, and A5, which show the locations of those cities that at some point, contained an elected government, burgher representation, or guild representation.
LOCAL WHEAT PRICES
Related literature suggests that food prices may constitute an important channel through which environmental shocks influence conflict. To examine this hypothesis, I use data from the Allen-Unger Global Commodity Prices Database (Allen and Unger Reference Allen and Unger2019), which contains information on city-level commodity prices from the Middle Ages until the near present. In this database, wheat prices have the widest spatial and temporal coverage. Such prices are available for 54 cities in the Bosker dataset, although this information is limited to sub-periods of the 900–1800 time frame. However, these wheat prices are standardized, measured in real terms, and are calculated on a per-liter basis. The first year for which such prices are recorded is 1316 (for the British city of Exeter). In general, most price data cover the sixteenth, seventeenth, and eighteenth centuries, although some series extend to the fourteenth and fifteenth centuries. Summary statistics for this price data, as well as summary statistics for the number of city-year observations, are shown in Panel C of Table 1.
EMPIRICAL STRATEGY
Droughts, Floods, and Conflict in Pre-Industrial Europe
To quantify the effect of local droughts and floods on city conflict, I utilize the following empirical strategy. First, I create a variable (denoted “drought severity”) that is equal to the negated value of the PDSI if the PDSI is less than zero (i.e., if there is a drought), and is equal to zero if the PDSI is greater than zero (which occurs when a city faces flooding or wet conditions). In this case, I negate the value of the PDSI when it is less than zero for ease of interpretation: That is, so an increase in this measure is associated with an increase in the severity of a drought. This variable ranges from zero to 10.8 for cities in the Bosker and Wahl samples. I create an analogous variable for floods (“Flood Severity”) that is equal to the value of the PDSI if the index is greater than zero, and zero otherwise. Summary statistics for the drought and flood severity measures are given in Table 1 (In Panel A for Bosker’s data and in Panel B for Wahl’s). Finally, I measure conflict in two ways: With an indicator that takes a value of one for the start of a conflict in city i in year t (conflict onset), and with an indicator that takes a value of one for any year in which there is a conflict (conflict incidence). Note that the latter outcome can assess the extent to which civil disturbances may continue until conditions are again amenable for agriculture; that is, when the opportunity cost of engaging in conflict is sufficiently high.
Bosker’s dataset also contains a rich set of information on time-varying city-level characteristics recorded at the century level. These variables are described in Bosker, Buringh, and van Zanden (Reference Bosker, Buringh and van Zanden2013) and typically measure the political, religious, or economic importance of these urban areas. Including these characteristics as controls can help verify that any observed conflict is due to environmental shocks and not some other city-level trait. This may be especially important with some characteristics (such as integration into regional and international trade networks) that vary over time, but may also weaken the relationship between city-specific environmental shocks and conflict. Brief descriptions of these variables, as well as their summary statistics, are given in Table A1 of the Online Appendix. Like the commune variable, they are recorded at the century level.
It is also possible that some time-invariant city characteristics could have a differential impact on conflict depending on the time period. For example, advances in seafaring might mean that a coastal city would witness significantly more trading opportunities (and hence easier access to food) in the latter part of this time period than in the beginning. In general, several kinds of locational characteristics may have such effects, including whether a city is located on the coast, by a river, or on a historical Roman road (Bosker’s dataset also includes information on whether a city is located by a historical Roman hub, defined as the intersection of two or more Roman roads). A city’s suitability for agriculture is likely relevant in this analysis as well. The first three variables are recorded in the Bosker and Wahl datasets, while I estimate a city’s agricultural potential using data from Ramankutty et al. (Reference Ramankutty, Foley, Norman and McSweeney2002). Recent studies have also suggested that the local severity of the bubonic plague had important long-run effects on European development after the fourteenth century (Jedwab, Johnson, and Koyama Reference Jedwab, Johnson and Koyama2019, Reference Jedwab, Johnson and Koyama2022): However, given the relatively limited data on city-level mortality rates from the black death, I account for these effects with a robustness check in the Online Appendix (Table A16). I interact all other time-invariant characteristics listed previously with indicators for each century, and include these as controls in the main specifications.
Tables A2 and A3 in the Online Appendix report both summary statistics and the differences in these characteristics between commune and non-commune cities (for Bosker’s data) and between cities with the three types of representative government (for Wahl’s data). The differences in these time-invariant characteristics tend not to be significant among cities in Wahl’s dataset, although some of them are for Bosker’s. However, any effects of these geographic factors on conflict are likely accounted for via city-fixed effects, as well as their interactions with century indicators described earlier. In Table A17 of the Online Appendix, I show that the main conclusions of this paper hold when limiting the sample to only those cities that adopted a commune over this time period. Finally, Panel B of Online Appendix Table A2 reports differences between these four variables for cities in the Bosker and Wahl samples. When comparing these samples, those in Bosker’s dataset are more likely to be on a coast, river, or historical Roman road, and also have a higher suitability for agriculture. Such differences are probably because cities in Wahl’s sample are clustered in Central Europe, whereas Bosker’s cities have a much wider geographic scope.
The full estimating equation is thus:
 $$\begin{gathered}Conflic{t_i}_{,t} = \alpha {\text{ }} + {\beta _{\text{1}}}DSe{v_i}_{,t} + {\beta _{\text{2}}}FSe{v_i}_{,t} + \Omega Boske{r_i}_{,t} + {\theta _c}{{\mathbf{X}}_{\mathbf{i}}} + {\text{ }}{\delta _i} \\ + {\text{ }}{\tau _t} + {\varepsilon_{i,t}}, \\ \end{gathered}$$
where Conflict is an indicator variable for conflict onset or incidence in city i in year t, and DSev and FSev denote drought and flood severity, as defined previously. δ and τ are city- and year- fixed effects, respectively. Bosker denotes a vector of time-varying city-level controls, which is available for specifications utilizing Bosker’s data (but not Wahl’s). θ c X i denotes a vector of century indicators (θ c ), multiplied by the time-invariant controls described earlier (i.e., whether a city is located on the coast, by a river, on a historical Roman road, and the suitability of its soil for agriculture; for specifications using Bosker’s data I also include the indicator for whether the city is located by a historical Roman hub). β 1 and β 2 are the coefficients of interest. ε is the error term, which I calculate using the arbitrary clustering methodology of Colella et al. (Reference Colella, Lalive, Sakalli and Thoenig2019). This methodology accounts for both serial and spatial correlation in the error term, provided that the researcher can specify the general spatial and temporal extent of these correlations. Here, I follow the approach that Grosfeld, Sakalli, and Zhuravskaya (Reference Grosfeld, Sakalli and Zhuravskaya2020) utilize in their study of pogroms in Eastern Europe and use a spatial window of 100km. Given the long time horizon of this study, I chose a 50-year time window.
While this estimation strategy should well identify the general effects of droughts and floods on conflict, it is less well-suited for examining potential nonlinearities in this relationship. Such a relationship could be likely, as droughts seem to have a nonlinear impact on the contemporary production of common food crops, with more severe droughts resulting in disproportionately lower yields (Zipper, Qiu, and Kucharik Reference Zipper, Qiu and Kucharik2016). These effects appear to apply to wheat production as well (Piechl et al. Reference Piechl, Thober, Samaniego and Hansjürgens2021). In what follows, I therefore adopt a semi-parametric identification strategy similar to that of Deschênes and Greenstone (Reference Deschênes and Greenstone2011), and construct indicators for different drought and flood severities according to the PDSI classification scheme developed by Palmer (Reference Palmer1965). Here, I create indicator variables denoting a summer in which the PDSI is below –4 (an extreme drought), between –3 and –4 (a severe drought), between –2 and –3 (a moderate drought), or between –1 and –2 (a mild drought). I construct four additional indicator variables for positive ranges of these PDSI values, which would denote extreme, severe, moderate, and mild floods, respectively. Finally, I create an indicator for PDSI values that fall in between –1 and 1: This range includes “normal” conditions (–.5 to .5) as well as incipient droughts (–.5 to –1) and incipient floods (.5 to 1). I take PDSI values in these intervals to represent “near normal” conditions. Table A7 in the Online Appendix displays the frequencies with which these drought and flood severities occur in the Bosker and Wahl datasets.
An econometric equation for the empirical strategy is as follows:
 $$Conflic{t_i}_{,t} = \alpha + {\sum{_j}}{\zeta _j}PDS{I_{i,t,j}} + \Omega {\boldsymbol{Boske}}{r_i}_{,t} + {\theta _c}{{\boldsymbol{X}}_{\boldsymbol{i}}} + {\delta _i} + {\tau _t} + {\varepsilon_{i,t}},$$
where PDSI i,t,j is an indicator for whether a drought or flood of severity j occurred in year t in city i. ζ j are the coefficients of interest: Those associated with the indicators for more severe droughts or floods are hypothesized to be greater in magnitude than those for milder shocks. Note that those PDSI values that fall in the “near normal” range (–1 to 1) constitute the omitted category; hence, any increases in marginal conflict probability are relative to these normal conditions. All other variables are as defined previously. Finally, note that in the Online Appendix, I report specifications that utilize lagged values of the index (Table A8). These lags are typically significant, but given the high correlation between the contemporaneous and lagged values of the PDSI, I do not include these specifications in the main tables. Here, I also conduct a placebo test where I regress leads of the drought and flood severity variables on conflict (Online Appendix Table A15). These leads are mostly insignificant.
ASSESSING CHANNELS: WEATHER SHOCKS AND FOOD PRICES
To assess whether food prices may constitute a channel through which environmental shocks affect conflict, I utilize an econometric specification similar to that of Equation (1), except that the outcome variable is replaced with the log price of wheat. I also omit the time invariant city-specific characteristics interacted with century indicators (the θ c X i ) as most are dropped due to insufficient observations (there are no wheat price observations prior to the fourteenth century; even after this time period, some interaction terms are dropped due to collinearity caused by the relatively small number of wheat price observations through the sixteenth century). While the number of cities with wheat-price data is fairly small (54 total), the sample encompasses a large geographic range, with observations in England, France, the Low Countries, Germany, Poland, and Italy. Results from this specification can thus be reasonably interpreted as capturing the general impact of environmental shocks on wheat prices across Europe.
DROUGHTS, FLOODS, AND PARTICIPATIVE POLITICAL INSTITUTIONS
A key question in this framework is the extent to which participative governance may mitigate conflict caused by weather-induced economic shocks. Such a hypothesis can be tested econometrically using Equation (1) by adding interaction terms between the drought and flood severity variables and an indicator for whether a city contained a commune (with information on the latter available from the Bosker dataset). Thus, Equation (1) can be altered as follows:
 $$\begin{gathered}Conflict{_i}_{,t} = {\beta _{\text{3}}}DSe{v_i}_{,t} + {\beta _{\text{4}}}DSe{v_i}_{,t}*Co{m_i}_{,t} + {\beta _{\text{5}}}FSe{v_i}_{,t} + {\beta _{\text{6}}}FSe{v_i}_{,t} \\ *Com{_i}_{,t} + {\kappa _{\text{1}}}Co{m_i}_{,t} + \Omega {\boldsymbol{Boske}}{r_i}_{,t} + {\theta _c}{{\boldsymbol{X}}_{\boldsymbol{i}}} + {\delta _i} + {\tau _t} + {\varepsilon_{i,t}}, \\ \end{gathered}$$
where Com is an indicator variable for whether city i contained a commune. The coefficients β 4 and β 6 capture the interactive effect of droughts and floods on commune cities. A priori, one would probably expect these coefficients to be negative: While climate shocks may lead to conflict, this relationship could be weakened in cities with a greater degree of citizen involvement in local administration and food provision. Note that κ 1 measures the level effect of city communes on conflict. Overall, this specification is quite similar to those used in research utilizing two-way fixed effects models with staggered adoption, such as in Jia (Reference Jia2013) (where, in this case, treatment is the adoption of a commune).
A notable drawback with this empirical design concerns the possible endogeneity of the commune variable. This can manifest in the form of reverse causality between commune-based governance and conflict, in that the former not only determines the latter, but the reverse may also hold true. Additionally, there may be unobservable factors that affect the adoption of participative governance, leading to omitted variable bias. For these reasons, estimates for the effects of participative governance should not be interpreted as strictly causal in nature. Nevertheless, the quality of the underlying data can still highlight the general extent to which different forms of social organization may moderate the relationship between economic shocks and conflict. Given the precision of the data and the long time horizon of this study, such correlations can still reveal important relationships between environmental shocks, social organization, and human development over the long run.
While the extent of endogeneity cannot be known with certainty, I present suggestive evidence in the Online Appendix that it does not greatly affect the magnitudes or significance of the coefficients presented in the main results. Here, I conduct a robustness check where I regress an indicator for whether a city transitioned to commune-based governance in century t on the total number of conflicts in the preceding century (t – 1). In this check, I find no evidence that conflict is a significant predictor of commune adoption. Note that such a strategy cannot rule out the existence of endogeneity altogether. Thus, as an added check, I omit all observations in the century prior to a city’s transition to a participative local government: That is, if conflicts determine self-rule, such conflicts would likely occur around the time a commune was adopted; that is, in the years excluded. I also omit observations 50 years prior to and 50 years after this transition. This strategy also helps mitigate problems caused by the fuzzy timing of a commune’s existence, since a city almost certainly did (or did not) have a commune in years outside of these bounds. These results are presented in Online Appendix Tables A10, A11, and A12. Importantly, in each robustness check, I find that results are nearly identical to those obtained in the baseline specifications presented next.
ASSESSING THE IMPACT OF DIFFERENT FORMS OF PARTICIPATIVE GOVERNANCE
To examine the relative effectiveness of the three forms of participative governance in mitigating conflict due to droughts and floods, I include a specification with interaction terms between each type of governance and the drought and flood severity variables:
 $$\begin{gathered}Conflic{t_i}_{,t} = \alpha {\text{ }} + {\beta _{\text{7}}}DSe{v_i}_{,t} + {\text{ }}\sum {_g{\sigma _g}Go{v_g}_{,i,t}} *DSe{v_i}_{,t} + {\beta _{\text{8}}}FSe{v_i}_{,t} \\ + \sum {_g{\eta _g}FSe{v_i}_{,t}*Go{v_g}_{,i,t}} + {\text{ }}\sum {_g{\mu _g}Go{v_g}_{,i,t} + {\theta _c}{{\boldsymbol{X}}_{\boldsymbol{i}}} + {\text{ }}{\delta _i} + {\text{ }}{\tau _t} + {\varepsilon_{i,t}}} , \\ \end{gathered}$$
where Gov g,i,t is an indicator denoting whether a city has a government of type g (an elected government, burgher representation, or guild representation) in city i in year t. Here, σ g captures the interactive effects between drought severity and these local governments, while η g does the same for flood severity. Note that µ g quantifies the level effects of each of these types of city governments on local conflict (cities with no participative governance constitute the omitted category). As discussed previously, endogeneity and the unclear timing of the transition to participative governance may present confounding factors in this specification. Therefore, I conduct the same robustness checks described earlier using the Wahl data: That is, I regress an indicator for a city’s transition to a government of type g on the aggregate number of conflicts in the preceding century, and I omit observations for those years surrounding the transition of the city into one of these modes of governance. As before, the former test does not suggest a high degree of endogeneity, while estimates are essentially unchanged in both magnitude and significance in the specifications that omit years near the transition.
RESULTS
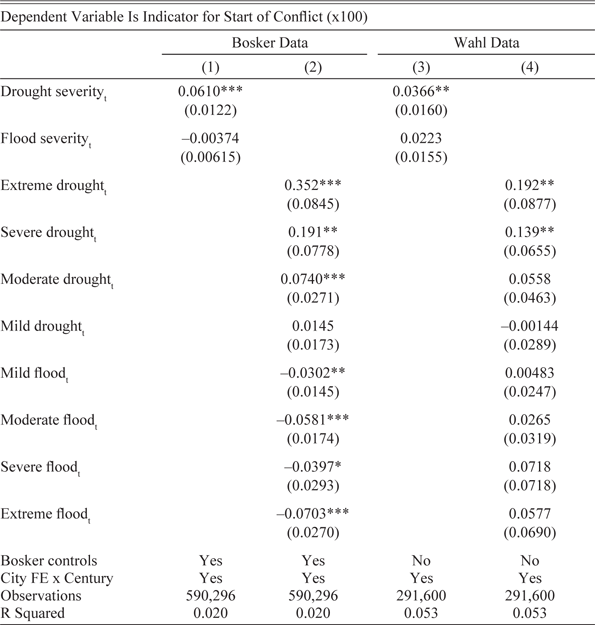
Table 2 presents the results from specifications one and two using the Bosker and Wahl datasets (the code and replication data for all results presented here is available from Wigton-Jones (2024)). Note that in all of the tables that follow, the indicators for conflict are multiplied by 100, so that coefficients can be interpreted as percentage points. The coefficient in Column (1) would suggest that a one-unit increase in drought severity is associated with a 0.06 percentage point increase in the probability of conflict outbreak for cities contained in the Bosker dataset (alternatively, a one standard deviation increase in drought severity is associated with a 0.02 standard deviation increase in conflict probability). Interestingly, a unit increase in flood severity is associated with a very small decrease in the probability of a conflict outbreak, and the effect is not significant.
IMPACT OF DROUGHT AND FLOOD SEVERITIES ON CITY-LEVEL CONFLICT

Notes: Standard errors calculated using the arbitrary clustering methodology of Colella et al. (Reference Colella, Lalive, Sakalli and Thoenig2019). *** p<0.01, ** p<0.05, * p<0.1. All regressions include city and year fixed effects. Time-invariant city characteristics (“City FE”) include indicators for a city location by the sea, a river, a Roman road, as well as agricultural suitability (and location by a Roman hub for cities in Bosker’s data).
Sources: Author’s calculations based on Brecke (Reference Brecke1999), Cook et al. (Reference Cook, Seager, Kushnir and Briffa2015), Bosker, Buringh, and van Zanden (Reference Bosker, Buringh and van Zanden2013), and Wahl (Reference Wahl2016).
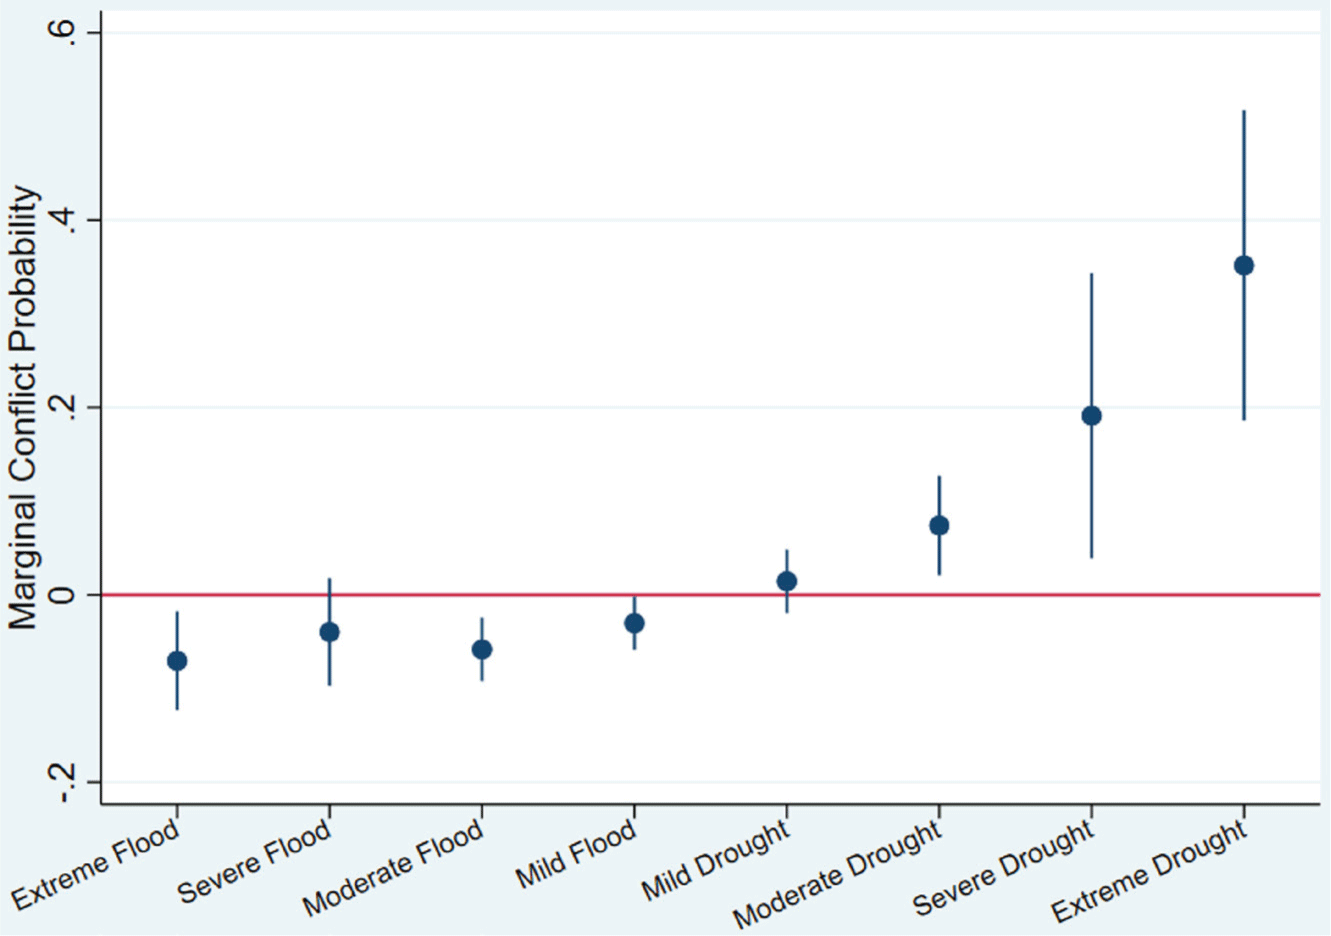
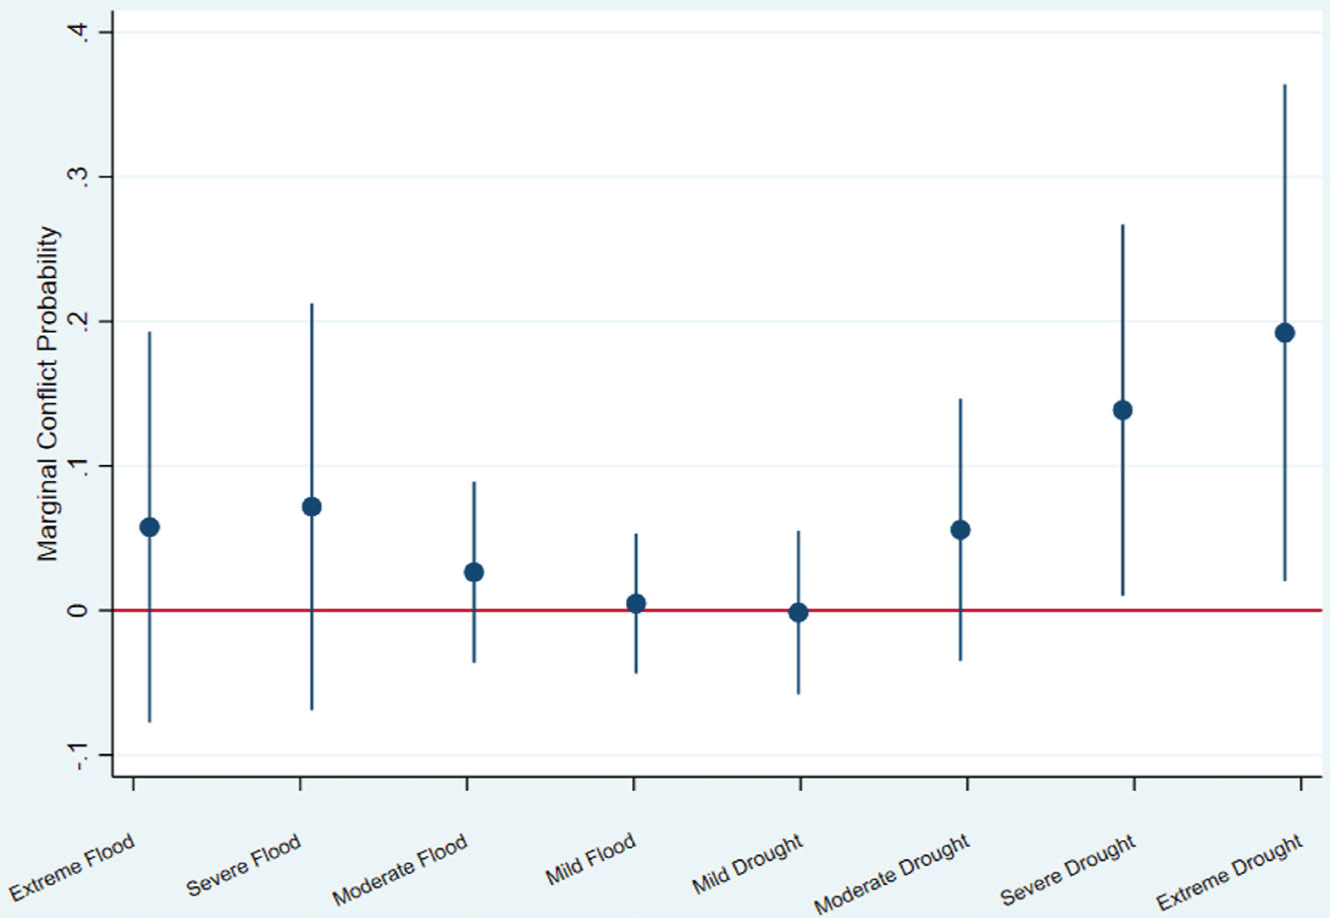
Results in Column (2) show significant nonlinearities in the drought-conflict relationship. For example, a city experiencing an extreme drought would witness a 0.35 percentage point (0.088 standard deviation) increase in the probability of conflict onset (in terms of standard deviations of the PDSI itself, extreme droughts are those that are more than two standard deviations away from the mean (see summary statistics in Table 1)). Similarly, a severe drought is associated with a 0.19 percentage point (.048 standard deviation) increase in conflict probability. However, this probability declines quite rapidly with the severity of the drought classification: Moderate and mild droughts are only associated with a 0.074 and an (insignificant) 0.015 percentage point increase in the probability of city-level unrest, respectively. This is shown in Figure 3, which presents a graph of these coefficients and their associated 95 percent confidence intervals.
PDSI AND CONFLICT ONSET (BOSKER DATA)
Sources: Author’s calculations based on Brecke (Reference Brecke1999), Cook et al. (Reference Cook, Seager, Kushnir and Briffa2015), Bosker, Buringh, and van Zanden (Reference Bosker, Buringh and van Zanden2013).

Results are broadly similar using the Wahl dataset of cities in the Holy Roman Empire (Columns (3) and (4)). In Column (3), a unit increase in drought severity is associated with a 0.04 percentage point increase in the probability of a civil disturbance (alternatively, a one s.d. increase in the drought severity variable is associated with a 0.013 s.d. increase in the probability of conflict onset). Flooding is positively associated with conflict in the Wahl dataset, although the impact is relatively small and insignificant. The coefficients on the drought severity indicators (Column (4)) are somewhat lower than those obtained using the Bosker data, and the relationship is less non-linear. Extreme and severe droughts are still, however, significantly associated with an increase in the probability of conflict onset (a graph of these coefficients is shown in Figure 4). For example, extreme droughts are associated with a .043 s.d. increase in the probability of conflict onset for cities in Wahl’s sample. These nonlinearities are also visible in Figures A1 and A2 of the Online Appendix, which display results from local polynomial regressions of conflict on the PDSI.
PDSI AND CONFLICT ONSET (WAHL DATA)
Sources: Author’s calculations based on Brecke (Reference Brecke1999), Cook et al. (Reference Cook, Seager, Kushnir and Briffa2015), and Wahl (Reference Wahl2016).

DROUGHTS AND FLOODS AS A DETERMINANT OF CONFLICT INCIDENCE
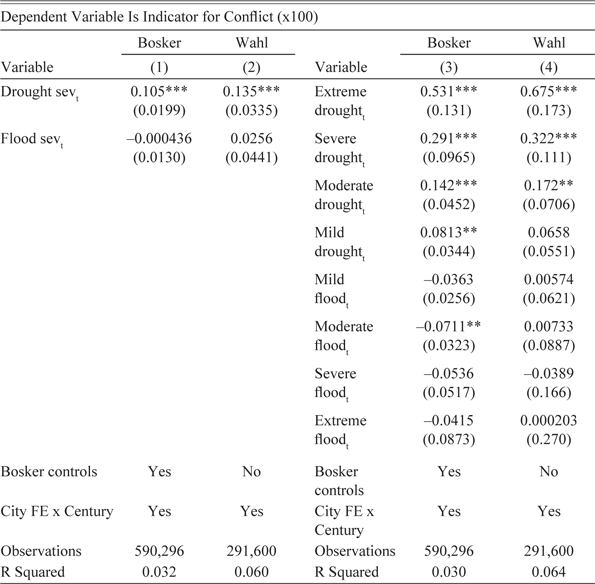
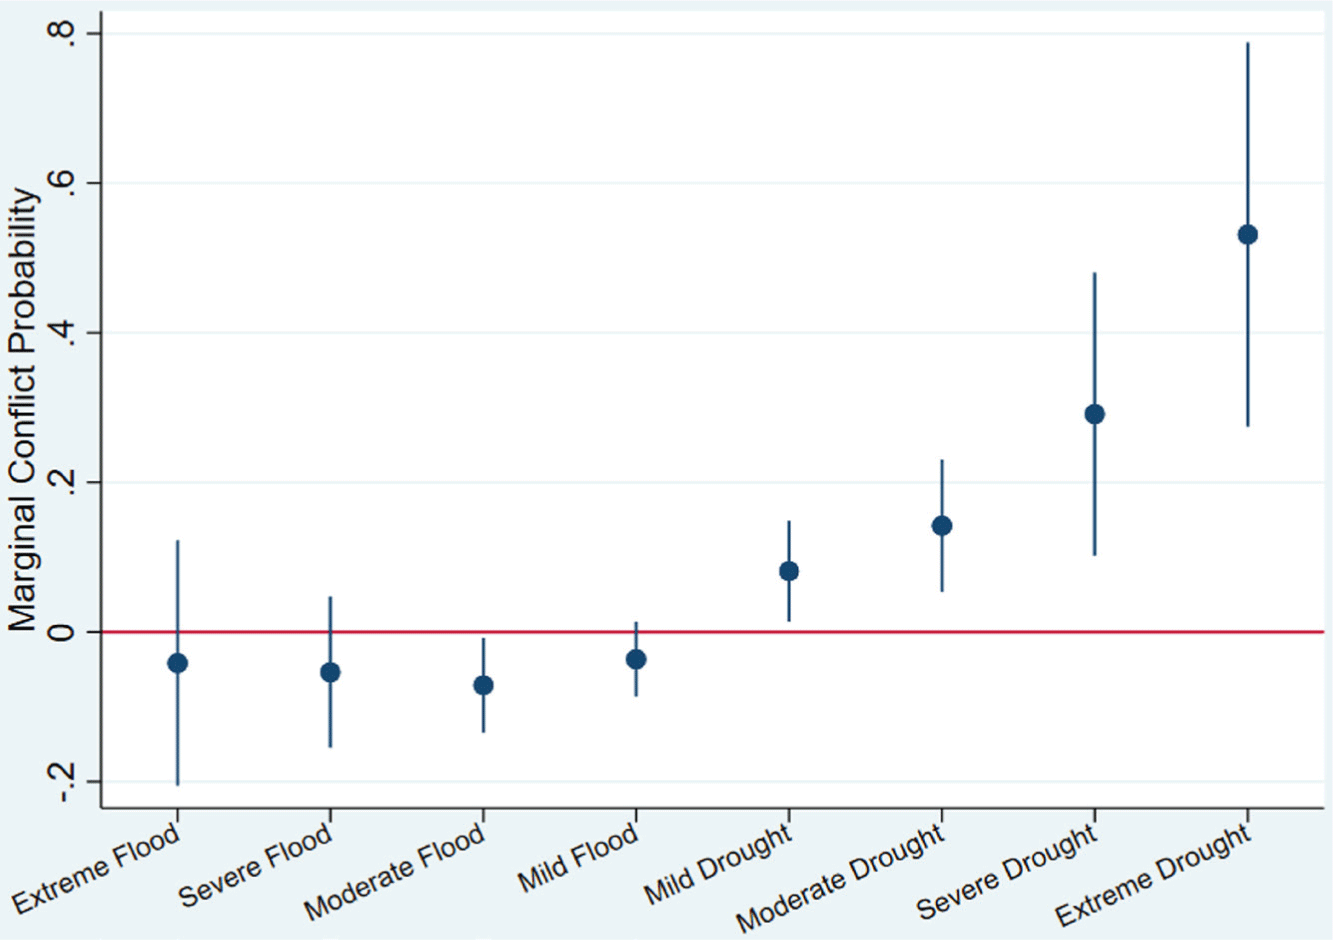
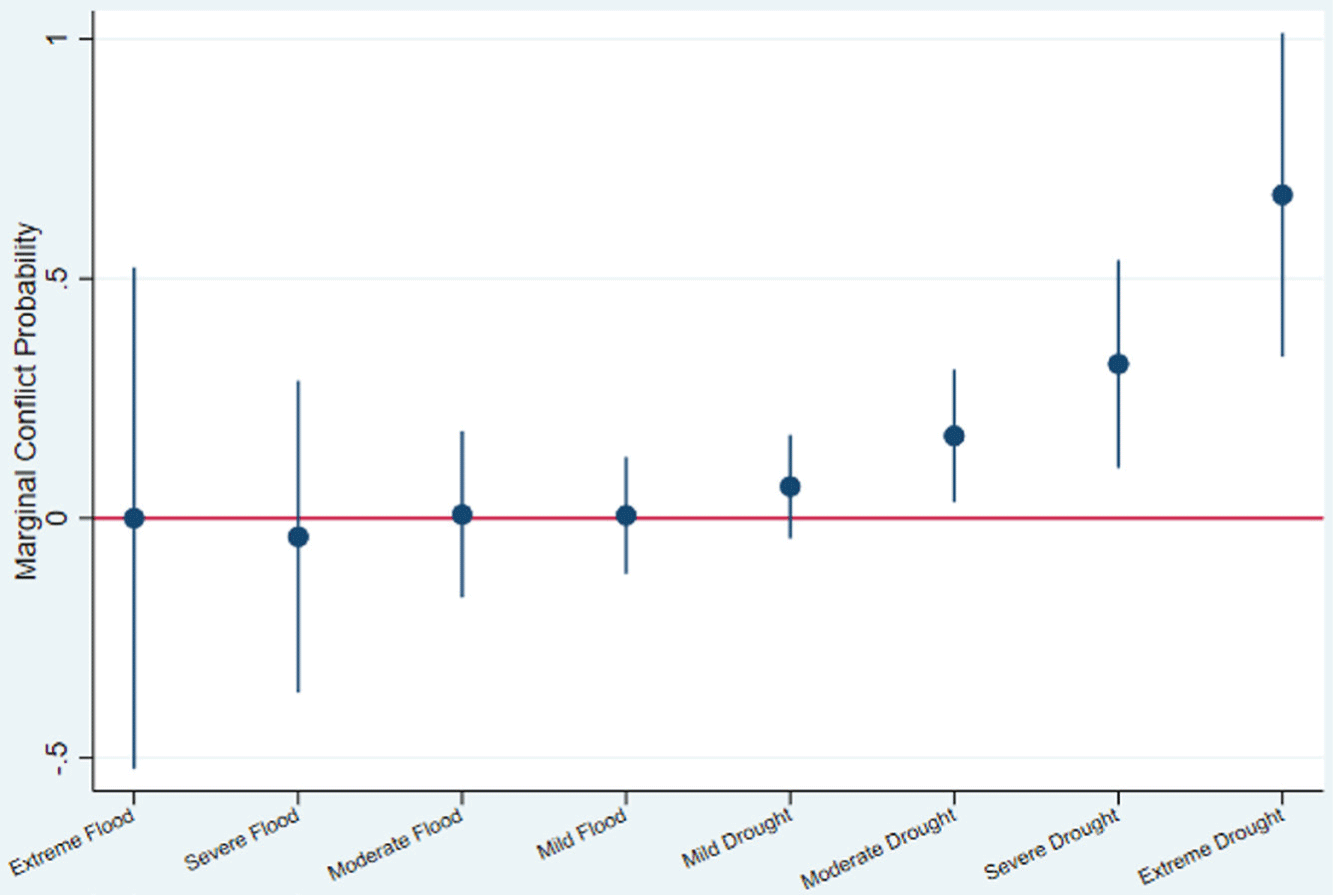
Results using conflict incidence as the dependent variable are presented in Table 3. Column (1) suggests that a one-unit increase in drought severity is associated with a 0.11 percentage point increase in the probability of a conflict using Bosker’s data, and a 0.14 percentage point increase using Wahl’s sample (Column (2)). Such results suggest that civil unrest is likely to continue as long as the opportunity cost of rebellion (assumed here to be agricultural income) is sufficiently low. Column (3) regresses conflict incidence on the eight drought and flood severity classification indicators using the Bosker data. Interestingly, estimates display a pattern similar to those in Table 2. In this case, extreme, severe, and moderate droughts are associated with a 0.53, 0.29, and 0.14 percentage point increase in the probability of a conflict, respectively. The specification using Wahl’s data in Column (4) displays a similar pattern, but the magnitudes of the coefficients are somewhat larger: Here, extreme, severe, and moderate droughts are associated with a 0.68, 0.32, and 0.17 percentage point increase in conflict probability. These results are probably better visualized in Figures 5 and 6, which graph these estimates and their 95 percent confidence intervals.
EFFECT OF DROUGHTS AND FLOODS ON CONFLICT (ANY YEAR)

Notes: Standard errors calculated using the arbitrary clustering methodology of Colella et al. (Reference Colella, Lalive, Sakalli and Thoenig2019). *** p<0.01, ** p<0.05, * p<0.1. All regressions include city and year fixed effects. Time-invariant city characteristics (“City FE”) include indicators for city location by the sea, a river, a Roman road, as well as agricultural suitability (and location by a Roman hub for cities in Bosker’s data).
Sources: Author’s calculations based on Brecke (Reference Brecke1999), Cook et al. (Reference Cook, Seager, Kushnir and Briffa2015), Bosker, Buringh, and van Zanden (Reference Bosker, Buringh and van Zanden2013), and Wahl (Reference Wahl2016).
PDSI AND CONFLICT INCIDENCE (BOSKER DATA)
Sources: Author’s calculations based on Brecke (Reference Brecke1999), Cook et al. (Reference Cook, Seager, Kushnir and Briffa2015), and Bosker, Buringh, and van Zanden (Reference Bosker, Buringh and van Zanden2013).

PDSI AND CONFLICT INCIDENCE (WAHL DATA)
Sources: Author’s calculations based on Brecke (Reference Brecke1999), Cook et al. (Reference Cook, Seager, Kushnir and Briffa2015), and Wahl (Reference Wahl2016).

Finally, note that the time period under consideration is quite long, and these results might be expected to weaken with improvements in state capacity, market integration, and industrialization. This is assessed explicitly in Table A4 of the Online Appendix. Here, I interact the drought and flood severity variables with century indicators (there are nine such indicators total). I find that the drought-conflict relationship varies in strength depending on the century, but the relationship seems to weaken after 1600. This is a similar conclusion reached by Anderson, Johnson, and Koyama (Reference Anderson, Johnson and Koyama2017) in their study of weather shocks and Jewish persecutions.
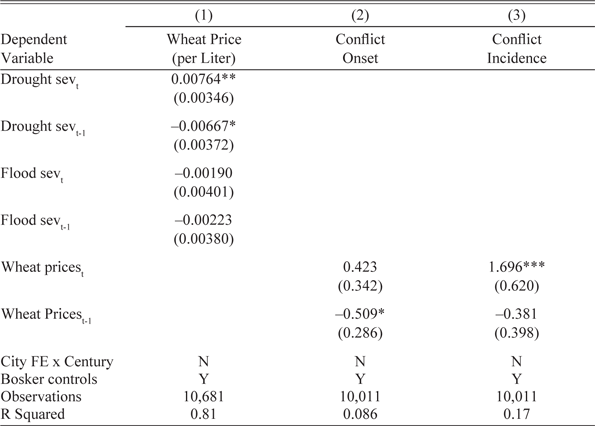
FOOD PRICES AS A CHANNEL FOR CONFLICT
Results from Column (1) of Table 4 suggest that a one-unit increase in drought severity is associated with a 1 percent increase in the price of a liter of wheat. Although floods are positively associated with wheat prices, the effect is not significant: The latter finding may partly explain why floods are not as robustly associated with conflict as droughts. Columns (2) and (3) regress conflict onset and incidence, respectively, on wheat prices, although such correlations should be interpreted with caution, as there are only 36 distinct conflicts (or 123 conflict-years) among cities with wheat price data. Perhaps for this reason, the association between conflict onset and contemporaneous wheat prices is positive but non-significant. With conflict incidence as the dependent variable, the correlation becomes significant and suggests a 1 percent increase in the price of wheat is associated with a 0.02 percentage point increase in conflict probability. In Table A13 of the Online Appendix, I show that these prices are a determinant of conflict regardless of whether cities have a high or low climatic suitability for wheat production. Here, I also use the PDSI to predict wheat prices, and then regress conflict on this predicted variable (which allows for a larger sample). I find conflict to be positively associated with these predicted prices again.
WHEAT PRICES, CONFLICT, AND DROUGHTS

Notes: Standard errors calculated using the arbitrary clustering methodology of Colella et al. (Reference Colella, Lalive, Sakalli and Thoenig2019). *** p<0.01, ** p<0.05, * p<0.1. All regressions include city and year fixed effects.
Sources: Author’s calculations based on data from Brecke (Reference Brecke1999), Cook et al. (Reference Cook, Seager, Kushnir and Briffa2015), and Allen and Unger (Reference Allen and Unger2019).
LOCAL GOVERNANCE, ELECTIONS, AND CONFLICT
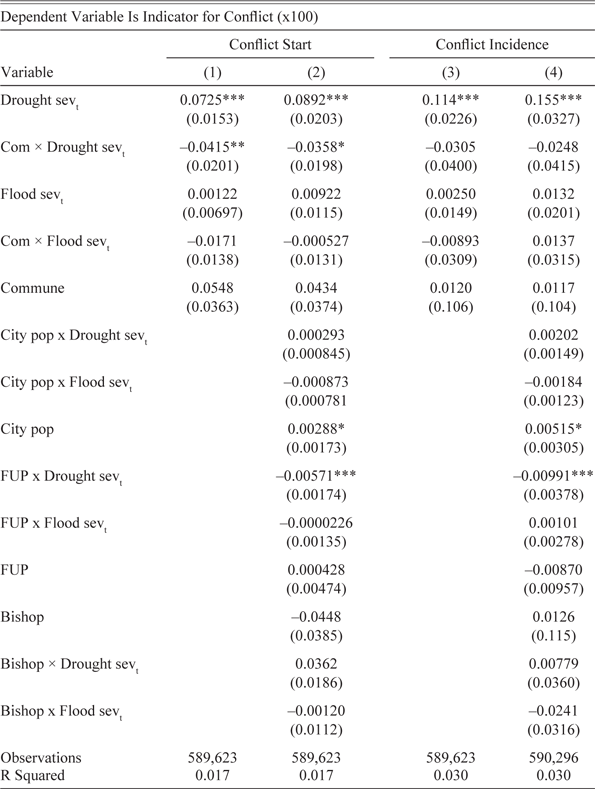
Table 5 presents the results from specification three. The interaction term in Column (1) suggests that cities containing a commune have a lower propensity for drought-induced conflict. The magnitude of the drought severity variable is more than halved for such cities (0.031 percentage points for commune cities versus 0.073 for those without a commune). To help verify that this result is due to participative governance as opposed to some other city-level trait, I include three other city characteristics interacted with the drought (and flood) severity variables: A city’s population, an indicator for whether the city was the seat of a bishop or archbishop, and the “foreign urban potential” (FUP) variable of Bosker, Buringh, and van Zanden (Reference Bosker, Buringh and van Zanden2013) (which measures a city’s ease of access to other markets). Here, a city’s population is likely a close proxy for its overall wealth in the pre-Industrial period, and more populous cities might be expected to better withstand such shocks. Similarly, the presence of religious authorities may dissuade the local population from rebelling (Chaney Reference Chaney2013). Interaction terms with these variables are included in Column (2): The only one that has any effect is the FUP, which attenuates the impact of communes slightly. In the Online Appendix (Table A9), I show that communes appear to be most successful in reducing the probability of unrest from severe and extreme droughts—that is, those droughts at the top of the severity distribution.
PARTICIPATIVE GOVERNANCE AND DROUGHT-INDUCED CONFLICT

Notes: Standard errors calculated using the arbitrary clustering methodology of Colella et al. (Reference Colella, Lalive, Sakalli and Thoenig2019). *** p<0.01, ** p<0.05, * p<0.1. All regressions include Bosker’s controls, city and year fixed effects, and time-invariant city characteristics (“City FE”) interacted with century indicators.
Sources: Author’s calculations based on Brecke (Reference Brecke1999), Cook et al. (Reference Cook, Seager, Kushnir and Briffa2015), Bosker, Buringh, and van Zanden (Reference Bosker, Buringh and van Zanden2013), and Wahl (Reference Wahl2016).
To assess whether participative governance can reduce the length of civil unrest, Column (3) of Table 5 utilizes conflict incidence as the dependent variable. Interestingly, the interaction between the commune indicator and drought severity is insignificant. This finding suggests that once a conflict has started, communes are ineffective in reducing its duration. Adding the interaction terms between droughts and a city’s population, the presence of a bishop, and the FUP does not change this result (although the interaction between the FUP and droughts is negative and significant, which suggests market access helped reduce social disruption from droughts).
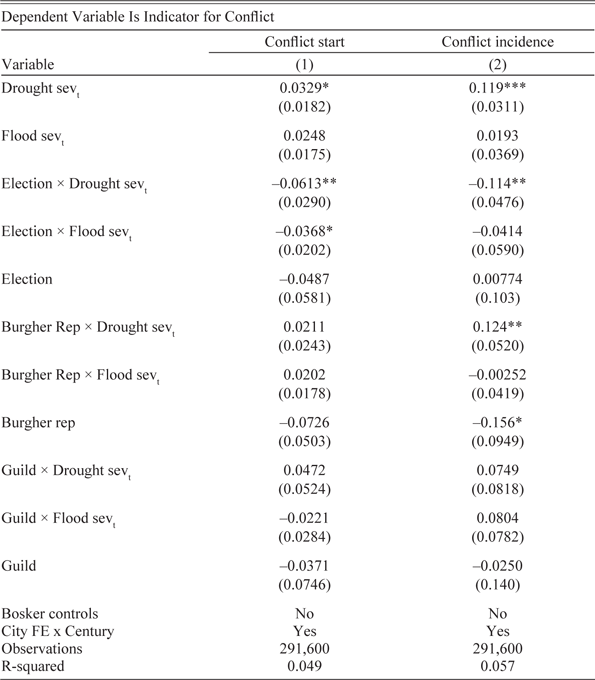
Table 6 displays estimates from specification four, using Wahl’s sample of 324 cities. These results suggest that the type of participative governance is an important factor in mitigating city conflict. In particular, local governments based on elections appear almost immune to the drought-conflict relationship. In the specification using conflict onset (Column (1)), the coefficient on the interaction term between drought severity and elections (–0.061) more than offsets the coefficient on drought severity itself (0.033). Elected governments appear successful in reducing conflict incidence as well, as the magnitude of this interaction term (–0.11) almost completely abates the impact of drought severity (0.12) (Column (2)). These findings suggest that more representative local governments are not only able to forestall violent conflict, but are also able to shorten the duration of such conflict should it occur. This contrasts with the other types of governance, which remain ineffective in reducing such discord. These findings probably explain why communes (as defined by Bosker) are only marginally successful in reducing conflict: It is their democratic extent that is key for moderating drought-induced unrest.
CITY GOVERNMENT TYPE AND CONFLICT

Notes: Standard errors calculated using the arbitrary clustering methodology of Colella et al. (Reference Colella, Lalive, Sakalli and Thoenig2019). *** p<0.01, ** p<0.05, * p<0.1. All regressions include city and year fixed effects. Time-invariant city characteristics (“City FE”) include indicators for a city location by the sea, a river, a Roman road, as well as agricultural suitability.
Sources: Author’s calculations based on Cook et al. (Reference Cook, Seager, Kushnir and Briffa2015) and Wahl (Reference Wahl2016).
Finally, note that Table 5 suggests that the level effect of communes on conflict is insignificant: That is, cities without communes are no more likely to experience local unrest than those with them. In fact, the estimates would suggest that communes actually raise the probability of conflict onset by 0.014 standard deviations (in Column (1) of Table 5), and conflict incidence by 0.0019 standard deviations (in Column (3) of Table 5). However, both of these coefficients are insignificant. Furthermore, the indicators for the presence of city-level elections, burghers, and guild representation are generally insignificant as well (Table 6). Aside from drought-induced conflict, there appears to be no meaningful differences in these institutions’ ability to prevent civil discord. While a detailed examination of this is beyond the scope of this study, the previous discussion suggests that food shortages were a fairly common and relatively straightforward problem during this time period. That is, policies to mitigate these shocks were likely well recognized by city authorities, regardless of whether it was in their economic or political interest to implement them. Yet this may not have been the case with other sources of conflict in pre-Industrial Europe, such as religious differences or evolving political struggles between local and national authorities. Solutions to these problems were likely far more elusive at the time, and more representative governments may not have been in a better position to moderate these sources of unrest.
DISCUSSION: CONFLICT MITIGATION AND FOOD PROVISION
I present suggestive evidence that more representative institutions were able to avert unrest from droughts by moderating food price shocks. To do so, I use a specification similar to Equation (4), except that the dependent variable is the log price of wheat. That is, I regress wheat prices on the drought and flood severity variables, as well as their interactions with each of the three government types. Here, I pool cities from both the Bosker and Wahl datasets, although I only use cities in the Bosker dataset if they are recorded as not having a commune, since Bosker, Buringh, and van Zanden (Reference Bosker, Buringh and van Zanden2013) do not record the democratic extent of local governance. With this approach, I can obtain information for 21 cities (with the average city containing 187 years of wheat-price data).
As in the previous analysis, most of this data covers the seventeenth and eighteenth centuries, although some series extend back to the fourteenth century. Cities in this more limited sample still have a wide geographic scope, with locations in England, the Low Countries, Germany, France, Poland, Austria, and Italy. At some point during the time frame for which wheat-price data is recorded in these cities, six of them had elected governments, five had burgher representation, eight had guild representation, and ten had no participative governance at all (a few cities adopted more than one type of governance over this period). Given the shorter time horizon of this sample, I do not include the time-invariant city characteristics interacted with century indicators, as most of them are dropped due to insufficient observations. I do, however, include city and year fixed effects, as well as Bosker’s time-varying controls, since they are available for all cities in this sample (i.e., no city is exclusive to Wahl’s dataset).
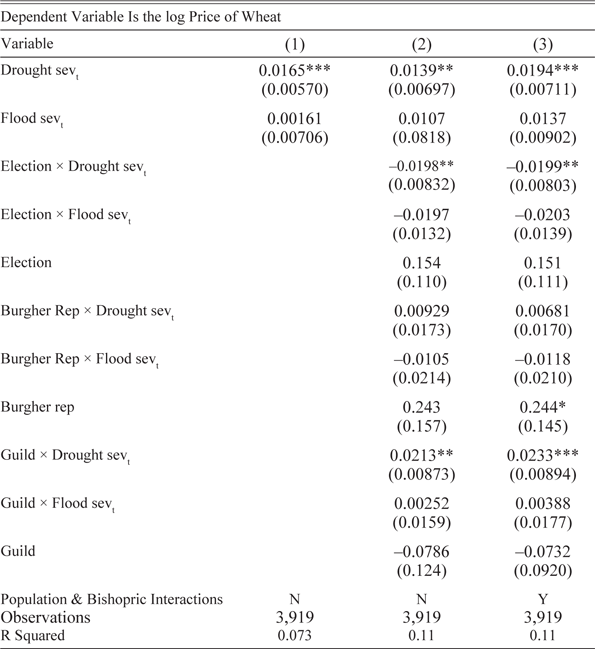
Results are presented in Table 7. Column (1) suggests that the coefficient on the drought severity variable in this subsample remains significant and is actually larger than in the specification which utilizes the full sample of city-level wheat prices. The second column then adds the interaction terms between drought (and flood) severity and the government types. Importantly, cities with elections appear more successful in moderating food price shocks, as the coefficient on the interaction term between droughts and elections (–0.0198) is significant and more than offsets the effect of droughts on wheat prices (0.0139). The interaction term on droughts and guild representation is positive and significant, which suggests guilds were particularly ineffective at mitigating these price shocks and may have exacerbated them. These estimates are similar in magnitude and significance to those in Column (3), which adds interaction terms between droughts and city population, as well as between droughts and the presence of a bishop. (Note that I exclude interaction terms with the FUP since this variable is nearly constant for these cities in this time period). Overall, such findings provide suggestive evidence that cities with elections were able to forestall the impact of droughts on conflict through their management of food prices.
PARTICIPATIVE GOVERNANCE AND FOOD PRICES

Notes: Standard errors calculated using the arbitrary clustering methodology of Colella et al. (Reference Colella, Lalive, Sakalli and Thoenig2019). *** p<0.01, ** p<0.05, * p<0.1. All regressions include city and year fixed effects. Time-invariant city characteristics (“City FE”) include indicators for a city location by the sea, a river, a Roman road, as well as agricultural suitability.
Sources: Author’s calculations based on Wahl (Reference Wahl2016), Cook et al. (Reference Cook, Seager, Kushnir and Briffa2015), and Allen and Unger (Reference Allen and Unger2019).
Notably, these results would be consistent with more representative governments acting in the interests of the general population. As described previously, governments based on a relatively broader constituency seem to have been more proactive in their response to food shortages, likely because they were a direct threat to the welfare of the urban population. That guild and burgher representation appear ineffective in moderating food prices or drought-induced conflict is consistent with such institutions being far less responsive to the concerns of those outside their narrow electorate. The positive (and significant) coefficient on the interaction term between droughts and guild representation is not necessarily aberrant either, as the historical record suggests some guilds did attempt to profit off food shortages: Local governments, based on their support, may have been disinclined to prevent such profiteering, even though it was likely detrimental to the welfare of most others.
CONCLUSION
This study has highlighted the impact of climate shocks on social disruption in pre-Industrial Europe. A key contribution of this research is the precision, disaggregation, and long time horizon of the data, which lends a strong degree of credibility to the causal effect of climate shocks on local unrest. An important aspect of this relationship concerns the disproportionately large impact of droughts in the upper tail of the severity distribution, as well as the more minor effect of floods, which are a less robust determinant of conflict. I find that a possible channel for these effects is through food prices, as more severe droughts are associated with increases in the city-level price of wheat. Nevertheless, it is likely that other channels exist as well, and determining these linkages may constitute an important avenue for future research. Importantly, the pernicious social consequences of droughts appear to be avoidable, as cities with more representative governments and some autonomy in local administration are better able to avert conflict. Both factors seem necessary to forestall such violence, as the latter, without the former, appears ineffective in abating drought-induced unrest. Democratic accountability and local government responsiveness thus appear to be important factors for maintaining social stability during these types of economic shocks.