Introduction
Cultivated soybean (Glycine max (L.) Merr.) is a globally recognized legume crop due to its high protein and oil content. Drought is one of the major abiotic stresses limiting the productivity of soybean worldwide (Wijewardana et al., Reference Wijewardana, Alsajri, Irby, Krutz, Golden, Henry, Gao and Reddy2019). Drought tolerance (DT) is a complex trait composed of multiple morphological and physiological sub-traits. Progress of selection based on yield itself has been slow due to the low heritability of yield (Galli et al., Reference Galli, Alves, Morosini and FritscheNeto2020). Consequently, improvement in drought-sensitive areas can only be made through identifying secondary morpho-physiological traits associated with DT, stable across environments and correlated to yield (Hamwieh et al., Reference Hamwieh, Imtiaz and Malhotra2013; Tucker et al., Reference Tucker, Dohleman, Grapov, Flagel, Yang, Wegener, Kosola, Swarup, Rapp, Bedair and Halls2020).
Understanding the inheritance pattern of any trait is of key significance towards the cultivar development (Gai, Reference Gai2006; Zhang and Gai, Reference Zhang and Gai2009). The linkage mapping (LM) based on bi-parental crossing although quite popular in identifying large effect genetic regions for DT yet limited owing to relatively small phenotypic variation prevalent in the bi-parental populations as only two alleles per locus can be detected simultaneously. To overcome the limitations of LM populations, association mapping (AM) is utilized for mapping of complex traits with higher resolution (Maranna et al., Reference Maranna, Kumawat, Nataraj, Gireesh, Gupta, Satpute, Ratnaparkhe and Yadav2019). However, resolution of quantitative trait locus (QTL) mapping in AM is greatly influenced by a number of factors such as selection, migration, genetic drift and linkage disequilibrium (LD) decay (Maranna et al., Reference Maranna, Kumawat, Nataraj, Gireesh, Gupta, Satpute, Ratnaparkhe and Yadav2019). Eventually, to overcome the shortfalls of LM and AM, multi-parent mapping populations such as nested association mapping (NAM) has emerged as a promising mapping design for handling complex genetic traits (Li et al., Reference Li, Bradbury, Ersoz, Buckler and Wang2011).
The previous GWAS (genome-wide association study) procedures focused on identifying a handful of major QTLs, such as general linear model (GLM) and mixed linear model (MLM) approaches (Pritchard et al., Reference Pritchard, Stephens, Rosenberg and Donnelly2000; Price et al., Reference Price, Patterson, Plenge, Weinblatt, Shadick and Reich2006; Yu et al., Reference Yu, Pressoir, Briggs, Bi, Yamasaki, Doebley and Kresovich2006) based on the single-locus model, and even MLMM (Segura et al., Reference Segura, Vilhjálmsson, Platt, Korte, Seren and Long2013), mrMLM (Wang et al., Reference Wang, Feng, Ren, Huang, Zhou and Wen2016) and FASTmrMLM (Zhang and Tamba, Reference Zhang and Tamba2018) based on the multi-locus model and were generally based on SNP markers which involve only two alleles at one site, and therefore, the multi-allelic variation widely existed in germplasm population could not be detected (Zhang et al., Reference Zhang, He, Wang, Meng, Xing, Li, Yang, Zhao, Zhao and Gai2018).
He et al. (Reference He, Meng, Zhao, Xing, Yang, Li, Guan, Lu, Wang, Xia and Yang2017) designed a sophisticated restricted two-stage multi-locus GWAS procedure (RTM-GWAS) for a relatively thorough detection of QTLs and the multi-allelic variation which is widely existent among the germplasm populations. The procedure results in the establishment of a QTL-allele matrix, providing complete genetic information (Gai et al., Reference Gai, Chen, Zhang, Zhao, Xing and Xing2012).
Recently, Khan et al. (Reference Khan, Tong, Wang, He, Zhao and Gai2019) used the same procedure and identified relative plant length (RPL) and relative plant dry weight (RPDW) as a set of DT indicators. DT being a highly complex trait warrants the identification and exploration of lot more indicators. Accordingly, by using same innovative procedure but with different DT indicators (i.e. relative root length (RRL) and relative shoot length (RSL)) we tried to explore their QTL-allele genetic constitution and consequently the gene ontology (GO) enrichment analysis for understanding the gene system conferring DT in the population.
Materials and methods
Population development
The two RIL populations from the crosses of M8206 × TongShan (MT) and ZhengYang × M8206 (ZM) comprising of respective 285 and 124 in a total of 409 lines were earlier developed at the National Center for Soybean Improvement (NCSI), Nanjing Agricultural University, Nanjing, China (Li et al., Reference Li, Cao, He, Zhao and Gai2017). The common parent was M8206, an indeterminate breeding line in MG V (maturity group V) appeared relatively sensitive to drought, while the other parents were TongShan, a land race in MG VI and ZhengYang, also a land race in MG V appeared relatively tolerant to drought. Here the population comprised of a nested structure from M8206 to TongShan along with their derived RILs and, at the same time, to ZhengYang along with their derived RILs, therefore it can be termed as a NAM population. Since the parent M8206 was common we refer this as MTZ half-sib/NAM population. The benefit of using this kind of population in mapping QTLs through RTM-GWAS is to treat the two RIL populations as a unity population for detecting multiple alleles (up to three alleles for the three parents in the present study) on a same QTL, as indicated by Li et al. (Reference Li, Cao, He, Zhao and Gai2017). As the population is composed of two sets of half-sib families, we can also call these as Half-Sib RIL populations.
All the F2 plants of the two crosses were harvested individually and each F2 plant was planted in a hill to obtain F3 plants. Subsequently, one F3 plant in each hill was randomly harvested for further planting, and so was for F4–F7 generations. Each selected F2:7 plants were planted in rows and bulked to obtain F2:7:8 seed for the experiment in 2012, and later the seeds of F2:7:9, F2:7:10 generations were obtained in 2013 and 2014, respectively (Li et al., Reference Li, Cao, He, Zhao and Gai2017).
Experimental design and drought tolerance measurements
The procedure for evaluation of phenotypic variation was the same as used by that of Khan et al. (Reference Khan, Tong, Wang, He, Zhao and Gai2019). In the year 2015, 404 lines (281 of MT and 123 of ZM, left five lines missing due to seed germination problem) of the NAM population along with three parents were grown in a randomized complete block design experiment with two replications, each replication comprised of two treatments, one for stress and another for control in the green house of the NCSI, Nanjing Agricultural University, China with day/night air temperatures about (28/22) ± 2°C and 60% relative humidity. The experiment was performed in plastic boxes (50 cm length; 38 cm width and 24 cm deep). The boxes were filled with 30 kg cleaned sand and 14 lines were germinated in each plastic box making a total of 30 boxes to accommodate all 404 lines and their three parents in one replication each for stress and control treatments. The boxes were watered irrespective of stress and controls till the seedlings reach at V1 stage. Then water was suspended for the stress treatment plants till the moisture level reached 3%. That being the critical value for plants to keep them alive. Control plants obtained adequate water as and when required. After harvesting at V2 stage, relative values were recorded for the root length (RRL) and shoot length (RSL). The root length (RL) and shoot length (SL) were measured from the cotyledon node with a common ruler in centimetres (cm) for all available seedlings. The relative values of each indicator were obtained through dividing the stress treatment of each accession by its control (non-stressed).
Statistical analysis
The PROC GLM procedure under the optional random model was employed to calculate the coefficient of variation (CV), heritability (h2) and analysis of variance (ANOVA) for the two studied DT traits. While the variance components were calculated using PROC VARCOMP of SAS program (SAS Institute Inc., 2004). The heritability was estimated as
 $$h^2 = \lpar {\sigma_{\rm g}^2 } \rpar / \lpar \sigma _{\rm g}^2 + \sigma _{\rm e}^2 /r\rpar \comma \;$$
where h 2 = heritability,  $\sigma _{\rm g}^2 $ = genotypic variance,
 $\sigma _{\rm e}^2 $ = error variance, and r is the number of replications and n is the number of environments for the experiment (Hanson et al., Reference Hanson, Robinson and Comstock1956). All the parameters were approximated from the expected mean squares in ANOVA.
Genotyping and SNPLDB construction
The RAD–seq (restriction-site-association DNA sequencing) was used for genotyping the NAM population in the present study and carried out at the Beijing Genomics Institute (BGI) Tech, Shenzhen, China (Li et al., Reference Li, Cao, He, Zhao and Gai2017). The method was same as described by Khan et al. (2018) and Khan et al. (2019). The genomic DNAs from fresh leaves were processed using the CTAB protocol (Murray and Thompson, Reference Murray and Thompson1980). The sequences of the 404 lines were obtained using Illumina HiSeq2000 instrument through the multiplexed shotgun genotyping method (Andolfatto et al., Reference Andolfatto, Davison, Erezyilmaz, Hu, Mast, Sunayama-Morita and Stern2011) with the DNA fragments between 400 and 600 bp. A total of 3.7 Gb sequencing data were obtained for the three parents with an average coverage of 7.8% and coverage depth of 9.7x. A total of 65.2 and 35.9 Gb sequencing data were obtained for MT and ZM, respectively, with an average coverage of 3.7% and coverage depth of 4.4x. All sequence reads were aligned against the soybean genome Glyma.Wm82.a1.v1.1 assembly (Schmutz et al., Reference Schmutz, Cannon, Schlueter, Ma, Mitros, Nelson, Hyten, Song, Thelen and Cheng2010) using the SOAP2 software (Li et al., Reference Li, Yu, Li, Lam, Yiu, Kristiansen and Wang2009), with parameters that included sequence similarity, pair-end relationships and sequence quality. The RealSFS (Yi et al., Reference Yi, Liang, Huerta-Sanchez, Jin, Cuo, Pool, Xu, Jiang, Vinckenbosch and Korneliussen2010) was used for population SNP-calling based on the Bayesian estimation of locus frequency. The SNPs of the half-sib/NAM population were polymorphic with a rate of the missing and heterozygous allele calls ≤0.3 and minor allele frequency (MAF) ≥0.01 (the third or more alleles were replaced no more than once with the missing allele, when available). The fastPHASE software (Scheet and Stephens, Reference Scheet and Stephens2006) was used for genotyping SNP imputation after the heterozygous alleles were turned into missing allele.
The Haploview software was used to compute the haplotype blocks and posterior probability of the multi-marker type of determining the final SNPLDB data set (Wall and Pritchard, Reference Wall and Pritchard2003; Barrett et al., Reference Barrett, Fry, Maller and Daly2005). The confidence interval method was employed to define the blocks with default settings in Haploview, except that the maximum distance and minimum MAF were set to 200 kb and 0.01, respectively (Gabriel et al., Reference Gabriel, Schaffner, Nguyen, Moore, Roy, Blumenstiel, Higgins, DeFelice, Lochner and Faggart2002). The SNPs within an LD block were grouped into a SNPLDB marker with parental haplotypes as its alleles. According to Li et al. (Reference Li, Cao, He, Zhao and Gai2017), if a specific allele of a SNPLDB marker was different from the alleles of the three parents due to recombination during the development of RIL population, the non-parental allele was approximately replaced with the most similar parental allele (with more SNPs consistent within the LD block). From these analysis, a total of 55,936 SNPs and 6137 SNPLDBs were identified in the MTZ NAM population.
Restricted two stage multi-locus genome-wide association analysis (RTM-GWAS)
The RTM-GWAS procedure was applied for detecting the DT QTLs and their alleles and the software is publicly available at https://github.com/njau-sri/rtm-gwas (He et al., Reference He, Meng, Zhao, Xing, Yang, Li, Guan, Lu, Wang, Xia and Yang2017). At the first stage, single locus association test based on the simple linear model was employed to pre-select markers, to minimize the calculation space and noise in the next step, and at the second stage, the stepwise regression featured with forward selection and backward elimination was applied to the pre-selected markers to build the final multi-locus model. In both stages, the top 10 eigenvectors of the genetic similarity coefficient built on SNPLDBs were incorporated as covariates to correct the population structure bias. A normal significance threshold level of 0.05 was used for the pre-selection of individual candidate markers under single locus model and the same significance level was used for the stepwise regression under multi-locus model. The allele effects for each marker were obtained from the stepwise regression in the second stage of the association analysis. Next, the dataset of the estimated allele effects for all the markers was organized as a ‘QTL-allele matrix’. The detected QTLs (all major QTLs) were named using the popular nomenclature, and a serial order was used for QTLs on a same chromosome (McCouch et al., Reference McCouch, Cho, Yano, Paul, Blinst, Morishima and Kinoshita1997). The remaining part calculated from the heritability minus the total genetic contribution of the detected QTLs  $\lpar h^2- R_{{\rm Total}}^2 \rpar $ was termed the total genetic variation of a collective of unmapped minor QTLs (Khan et al., Reference Khan, Tong, Wang, He, Zhao and Gai2019).
Optimal drought tolerance genotypes and breeding potential predictions
The optimal DT genotypes along with their genotypic values were predicted from the parental QTL-allele matrices, including the QTL allele effects by following the same procedure of that of Khan et al. (Reference Khan, Tong, Wang, He, Zhao and Gai2019). Generally, a best genotype can be obtained by directly crossing the three parents. However, owing to very small probability of getting the best genotype; a more appropriate way is to identify the potential crosses among the lines. Therefore, we used the computer-based procedure and the genotypic values of the optimal segregants for all possible single crosses among the 404 lines were predicted. For each cross, 2000 homozygous progenies were simulated under the linkage model. The 95th percentile linkage genotypic predicted values and weighted average values (WAV) of the indicators for DT in progeny population served as the predicted ranges for comparisons among the crosses from which the top 10 optimal crosses were predicted (Khan et al., Reference Khan, Tong, Wang, He, Zhao and Gai2018; Khan et al., Reference Khan, Tong, Wang, He, Zhao and Gai2019). Thereby making a comprehensive DT prediction in the form of WAV, a selection index based on the two indicators (RRL and RSL) for each cross by keeping heritability estimates (h 2) as a weight (standard) for each indicator. Accordingly, all the predicted values of the possible crosses were obtained for optimal single cross-selection based on the obtained genomic QTL-allele information. The breeding potential predictions were also performed with RTM-GWAS program (He et al., Reference He, Meng, Zhao, Xing, Yang, Li, Guan, Lu, Wang, Xia and Yang2017).
Candidate gene annotation
The DT-related candidate gene system from the detected QTLs was inferred according to the SoyBase database (http://soybase.org) using Glyma.Wm82.a1.v1.1 gene model. First, the annotated genes were searched within the interval of associated SNPLDBs or its flanking SNPLDBs when there was no gene inside the detected SNPLDB. Second, to identify the candidate genes, χ 2 test was applied to test the association between the detected SNPLDBs and SNPs in annotated genes at the significance level of P ≤ 0.0001 for each SNP in the annotated genes. Third, an annotated gene was recognized as a potential candidate gene if all SNPs in the gene were significantly associated with those in the detected SNPLDB (that means all the SNPs in the gene are located in the detected SNPLDB).
Results
Phenotypic variation existed for drought tolerance in the MTZ half-sib/NAM population
The frequency distribution of the two DT traits in MTZ population along with the parental performances is shown in Table 1. Among the three parents, M8206 appeared relatively sensitive, while TongShan and ZhengYang appeared relatively tolerant, display not very large differences between the sensitive and tolerant parents. The population revealed significant and transgressive variation among the lines under drought stress indicating the repulsion phase of the parents and allowing their further genetic dissection under drought stress (online Supplementary Table S1). The continuous variation among the traits was suggestive of the quantitative pattern of inheritance. The CV for RRL and RSL was 10.7%, indicating not a large experimental error in both indicators. The heritabilities were higher as in RRL (83.1%) and in RSL (87.1%).
Frequency distribution and genetic variation of the two DT indicators in the MTZ half-sib/NAM population

RRL, relative root length; RSL, relative shoot length; h 2, heritability; CV, coefficient of variation; M, M8206; T, TongShan; Z, ZengYang.
Drought tolerance-associated QTL-allele system identified from RTM-GWAS
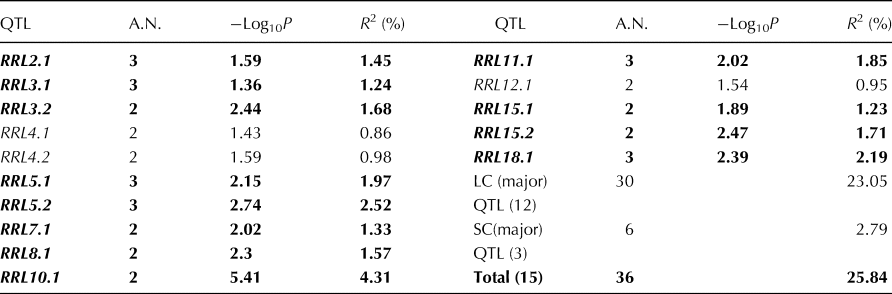
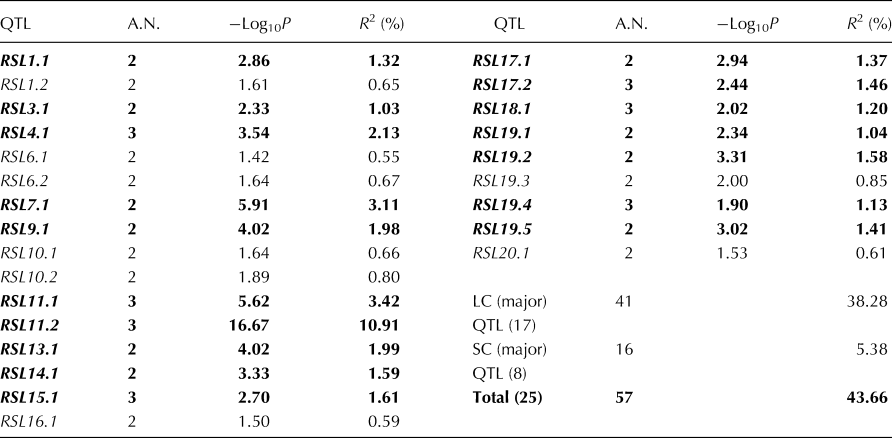
The RTM-GWAS procedure was used in the identification of RRL and RSL QTLs with their alleles. At the first stage of the RTM-GWAS, 259 and 386 out of the 6137 markers were pre-selected for RRL and RSL, respectively. In the second stage, 15 markers/QTLs for RRL and 25 markers/QTLs for RSL, in a total of 40 markers/QTLs, were identified (Tables 2 and 3). The details of the QTLs, including marker name and physical position were listed in online Supplementary Tables S2 and S3. In the column of QTLs, the QTLs are artificially classified as large contribution major QTL (R 2 ≥ 1.0%, LC-major QTL) and small contribution major QTL (R 2 < 1.0%, SC-major QTL); the probability (−Log10P) is the probability for the QTL.
QTLs conferring drought tolerance for RRL in MTZ half-sib/NAM population using RTM-GWAS

QTL: a QTL such as RRL2.1 is designated in the following way: RRL stands for relative root length, 2 means chromosome number 2 and 0.1 means its order in that chromosome according to its physical position.
QTL in bold face means the locus is a large-contribution major QTL (LC major QTL) with R2 value more than 1.0%, while a QTL in normal case is considered as a small-contribution major QTL (SC major QTL).
A.N.: number of alleles in an SNPLDB in the population; –Log10P: the probability value of an SNPLDB in RTM-GWAS (the significance probability to which SNPLDB is associated with the trait); R 2: genetic contribution to the phenotypic variation of a QTL.
QTLs conferring drought tolerance for RSL in MTZ half-sib/NAM population using RTM-GWAS

QTL: a QTL such as RSL20.1 means relative shoot length trait, chromosome 20 and 0.1 means its order according to its physical position on that chromosome.
QTL in bold face means the locus is a large-contribution major QTL (LC major QTL) with R 2 value more than 1.0%, while a QTL in normal case is considered as a small-contribution major QTL (SC major QTL).
A.N.: Allelic number in an SNPLDB in the population; –Log10P: the probability value of an SNPLDB in RTM-GWAS (the significance probability to which SNPLDB is associated with the trait); R 2: genetic contribution to the phenotypic variation of a QTL.
The total QTL number identified for RRL was 15, out of them LC major was 12 and SC (small contribution) major was 3 with the total phenotypic contribution (PHC) as 25.82%. The QTLs were distributed on 50% of genome on 2nd, 3rd, 5th, 7th, 8th, 10th, 11th, 12th, 15th and 18th chromosomes. The number of QTLs per chromosome ranged from 1 to 2. The –log P values of the loci ranged from 1.36 to 5.41. QTL RRL10.1 had the highest PHC value of 4.31%. However, the broad sense heritability by RRL was 83.1% (Table 1). The difference 57.28% is due to the collective unmapped minor QTLs. The total QTLs identified for RSL were 25, out of them LC (major) with PHC equal to or more than 1% were 17 and SC major with PHC less than 1% were 8 with the total PHC as 43.66%. The QTLs were distributed throughout the genome except 2nd, 5th, 8th and 12th chromosome. The number of QTLs per chromosome ranged from 1 to 5. The −log P values of the loci ranged from 1.42 to 16.67. QTL RSL11.2 had the highest PHC value of 10.91%. However, the broad sense heritability by RSL was 87.1%. The difference 43.44% is again due to the collective unmapped minor QTLs. This difference between the total genetic contribution and the detected major QTL is probably due to the minor effect QTLs that could not be detected individually and could be categorized together as the undetected collective of the minor QTLs.
The total allele number for RRL and RSL was 36 and 57, respectively (online Supplementary Table S4). It can be appreciated that allelic differentiation occurred on all the detected loci, signifying a great deal of differentiation in genetic structure among the three parents. The number of alleles ranged as 2–3 per QTL clearly displays the multiple allele property of the SNPLDBs at a single locus. No overlapped QTLs between RRL and RSL were detected emphasizing highly complex nature of DT and the two indicators had their own unique and independent genetic constitution. We therefore contemplate the two indicators as DT related and parts of overall DT, so both were evaluated and put together for the prediction of the best DT genotypes. In fact, at the same time of RTM-GWAS, CIM LM procedure was also used to identify RRL and RSL QTLs for the component two RIL populations (MT and ZM), only three RSL QTLs were detected in MT RIL population and two RRL QTLs and one RSL QTL were detected in ZM RIL population. Since CIM could not provide efficient results to identify QTLs with their multiple alleles in a NAM population, no details of the CIM results will be discussed later.
Constructing QTL-allele matrices and optimal drought tolerance genotype and cross-predictions
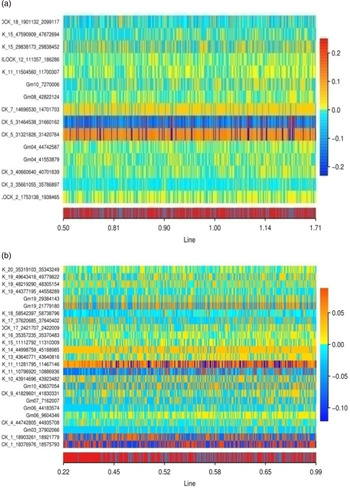
From the second stage of the RTM-GWAS, the number of alleles of each QTL varied between 2 and 3, while the average allele number per locus was 2.4 for RRL and 2.3 for RSL (online Supplementary Table S4). The corresponding allele effects were also obtained for the two indicators showing the allele effects at each locus and ranged from −0.231 to 0.250 and −0.120 to 0.088 for RRL and RSL, respectively (Fig. 1). Likewise, 36 and 57 alleles of the respective 15 and 25 QTLs for RRL and RSL, respectively, were further structured into 15 × 404 and 25 × 404 QTL-allele matrices covering full genetic constitution of the MTZ half-sib/NAM population (Fig. 2). The matrices are expressed in colours with the allele effects as the colour thickness rather than digits. The cells with warm colours represent positive alleles and cells with cool colours portray negative alleles. One of the major findings of this study was that we found all the lines as well as three parents to be a combination of both positive and negative alleles indicating a great inherent recombination potential for breakthrough segregants in the population. Thus by carefully planning the crossing design, more and more positive alleles can be pyramided to get the best drought-tolerant genotype.
The allele effects of the DT QTLs for RRL (a) and RSL (b) of the MTZ half-sib/NAM population. The above green bars indicate the positive and lower empty bars indicate negative alleles. There are 15 QTL with 36 alleles for RRL and 25 QTL with 57 alleles for RSL, respectively.

The QTL-allele matrices of the RRL (a) and RSL (b) of the MTZ half-sib/NAM population. The horizontal axis in each matrix represents the trait values of lines, those with red colour are from MT and those with blue colour are from ZM. The vertical axis represents QTLs of the trait with its allele effects expressed in colour cells, those with warm colours indicating positive alleles, while those with cool colours indicating negative alleles, and the depth of the colour indicates the size of the allele effect.

From the detected QTL-alleles, we also inferred the genetic constitution of the three parents for DT indicators (online Supplementary Tables S5 and S6), which showed that the three parents shared both positive and negative alleles on all the loci in a repulsion phase, potential for further recombination. Like the lines in the MTZ half-sib/NAM population, the three parents also entailed positive and negative alleles thereby, consequently the best alleles on the basis of maximum allelic effects for each of the loci were chosen; and the best/optimal genotype was predicted as the cumulative of all the best alleles on all loci. Therefore, the best genotypic value in the genetic constitution of the three parents was predicted as 1.820 and 1.299 for RRL and RSL, respectively (online Supplementary Tables S5 and S6), much greater than those of the parents' RRL and RSL values, depicting much higher potential that can be achieved for a best DT genotype through recombination of three parents and consequently converging the elite (supreme) alleles into one individual.
In the present study, we consider two ways to combine the best alleles on each QTL. First we predicted the best genotype by choosing the best alleles on each locus among the three parents, but to obtain the best genotype with all the best alleles on all loci pyramided from crossing the three parents directly is not so easy due to a very small probability of getting the best genotype. Therefore, a convenient way is to find best potential crosses among the lines and accordingly top 10 optimal single crosses among 404 lines were predicted. To predict the optimal crosses (single cross) from the half-sib/NAM population, the computer-based program under the linkage model in RTM-GWAS was used for simulation comparisons with the 95th percentile of the progeny distribution as the indicator, assuming each cross comprising of 2000 progenies. Thus 83,436 possible single crosses among the 404 lines in the half-sib/NAM population were predicted. The prediction was made for RRL and RSL separately, but for a thorough and simultaneous selection for the two DT traits, the RRL and RSL values were converted into WAV with the heritability value (h2) of a trait as its weight. Accordingly, the top 10 optimal crosses were selected according to their 95th percentile WAVs (online Supplementary Table S7), which ranged from 1.257 to 1.218 corresponding to the first (T132 × Z061) and the 10th cross (T081 × Z061), respectively. It can be seen that the WAVs of these potential crosses are far less than the best genotypic value of 1.553, however, sufficiently larger than those of the three parents (0.693 for M8206, 0.794 for TongShan and 0.785 for ZengYang) (online Supplementary Table S7). Because these optimal crosses not necessarily cover all the best loci from the parents, the genetic gain is not large enough and several rounds of crossing and selection are needed to get a reasonable progress in DT. Nonetheless, the QTL-allele matrix is proved to be a successful approach in genotyping the parental materials and predicting the genetic gains among them.
Candidate gene system prediction for DT in the half-sib/NAM population
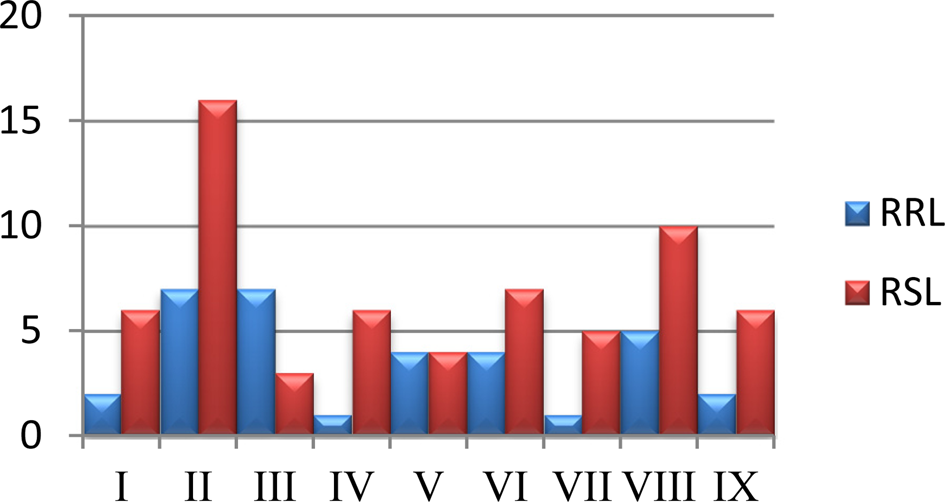
From the QTL system in the MTZ population, the candidate gene system was annotated based on SoyBase (http://www.soybase.org). A candidate gene system comprising of 63 genes for the two DT indicators was inferred based on the significant association between the detected SNPLDBs and the SNPs in the annotated genes through χ 2-test. For RRL, 11 of the 15 QTLs were found to be significantly associated with 26 annotated genes, explaining 17.99% of phenotypic variance (PV). Likewise for RSL, χ 2-based analysis lead to the identification of 15 loci significantly associated with 39 annotated genes explaining 30.83% of PV. Furthermore, these 26 and 39 potential candidate genes detected were subjected to GO enrichment analysis based on the database (http://bioinfo.edu.cn/agriGO) (online Supplementary Tables S9 and S10). The results showed that a group of the genes rather than only a few genes were involved in DT, leading to the response of soybean to drought. From the GO analysis, we identified that all the detected candidate genes were involved in various biological processes, which were broadly grouped into nine categories, i.e. ABA responders (I), stress responders (II), transports (III), development factors (IV), protein metabolism (V), transcription factors (VI), protein kinases (VII), unknown function (VIII) and other minor categories (IX). A summarized view of the division of all 65 candidate genes into their predicted functional annotated groups is also presented (Fig. 3), where one gene may have connection with two or more functional categories.
Gene ontology classification of the candidate genes associated with drought tolerance in the MTZ half-sib/NAM population. ABA responders (I), stress responders (II), transports (III), development factors (IV), protein metabolism (V), transcription factors (VI), protein kinases (VII), unknown function (VIII) and other minor categories (IX) represent the nine biological categories of the candidate genes.

In summary, this study has demonstrated that DT is a super complex trait conferred by multiple series of QTL-alleles and therefore genes pertaining to wide range of biological processes. The RTM-GWAS has explored the DT QTL-allele matrix, which could be highly influential in population genetic study, marker-assisted cross-design and gene finding.
Discussion
Comparison of previously reported and current novel QTLs detected through RTM-GWAS analysis
The major advantage of using the innovative RTM-GWAS analysis is its thorough detection of the genome-wide QTL-allele system which is especially important for population geneticists and breeders to know the complete set of QTL-allele system. We therefore detected 40 QTLs with 93 alleles collectively for both indicators (RRL and RSL). Earlier Khan et al. (Reference Khan, Tong, Wang, He, Zhao and Gai2018) using RTM-GWAS for the DT experiment with polyethylene glycol as drought stress-inducing factor identified 111 QTLs with 262 alleles for RRL and RSL. Only two common QTLs were detected between the present study and that of Khan et al. (Reference Khan, Tong, Wang, He, Zhao and Gai2018). Quite recently, Khan et al. (Reference Khan, Tong, Wang, He, Zhao and Gai2019) identified 46 QTLs with 107 alleles on an average of 38.67% of the PV collectively for RPL and RPDW. We found only six QTLs common between the present study and that of Khan et al. (Reference Khan, Tong, Wang, He, Zhao and Gai2019) including RSL11.1 that was also overlapped with a QTL mqCanopy-wilt-010 with the nearest sequence-based genetic marker at 5′ end position of 10,350,509 bp and 3′ end position of 10,836,168 bp on Chromosome 11 reported in the literature (www.soybase.org) portraying their functional relatedness with one another (Hwang et al., Reference Hwang, King, Chen, Ray, Cregan, Carter, Li, Abdel-Haleem, Matson, Schapaugh and Purcell2016) (online Supplementary Tables S2 and S3). Canopy wilting is an important quantitative parameter related to drought and delayed canopy wilting is a potential DT trait (Kaler et al., Reference Kaler, Ray, Schapaugh, King and Purcell2017). Therefore, out of 40 QTLs detected in the present study, only eight loci have been found to be reported for various traits. Thus, the remaining 32 QTLs are the novel regions detected by the RTM-GWAS. Such novel QTLs identified could be the good targets for more detailed analysis like fine mapping and consequently pyramiding to develop highly DT cultivars for drought-prone areas.
Implications of QTL-allele matrices and optimal genotype breeding design predictions for drought tolerance research
The present study demonstrated the far-reaching potential applications of the DT QTL-allele matrices obtained from RTM-GWAS analysis: to represent the DT genetic structure of the whole population which can be used for instant comparisons among other multiple sub-populations; to predict the optimal crosses for best recombinants; and to annotate and detect the drought-responsive candidate genes for understanding the gene networks involving with the biological processes. From the QTL-allele matrices, we found all the three parents possessed both positive and negative allele effects on the detected loci signifying the possibility of predicting the best genotype(s) through collecting the favourable alleles in the parents. Here the best genotypic value in the genetic constitution of the three parents was predicted as 1.820 and 1.299 for RRL and RSL, respectively, much greater than the parents' RRL and RSL values, indicating much greater potential that could be attained for a best DT genotype through recombination of the three parents and consequently pyramiding the best alleles into one individual.
Since all the four indictors, two from present study (i.e. RRL, RSL) and two from previous study (i.e. RPL and RPDW) of that of Khan et al. (Reference Khan, Tong, Wang, He, Zhao and Gai2019), were related to DT, we performed a joint prediction comprising of all four DT indicators to see an overall predicted progress (online Supplementary Table S8). The WAV for best genotype was 1.605 much greater than those of parents (0.636–0.738). While the top 10 optimal crosses had WAV ranged from 1.044 to 0.983 corresponding to first and 10th cross, respectively. However, in the present study, the WAV of the best predicted genotype for two studied DT indicators (RRL and RSL) was 1.553 (online Supplementary Table S7) and 1.663 (RPL and RPDW) from the study of Khan et al. (Reference Khan, Tong, Wang, He, Zhao and Gai2019). While in joint prediction treating all the four DT indicators as one set, it was 1.605 greater than 1.553 and almost parallel to 1.663 (online Supplementary Table S8).
Our mapping results have therefore two major implications for the breeding programs for developing DT cultivars, one is use of QTL-allele architecture (matrix) and another is for cross-design. However, this cross-prediction is based on additive effects only, which can be obtained from RTM-GWAS directly. Since the additive by additive epistasis effects were not included in the RTM-GWAS genetic model yet, this part of the progress was not considered at the present study. The next step for the improvement of the RTM-GWAS procedure is with the exploration of the additive by additive epistasis effect. Nonetheless, we have comprehensively elucidated the complete genetic architecture of the three parents and the best genotypes were predicted. Likewise, the 10 top optimal crosses have also been nominated that could be recommended to breeders.
These optimal crosses not necessarily cover all the best loci from the parents but definitely cover most of them that increasing the probability of getting the favourable amount of recombination. Thus through prediction of optimal crosses, the time and selection efficiency can greatly be improved. Furthermore, from the QTL-allele matrix, all kinds of genetic parameters can be obtained, such as QTL number, allele number, allele frequency, allele effect, genetic diversity, etc., and is much easier to apply than that of genomic selection which uses the training population that can be replaced with QTL-allele information (Korir et al., Reference Korir, Zhang, Wu, Zhao and Gai2013). By carefully designed program, breeders can select the most optimal crossing lines by predicting their breeding values and can ensure the accumulation of superior alleles in to a cultivar. Poor decisions at this stage can have strong repercussions for ultimate breeding success. Eventually, the characterization of QTL-allele system will have a considerable impact on plant breeding. There is no doubt that further advances are possible to improve not only the accuracy of genomic prediction, but also the efficiency with which such predictions can be made. The utility of such advances will have to be evaluated with a toolkit containing results from real and simulated data that need to be extensively validated.
Potential candidate genes already reported in the literature related to drought tolerance
Molecular and genomic studies have shown that several genes with various functions are induced by drought stress. From the QTL system in the half-sib population, we annotated the candidate gene system based on SoyBase (http://www.soybase.org). GO enrichment analysis revealed different sets of genes with distinctive protein products. For the two DT indicators, a DT-related candidate gene system comprising of 65 candidate genes was inferred, broadly categorized into nine biological terms. However, from the current study, 23 of the candidate genes were found to be cited in the literature (online Supplementary Table S11). The remaining genes are therefore still unreported.
Interestingly, the two indicators conferred by a similar yet different set of candidate genes involved with a similar series of biological processes although their contained candidate genes and frequencies were different from each other (Khan et al., Reference Khan, Tong, Wang, He, Zhao and Gai2018; Khan et al., Reference Khan, Tong, Wang, He, Zhao and Gai2019). Therefore, all the candidate genes should be the members of the DT genetic system. However, the two studied indicators are not necessary a complete set of the DT, so is for the detected QTL-allele system and the candidate gene system. Additional possible indicators as well as their QTL-alleles and candidate genes should be further identified, but the present results should cover the major part and thus the DT gene system must be a complex of multiple series of similar sets of biological processes.
Supplementary material
The supplementary material for this article can be found at https://doi.org/10.1017/S1479262120000313.
Acknowledgements
This work was supported by the National Key R & D Program for Crop Breeding in China (2017YFD0101500, 2017YFD0102002), the Natural Science Foundation of China (31701452, 31701447, 31671718), the MOE 111 Project (B08025), the MOE Program for Changjiang Scholars and Innovative Research Team in University (PCSIRT_17R55), the MOA CARS-04 program, the Jiangsu Higher Education PAPD Program, the Fundamental Research Funds for the Central Universities and the Jiangsu JCIC-MCP. The funders had no role in work design, data collection and analysis, and decision and preparation of the manuscript.
Author contribution
JG designed the research. TZ provided the seeds of the three parents along with their RILs and marker data; MAK, TF and WW performed the experiments. MAK and JH analysed the data. MAK and JG drafted the manuscript.
Conflict of interest
The authors have declared that no competing or conflicts of interest exist.