Introduction
Internationally, dairy producers are faced with the challenge of reducing greenhouse gas (GHG) emissions, which are the primary cause of global warming (Fisher et al., Reference Fisher, Nakicenovic, Alfsen, Corfee-Morlot, de la Chesnaye, Hourcade, Jiang, Kainuma, La Rovere, Matysek, Rana, Riahi, Richels, Rose, van Vuuren and Warren2007), while increasing production to satisfy growing demand (FAO, 2006). This issue has led to an increasing interest in reducing the carbon footprint (kg of GHG per unit of product) of dairy production. However, there are substantial differences associated with systems of dairy production and the methodologies used to calculate or audit their emissions.
The most frequently applied method to assess the carbon footprint of dairy production is life cycle assessment (LCA). LCA is a holistic systems approach that aims to quantify the potential environmental impacts, for example, GHG emissions generated throughout a product's life cycle, from raw-material acquisition through production, use, recycling and final disposal (ISO, 2006). Thus, for primary dairy production, LCA quantifies GHG emissions from all processes associated with the dairy farm up to the point milk is sold from the farm. The general framework and requirements of LCA are internationally standardised (ISO, 2006). In addition, specific guidelines based on international standards have recently been developed for applying LCA to assess the carbon footprint of dairy production (International Dairy Federation (IDF), 2010). However, LCA is not the recognised method for reporting the dairy sectors contribution to national GHG emissions. The standard method for reporting GHG emissions is the Intergovernmental Panel on Climate Change (IPCC) guidelines (IPCC, 1996 and 2006). The IPCC method, unlike LCA, quantifies GHG emissions using a national sector-based approach (Schils et al., Reference Schils, Verhagen, Aarts and Šebek2005). The approach estimates emissions from the production and consumption of goods within defined national boundaries and emissions from the production of goods exported from a nation, but does not consider emissions from the production of imported goods (Peters, Reference Peters2008).
The objectives of this paper were to compare the IPCC and LCA auditing methods to estimate the carbon footprint of grass and confinement dairy systems and evaluate the methodologies in estimating the footprint of pastoral dairy farms varying in cow genetic potential, stocking rate and level of concentrate feeding.
Material and methods
Dairy farm systems
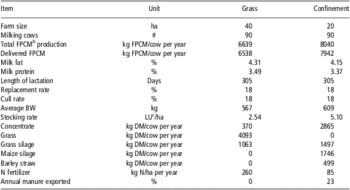
This study first evaluated the carbon footprint of a grass-based and a confinement dairy system (Table 1) based on a research trial conducted at Moorepark dairy research centre, Fermoy, Co Cork, Ireland. The design and results of the research trial have previously reported by Olmos et al. (Reference Olmos, Mee, Hanlon, Patton, Murphy and Boyle2009). Briefly, spring-calving Holstein–Friesian cows were blocked based on genetic merit, parity, expected calving date, body condition score and predicted milk yield and assigned randomly from within pairs to either the grass-based or confinement system. The aim of the grass-based system was to maximise the use of grazed grass in the feed budget of lactating dairy cows by targeting calving to commence in early spring (14 February) which is generally the onset of the grass-growing season. Grass silage was harvested on-farm when grass growth exceeded feed demand. The system was self-sufficient for forage. The fertiliser input (N) was 260 kg/ha. Grass silage and concentrate were offered during periods when pasture growth was unable to meet the nutritional requirements of the herd. The annual concentrate offered was 370 kg of dry matter (DM) per cow. Concentrate was mainly offered in early and late lactation.
Technical description of the seasonal grass-based dairy system (Grass) and the confinement dairy system (confinement)Footnote a

FPCM = fat- and protein-corrected milk; DM = dry matter.
a Data based on research of Patton et al. (Reference Patton, Murphy and Butler2009) and Olmos et al. (Reference Olmos, Mee, Hanlon, Patton, Murphy and Boyle2009).
b FPCM = (0.337 + 0.116 × %fat + 0.06 × %protein) × kg milk (Thomassen and de Boer, Reference Thomassen and de Boer2005).
c LU = livestock unit equivalent to 1 dairy cow.
Within the confinement system, cows were housed full time and fed a total mixed ration (TMR). However, replacement animals were only indoors during the winter period and grazed pasture during the growing season. Grass silage was harvested on-farm and any other feed used was imported. Holstein–Friesian cows were offered specific TMR diets during the dry period and lactation. The TMR offered was comparable in nutrient composition to TMR fed in other studies (Grainger et al., Reference Grainger, Auldist, O'Brien, Macmillan and Culley2009), apart from DM content, which was lower than other studies (Bargo et al., Reference Bargo, Muller, Delahoy and Cassidy2002).
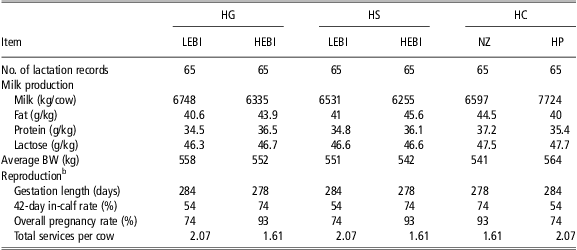
The carbon footprint of six contrasting pastoral dairy production systems, differing in genetic potential and type of pasture-based feed system were also assessed in this study (Table 2). The design of the study and production and reproduction data used in the analysis was previously reported by Horan et al. (Reference Horan, Mee, Rath, O'Connor and Dillon2004 and Reference Horan, Dillon, Faverdin, Delaby, Buckley and Rath2005). In short, two Holstein–Friesian genotypes were compared: high economic breeding index potential (HEBI) and low EBI potential (LEBI). The HEBI genotypes represented a breeding program where selection was based on improving a number of traits, for example, milk production, fertility and durability. The LEBI represented a breeding program where animals were selected solely for milk production. Cow genotypes were blocked and randomised across three grass-based feed systems; high grass allowance system (HG, control); high concentrate supplementation system (HC) and a high stocking rate system (HS). The HG system had an overall stocking rate of 2.47 cow/ha, N fertiliser input of 290 kg of N/ha and received 325 kg of DM concentrate per cow in early lactation. The HC system had a similar overall stocking rate and N fertiliser input as the HG system, but 1445 kg of DM concentrate was offered per cow per lactation, with a greater proportion in early spring. The HS system had a similar concentrate and N input as the HG system, but had an overall stocking rate of 2.74 cows/ha.
Milk production, BW and reproductive performance of two Holstein–Friesian genotypes (LEBI; HEBI) within the HG, HS and HC feed systemsFootnote a
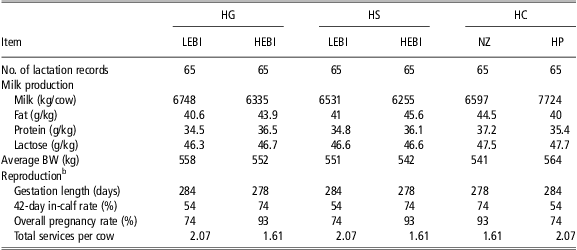
BW = body weight; LEBI = low economic breeding index potential; HEBI = high economic breeding index potential; HG = high grass allowance; HC = high concentrate; HS = high stocking rate.
a McCarthy et al. (2007).
b Breeding was initiated at, on average, 60 days in milk.
GHG modelling
GHG emissions were calculated using a dairy farm GHG model (O'Brien et al., Reference O'Brien, Shalloo, Buckley, Horan, Grainger and Wallace2011). The model estimates the dominant GHG emissions from dairy production: carbon dioxide (CO2), nitrous oxide (N2O), and CH4. The GHG model operates in combination with the Moorepark Dairy System Model (MDSM; Shalloo et al., Reference Shalloo, Dillon, Rath and Wallace2004), which defines key parameters (e.g. feed budgets) required for the GHG model to quantify emissions. The model uses two methods, LCA and the IPCC method, to quantify GHG emissions from dairy systems. The subsequent sections summarise how the LCA and IPCC methodologies were applied in the GHG model.
LCA methodology
The LCA method was applied to quantify emissions from all processes associated with dairy production up to the point milk is sold from the farm. The approach was implemented in the GHG model by combining input data from the MDSM with specific LCA GHG emission factors in Microsoft Excel. The emission factors used in this study have previously reported by O'Brien et al. (Reference O'Brien, Shalloo, Buckley, Horan, Grainger and Wallace2011 and Reference O'Brien, Shalloo, Patton, Buckley, Grainger and Wallace2012). In brief, the LCA emission factors for on-farm sources were obtained from the agricultural section of the Irish GHG national inventory (Duffy et al., Reference Duffy, Hyde, Hanley, Dore, O'Brien, Cotter and Black2011). On-farm sources of CO2 were estimated using emission factors from the IPCC (2006) guidelines and data from Nemecek and Kägi (Reference Nemecek and Kägi2007). The LCA emission factors for off-farm GHG sources (GHG emissions from the production and supply of purchased farm inputs, e.g. synthetic fertiliser) were obtained mainly from literature and databases included with the LCA software, SimaPro (Pré Consultants, 2010). The LCA approach did not consider GHG removals, because farm sinks were assumed to be in equilibrium.
The LCA method allocates GHG emissions between multifunctional processes (O'Brien et al., Reference O'Brien, Shalloo, Buckley, Horan, Grainger and Wallace2011), including the production of concentrate co-products, such as barley grain and straw, and the production of milk and meat on-farm. The procedures used to allocate GHG emissions between co-products were based on recently published LCA guidelines (IDF, 2010). For concentrate co-products, GHG emissions were allocated based on their relative economic values using data from Nemecek and Kägi (Reference Nemecek and Kägi2007), Central Statistics Office (CSO, 2011) and Ecoinvent (2010). For, milk and meat, GHG emissions were allocated based on the physiological feed requirements of the cow to produce milk and meat. The following equation from the (IDF, 2010) was used to calculate the allocation factor for milk and meat:
 $${\rm{AF}}\, = \,{\rm{1}}\,{\rm{ - }}\,{\rm{5}}{\rm{.7717}}\,\times \,\left( {{{M}_{{\rm{meat}}}}{\rm{/}}{{M}_{{\rm{milk}}}}} \right)$$
where AF is the allocation factor for milk, M meat the sum of BW of all animals including bull calves and culled mature animals and M milk the sum of mass of milk sold, corrected to 4% fat and 3.3% protein.
GHG emissions calculated using LCA were estimated in terms of their 100-year global warming potentials (CO2 equivalents; CO2-eq), which on a weight basis relative to CO2 was set to a factor of 25 for 1 kg of CH4 and 298 for 1 kg of N2O (IPCC, 2007). The main outputs of the LCA approach are a static account of dairy systems annual on-farm and total (on and off-farm) GHG emission in CO2-eq and the carbon footprint of dairy production expressed as kg of CO2-eq per kg of milk fat and protein (MS).
IPCC methodology
The sources of GHG attributed to dairy farming using the IPCC method are enteric fermentation, manure management and agricultural soils (N2O emissions from synthetic and organic fertiliser use, manure excreted by grazing cattle and N2O from ammonia re-deposition and nitrate leaching). The IPCC method was implemented in the GHG model using IPCC emission factors from the agriculture section of the Irish GHG national inventory (Duffy et al., Reference Duffy, Hyde, Hanley, Dore, O'Brien, Cotter and Black2011) and the parameters generated by the MDSM. The IPCC emission factors are categorised into different tiers, with each successive tier having an increased level of detail and accuracy. The Irish GHG inventory uses IPCC emission factors from different tiers to calculate emissions from dairy production. Thus, the IPCC method in the GHG model uses tier-1 emission factors to calculate N2O from agricultural soils and tier-2 emission factors to estimate CH4 from enteric fermentation and manure management (Duffy et al., Reference Duffy, Hyde, Hanley, Dore, O'Brien, Cotter and Black2011).
GHG emissions quantified using the IPCC method were estimated in terms of their 100-year global warming potential using the same procedure as described for the LCA method. The IDF (2010) physical causality approach was used to allocate GHG emission between milk and meat. The outputs of the IPCC approach are a static account of dairy systems annual GHG emission in CO2-eq and the carbon footprint of dairy production expressed as kg of CO2-eq per kg of MS.
Sensitivity analysis
GHG emissions reported as part of a countries agricultural sector are only relevant for primary dairy production using the IPCC method, but national emissions from dairy production are also reported in the energy, industrial and waste sectors (Crosson et al., Reference Crosson, Shalloo, O'Brien, Lanigan, Foley, Boland and Kenny2011). Thus, to completely assess the effect of applying different GHG auditing methods, the IPCC method was also applied to consider all national sources of GHG emissions associated with dairy production. This was achieved using emission factors from the relevant sectors of the Irish GHG national inventory (Duffy et al., Reference Duffy, Hyde, Hanley, Dore, O'Brien, Cotter and Black2011) and data from the research study of Olmos et al. (Reference Olmos, Mee, Hanlon, Patton, Murphy and Boyle2009) previously described, which compared a grass-based and a confinement dairy system.
Results
Carbon footprint of grass-based and confinement dairy systems
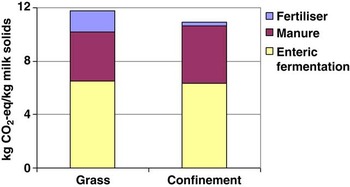
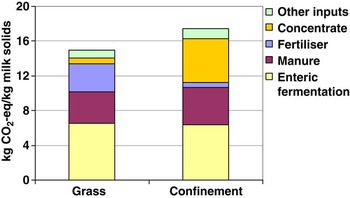
The comparison of the grass-based and confinement dairy systems showed that the carbon footprint was 8% lower for the confinement system using the IPCC method (Figure 1), but the LCA comparison showed that the carbon footprint of the confinement system was 16% higher than the grass-based system (Figure 2). The LCA results showed that the main contributors to total (on and off-farm) GHG emissions in the grass-based system were CH4 from enteric fermentation (44%), N2O emission from excreta deposited during grazing (13%), GHG emissions associated with the production of fertiliser (10%) and N2O from synthetic fertiliser application (9%). Enteric fermentation was the greatest contributor to on-farm GHG emissions (54%) in the grass-based system followed by N2O from excreta deposited during grazing (16%), and N2O from fertiliser application (11%). Off-farm GHG emissions consisted mainly of GHG emissions from the production of fertiliser (57%) and concentrate feed (26%).
The carbon footprint of a grass-based and a confinement dairy system calculated using the Intergovernmental Panel on Climate Change (IPCC) method.

The carbon footprint of a grass-based and a confinement dairy system calculated using life cycle assessment (LCA).

The main contributors to total GHG emissions in the confinement system, based on the LCA approach, were CH4 from enteric fermentation (36%), GHG emissions from the production of concentrate (25%) and CH4 from manure storage (20%; Figure 1). On-farm GHG emissions in the confinement system were mainly from enteric CH4 (57%). Methane from manure storage was the next largest source of on-farm GHG emissions (31%). The production of concentrate feed was the main source of off-farm GHG emissions (69%) followed by CO2 from electricity, fuel and lime production (15%). The main sources of GHG emissions from concentrate production were CO2 from the conversion of rainforest to agricultural land (35%), GHG emissions from energy and fertiliser production (17%), CO2 from agricultural field operations and transport of feed (15%) and N2O from fertiliser application (12%).
The dominant sources of GHG emissions in the grass-based system according to the IPCC method were CH4 from enteric fermentation (55%) and manure storage (9%), N2O from manure excreted by grazing cattle (16%) and N2O from synthetic fertiliser application (11%; Figure 2). Methane from enteric fermentation (58%) and N2O and CH4 from manure storage (33%) were the main contributors to GHG emissions in the confinement system (Figure 2).
Effect of genotype, stocking rate and concentrate feeding on grass-based dairy systems carbon footprint
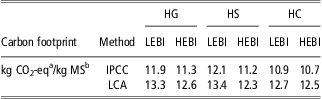
The IPCC approach found that on average, the carbon footprint for the HG and HS feed systems was similar, but the HC feed system had a lower carbon footprint (Table 3). In all feed systems, the HEBI genotype produced a lower carbon footprint than the LEBI genotype. For the LEBI genotype, the lowest carbon footprint was produced in the HC feed system and highest in the HS feed system. The HEBI genotype achieved their lowest carbon footprint in the HC feed system and highest carbon footprint in the HG feed system. The LCA method showed that on average the HC feed system produced the lowest carbon footprint followed by the HS and HG feed systems. The HEBI genotype produced a lower carbon footprint than the LEBI genotype in all feed systems. For the LEBI genotype, the lowest carbon footprint was produced in the HC feed system and highest in the HS feed system. The HEBI genotype achieved their lowest carbon footprint in the HS feed system and highest carbon footprint in the HG system.
The IPCC method and LCA quantified carbon footprint of two Holstein–Friesian genotypes (LEBI; HEBI) within the HG, HS and HC feed systems
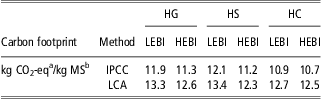
IPCC = Intergovernmental Panel on Climate Change; LCA = life cycle assessment; LEBI = low economic breeding index; HEBI = high economic breeding index; HG = high grass allowance; HS = high stocking rate; HC = high concentrate.
aCO2-eq = CO2 equivalent.
bMilk solids = kg of milk fat plus protein.
The largest source of GHG emissions for all grass-based systems regardless of method was enteric fermentation (50% to 56%). The LCA method found that the next most significant sources of emissions were from fertiliser production and application, manure excreted by grazing cattle and manure storage and spreading. The LCA approach also found concentrate production was an important source of emissions (10%) in the HC feed system. The IPCC approach found the largest sources of emissions excluding enteric fermentation for all dairy systems were manure deposited on pasture, manure storage and fertiliser use. The LCA method showed that the proportion of GHG emissions from off-farm sources increased by 4% moving from the HG and HS feed system to the HC feed system and that genotype had little effect. The IPCC approach found neither feed system nor genotype had an effect on the proportion of GHG emissions from off-farm sources.
Sensitivity analysis of IPCC method
The application of the IPCC method to quantify all national sources of GHG emissions associated with dairy production increased the carbon footprint of the grass-based system reported in Figure 1 by 8% to 12.75 kg CO2-eq/kg MS and increased the carbon footprint of the confinement system in Figure 2 by 16.5% to 12.71 kg CO2-eq/kg MS. The main cause of the increase in emissions was the inclusion of national emissions from electricity generation and fuel use. Energy usage per kg of MS was greater for the confinement system compared with the grass-based, which explains the greater increase in emissions for the confinement system. Nevertheless, the ranking of the carbon footprint of dairy systems did not change by applying the IPCC method to consider all national sources of GHG emissions.
Discussion
Previous studies that have analysed the carbon footprint of dairy systems have generally applied environmental system analysis approaches such as LCA, for example Arsenault et al. (Reference Arsenault, Tyedmers and Fredeen2009) and Rotz et al. (Reference Rotz, Montes and Chianese2010). The IPCC method of quantifying agricultural GHG emissions has rarely been used to assess emissions from these different systems of dairy production (Schils et al., Reference Schils, Verhagen, Aarts, Kuikman and Šebek2006; Browne et al., Reference Browne, Eckard, Behrendt and Kingwell2011). Thus, the application of the LCA and IPCC methods in this study provides a unique opportunity to determine if these methods agree on their predictions of the carbon footprint of contrasting dairy production systems.
Effect of grass and confinement dairy systems on GHG emissions
In agreement with previous studies, the LCA and IPCC methods agreed that CH4 from enteric fermentation was the main cause of on-farm GHG emissions for seasonal grass-based and confinement dairy systems (Flysjö et al., Reference Flysjö, Henriksson, Cederberg, Ledgard and Englund2011; O'Brien et al., Reference O'Brien, Shalloo, Buckley, Horan, Grainger and Wallace2011). Both methods also agreed with previous studies that the other main sources of on-farm GHG emissions for the grass-based system were N2O from manure excreted by grazing cattle and N2O emission from fertiliser application (Schils et al., Reference Schils, Verhagen, Aarts, Kuikman and Šebek2006; Basset-Mens et al., Reference Basset-Mens, Ledgard and Boyes2009). In addition, the IPCC and LCA methods supported previous analysis, that on-farm GHG emissions in the confinement system were emitted mainly from manure storage when enteric CH4 emission was omitted (Arsenault et al., Reference Arsenault, Tyedmers and Fredeen2009; Rotz et al., Reference Rotz, Montes and Chianese2010). Thus, excluding enteric CH4, the main sources of on-farm GHG emissions differed between dairy systems. The contribution of on-farm sources to GHG emissions varied between systems, because of differences in the length of the grazing season and the proportion of feed produced on-farm. Therefore, specific approaches should be developed to achieve the largest reduction in on-farm GHG emissions from grass-based and confinement dairy systems.
Numerous studies have reported that feed intake is the principal driver of enteric CH4 emissions from cattle (Hegarty et al., Reference Hegarty, Goopy, Herd and McCorkell2007; O'Neill et al., Reference O'Neill, Deighton, O'Loughlin, Mulligan, Boland, O'Donovan and Lewis2011). Furthermore, feed intake is also a key factor required to quantify CH4 and N2O emissions from manure (Basset-Mens et al., Reference Basset-Mens, Ledgard and Boyes2009). Therefore, both methods showed, that on-farm GHG emissions per livestock unit (LU) was greater (9%) for the confinement system than the grass-based system, because grass-fed cows produced 18% less milk per LU and thus consumed 16% less feed. Nevertheless, per kg of MS, both methods observed that on-farm GHG emissions were greater for the grass-based system than for the confinement system. This was because TMR-fed Holstein–Friesian cows in the confinement system produced about 2.4 times more milk per on-farm ha and 21% more milk per LU than forage-fed cows.
The LCA method also quantifies off-farm GHG emissions related to dairy systems. Congruous with previous studies, CO2 and N2O emissions from the cultivation and transport of imported feed and GHG emissions from the manufacture of synthetic N fertiliser were the main contributors to off-farm GHG emissions (Thomassen et al., Reference Thomassen, van Calker, Smits, Iepema and de Boer2008; Van der Werf et al., Reference van der Werf, Kanyarushoki and Corson2009). Off-farm GHG emissions from the grass-based system were less than half of those from the confinement system, because the confinement system consumed more imported feedstuffs than the grass-based system. As a consequence of the large difference between dairy systems off-farm GHG emissions, the LCA approach found, that the increase in milk yield per LU moving from the grass-based system to the confinement system (21%) was less than the increase in total GHG emission per LU (38%). Thus, similar to previous studies, the carbon footprint was higher for the confinement system than the grass-based system (Rotz et al., Reference Rotz, Soder, Skinner, Dell, Kleinman, Schmidt and Bryant2009; Flysjö et al., Reference Flysjö, Henriksson, Cederberg, Ledgard and Englund2011).
Effect of methodology on dairy systems carbon footprint
The IPCC method, unlike the LCA approach, does not attribute GHG emissions from the production of farm imports to primary dairy production, because these emissions are outside national boundaries or attributed to another sector, such as energy (Schils et al., Reference Schils, Verhagen, Aarts and Šebek2005). Excluding off-farm GHG sources associated with dairy production would not matter if farming systems always ranked the same whether the IPCC or LCA methods were used. For example, our study found that excluding off-farm GHG sources had no effect on the ranking of dairy systems carbon footprint when assessed per LU. However, when the carbon footprint was expressed per kg of MS, the IPCC method indicated that the grass system had higher emissions, but the LCA approach showed that the grass system had lower emissions. The different ranking of dairy systems carbon footprint using the IPCC and LCA method agrees with previous work and can be explained by the exclusion of emissions associated with upstream production chains (e.g. imported feedstuffs) using the IPCC method (O'Brien et al., Reference O'Brien, Shalloo, Buckley, Horan, Grainger and Wallace2011 and Reference O'Brien, Shalloo, Patton, Buckley, Grainger and Wallace2012).
The disagreement between the IPCC and LCA methods highlights that it is incorrect to only consider certain on-farm components of the dairy system relevant for policy reporting (Schils et al., Reference Schils, Verhagen, Aarts, Kuikman and Šebek2006; O'Brien et al., Reference O'Brien, Shalloo, Buckley, Horan, Grainger and Wallace2011 and Reference O'Brien, Shalloo, Patton, Buckley, Grainger and Wallace2012). Instead, whole-farm approaches such as LCA give a more realistic assessment of GHG emissions from differing dairy production systems. Holistic approaches increase emissions attributed to dairy systems relative to approaches that consider only part of the production system, but are more likely to ensure that GHG emissions are reduced and not transferred to another part of the production system (carbon leakage). The shortfall of the IPCC method for assessing GHG emissions from different dairy systems does not mean the approach should no longer be used to report national GHG emissions (Schils et al., Reference Schils, Verhagen, Aarts, Kuikman and Šebek2006; Crosson et al., Reference Crosson, Shalloo, O'Brien, Lanigan, Foley, Boland and Kenny2011). However, to achieve a reduction in GHG emissions, reform of the IPCC method is needed given the problems identified in our study and previous studies (Peters, Reference Peters2008; Peters and Hertwich, Reference Peters and Hertwich2008).
Consequently, it has been suggested that countries should quantify GHG emissions associated with national consumption (production and imports minus exports) in addition to estimating GHG emissions produced within a nation (Peters, Reference Peters2008; Peters and Hertwich, Reference Peters and Hertwich2008). This approach would overcome some of the problems with the present IPCC method, such as carbon leakage and credit dairy practices that reduce emissions in other sectors or nations. However, consumption-based national GHG accounting would require decisions to extend outside geopolitical boundaries, which is a significant barrier to the implementation of the approach (Peters, Reference Peters2008). Furthermore, consumption-based national GHG inventories require more assumptions and data, thereby increasing uncertainty and reducing the accuracy of GHG national inventories.
Influence of genotype on grass-based dairy systems carbon footprint
Regardless of methodology selecting animals solely for milk production caused the carbon footprint of dairy production to increase through a rise in emissions from non-productive animals and a consequent decrease in farm milk. The increases observed in emissions per kg of MS for animals with higher genetic potential for milk are similar to the findings of Lovett et al. (Reference Lovett, Shalloo, Dillon and O'Mara2006). Therefore, based on these findings, continuing to increase the genetic merit of Holstein–Friesian cows for milk yield alone will cause the carbon footprint of dairy production to increase. However, if the fertility of Holstein–Friesians cows with high genetic merit for milk yield (LEBI genotype) improved (similar to HEBI genotype), this could lead to substantial reductions in the carbon footprint of dairy products. In Ireland, selection indexes for breeding have changed from selecting solely for milk performance to selecting based on combination of milk production, fertility and health traits. It is anticipated, based on these result that this change will contribute to reducing the carbon footprint of dairy production.
Conclusion
This study highlights that it is incorrect to consider only components of the dairy system relevant for policy reporting such as that used by IPCC when estimating the carbon footprint of dairy produce. Instead, LCA methods which consider on and off-farm GHG emissions should be used. Thus, reform of the present policy framework is needed to enable quantification of the impact of mitigation strategies on global emissions. The findings of our analysis also show that selecting dairy cows only for increased milk production will increase the carbon footprint of dairy production relative to cows selected on a combination of production and reproductive traits.
Further information
The Dairy Solutions Symposium is a biennial event that covers a wide variety of themes and topics of relevance and importance to the dairy industry. The aim is to provide high level, up-to-date information and research to dairy professionals, technologists and scientists. In 2012, the theme addressed the biggest challenge facing all those involved in dairy production: optimising production efficiency while lowering environmental impact. For more information, please visit www.dairycowsolutions.com or contact dairycowsolutions@alltech.com.