Introduction
Megaherbivores have been a central part of the Earth’s ecosystems since they started to take on their current forms (Malhi et al. Reference Malhi, Doughty, Galetti, Smith, Svenning and Terborgh2016, Terborgh et al. Reference Terborgh, Davenport, Niangadouma, Dimoto, Mouandza, Scholtz and Jaen2016). Weighing a few hundred to a few thousand kilograms, these animals require large amounts of food. As such, megaherbivores create an important selective pressure on plant community diversity (Terborgh et al. Reference Terborgh, Davenport, Niangadouma, Dimoto, Mouandza, Scholtz and Jaen2016), life history (Grubb Reference Grubb and Edwards1996) and nutrient cycling (McNaughton et al. Reference McNaughton, Banyikwa and McNaughton1997, Ripple et al. Reference Ripple, Newsome, Wolf, Dirzo, Everatt, Galetti, Hayward, Kerley, Levi and Lindsey2015, Smart et al. Reference Smart, Hatton and Spence1985). However, most studies targeting these issues are conducted in ecosystems where large megafauna are greatly reduced or have disappeared, which complicates interpretation. For example, humans eradicated most megaherbivores from the Americas over 10 000 years ago (Gill et al. Reference Gill, Williams, Jackson, Lininger and Robinson2009), which affected biogeochemical cycling and nutrient heterogeneity (Doughty et al. Reference Doughty, Wolf and Malhi2013, Ripple et al. Reference Ripple, Newsome, Wolf, Dirzo, Everatt, Galetti, Hayward, Kerley, Levi and Lindsey2015).
Elephant species are one of the few remaining megaherbivores. However, forest elephant (Loxodonta cyclotis, Matschie, 1900) populations declined by 62% between 2002 and 2011, its population is now only 10% of what it was historically, and it occupies less than 25% of its original range (Maisels et al. Reference Maisels, Strindberg, Blake, Wittemyer, Hart, Williamson, Aba’a, Abitsi, Ambahe and Amsini2013, Poulsen et al. Reference Poulsen, Koerner, Moore, Medjibe, Blake, Clark, Akou, Fay, Meier and Okouyi2017, Smith et al. Reference Smith, Biggs, St John, Sas-Rolfes and Barrington2015). Some classic studies document the elephant’s role in savanna grassland and woodland ecosystems (Dublin et al. Reference Dublin, Sinclair and McGlade1990, Guldemond & Van Aarde Reference Guldemond and Van Aarde2008), but their role in forest ecosystems has not been thoroughly evaluated (but see Blake Reference Blake2003, Blake et al. Reference Blake, Deem, Mossimbo, Maisels and Walsh2009, Breuer et al. Reference Breuer, Maisels and Fishlock2016, Poulsen et al. Reference Poulsen, Rosin, Meier, Mills, Nunez, Koerner, Blanchard, Callejas, Moore and Sowers2018).
While the role of elephant species in forests as seed dispersers has received attention (Blake et al. Reference Blake, Deem, Mossimbo, Maisels and Walsh2009, Campos-Arceiz & Blake Reference Campos-Arceiz and Blake2011), their role in nutrient recycling and seedling growth is not well known. In general, large animals are thought to play an important role in accelerating ecosystem biogeochemical cycling (McNaughton et al. Reference McNaughton, Banyikwa and McNaughton1997, Ripple et al. Reference Ripple, Newsome, Wolf, Dirzo, Everatt, Galetti, Hayward, Kerley, Levi and Lindsey2015). In savanna systems, they have been shown to encourage quick nutrient cycling through their foraging (McNaughton et al. Reference McNaughton, Banyikwa and McNaughton1997). Soils in tropical rain forests are usually poor, as nutrients are recycled quickly back into plant materials (Sugihara et al. Reference Sugihara, Shibata, Ze, Araki and Funakawa2015). Plant growth can therefore be nutrient-limited and the addition of nitrogen (N), phosphorus (P) and potassium (K) can increase seedling growth (Bloom et al. Reference Bloom, Chapin and Mooney1985, Santiago et al. Reference Santiago, Wright, Harms, Yavitt, Korine, Garcia and Turner2012, Wright et al. Reference Wright, Yavitt, Wurzburger, Turner, Tanner, Sayer, Santiago, Kaspari, Hedin, Harms, Garcia and Corre2011). For example, in a lowland tropical forest in Panama, the addition of K enhanced tissue nutrient concentration, increasing herbivory, reducing root-to-shoot biomass ratio, and increasing height growth, even under highly shaded conditions (Santiago et al. Reference Santiago, Wright, Harms, Yavitt, Korine, Garcia and Turner2012). African elephants consume on average from 140–200 kg of food per day and produce about 40 kg of dung daily (Ruggiero Reference Ruggiero1992). Savanna elephant dung has been estimated to contain about 1.3% N, 0.2% P and 0.6% K. Depending on elephant density, this means that elephant species potentially provide considerable amounts of fertilizer with appreciable levels of N, P and K relative to soil levels (Dougall Reference Dougall1963; the appropriateness of such values from savanna to forest systems needs to be evaluated).
Our objective was to conduct a controlled plant growth experiment to examine the impact of elephant dung on the growth and survivorship of young plants in the field. However, different species have different growth patterns due to differential resource allocation (Marenco et al. Reference Marenco, Goncalves and Vieira2001, Santiago et al. Reference Santiago, Wright, Harms, Yavitt, Korine, Garcia and Turner2012, Zanne & Chapman Reference Zanne and Chapman2005, Zanne et al. Reference Zanne, Chapman and Kitajima2005) and recruitment strategies (Coley Reference Coley1983). An important distinction exists between light-demanding and shade-tolerant species: light-demanding species are better adapted to recruit in gaps and are expected to use new resources mainly for above-ground growth, while shade-tolerant seedlings are expected to invest more in roots and defensive mechanism (e.g. repellents) (Grubb Reference Grubb1977, Richards Reference Richards1996, Wright Reference Wright2002). Furthermore, these different strategies might vary depending on the size of a plant (e.g. a small plant might invest more resources into growth, as opposed to maintenance, than a larger one). To account for these expected differences in growth patterns, we tested for the effect of dung treatment on plant growth (height and number of leaves) and survival over 1 y dependent on the initial size and type of a plant (light-demanding vs. shade-tolerant).
Materials and methods
Study site and experimental setup
We conducted our study between April 2016 and May 2017 in Kibale National Park, Uganda (795 km2). Kibale is a mid-altitude (920–1590 m), moist-evergreen forest that receives an annual rainfall of 1676 mm (1990–2016) in two rainy seasons (Chapman & Lambert Reference Chapman and Lambert2000). Recently, elephant numbers have risen dramatically in Kibale, faster than possible through births alone, so there has likely been some migration into the park (Omeja et al. Reference Omeja, Lawes, Corriveau, Valenta, Sarkar, Paim and Chapman2016). Elephant populations in Kibale comprise three distinct groups: savanna elephants, forest elephants, and hybrids between the two species (Mondol et al. Reference Mondol, Moltke, Hart, Keigwin, Brown, Stephens and Wasser2015). Forest elephants have moved through Uganda in the past (Brooks & Buss Reference Brooks and Buss1962), but they have now settled in Kibale, possibly because movement through the humanized landscape is no longer possible and because social groups have been disrupted by poaching (Keigwin et al. Reference Keigwin, Wabukawo, Wasser and Chapman2016).
In April 2016, we set up 10 pairs of plots (4 × 4 m), each pair was one treatment and one control, in 10 experimental sites in an area of old-growth forests. The control plot was placed 15 m away in a random direction. Each pair of plots were separated by at least 40 m from one another and at least 10 m away from any trail, tree fall gap, or other type of disturbance. If the random direction chosen for the control plot was within 10 m of a trail, tree fall gap, or other type of disturbance, or if the slope or habitat type appeared different, we randomly selected a new direction. Dung from the previous night was collected and placed in the middle of each 1 × 1-m subplot in the 4 × 4 m experimental plots. The volume of a typical adult dung pile was estimated to be 7 litres and a bucket of this volume was used in the collections. At the time of collection, the elephants were not feeding on any large-seeded fruits, such as Balanites wilsoniana (Chapman et al. Reference Chapman, Chapman and Wrangham1992), which would have made volumes inappropriate, nor did the dung contain any large branch segments. The amount of dung placed in the plot was relatively large, as we wanted to ensure that any potential effects would be induced on the seedlings.
Within each 4 × 4-m plot, we selected 30 apparently healthy seedlings between 30 and 100 cm (average height = 63.3 cm) on an ad hoc basis regardless of species. We measured seedling height from ground level (clearing fallen leaves) to the tip of the main stem and counted the number of leaves. We then placed and secured a labelled tag on the forest floor next to it to enable the same seedling to be found the next year. In May 2017, we returned to the plots, located the seedlings, remeasured their height, and recounted the number of leaves. If the seedling had died, this was noted and no measurements were made.
Data analyses
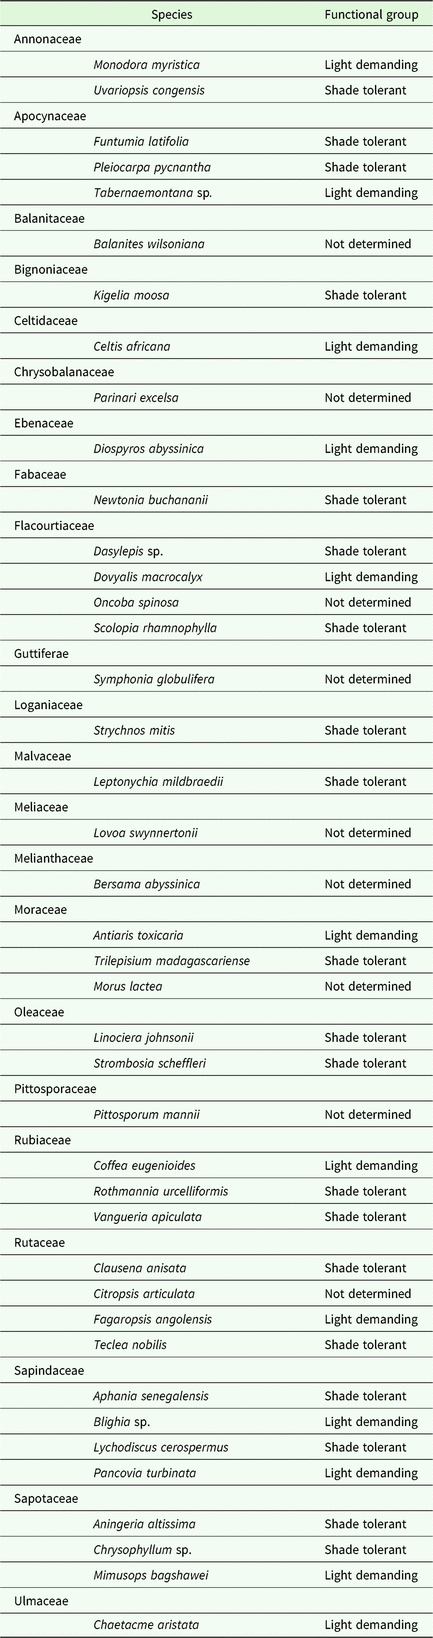
For the analysis of plant growth, we considered species either as light-demanding or shade-tolerant species (Table 1) (Hamilton Reference Hamilton1991, Zanne & Chapman Reference Zanne and Chapman2005, Zanne et al. Reference Zanne, Chapman and Kitajima2005) and excluded all plants for which this was unknown. Furthermore, for the growth analysis, we excluded (1) all plants that died; (2) all plants that lost more than 2 cm because this is more likely explained by measurement error and damage to the plant (i.e. herbivory) than no growth; and (3) plants without leaves in the second year because these plants represented clear outliers of the model residuals. In total, we were able to include 439 plants. We included between 20 and 27 plants in each of the 10 plots treated with elephant dung (mean ± SD = 22.3 ± 2.3) and between 12 and 26 plants in each of the control plots (mean ± SD = 21.6 ± 4.4). These 439 plants belonged to 31 species: 12 light-demanding and 19 shade-tolerant species. Considering the distribution of different plant types across plots, we included 53 light-demanding and 170 shade-tolerant plants in the experimental plots, and 48 light-demanding and 168 shade-tolerant plants were included in the control plots.
Species considered as light-demanding or shade-tolerant, for the analysis of plant growth contrasting areas in Kibale National Park, Uganda, where elephant dung was added relative to controls (Hamilton Reference Hamilton1991, Zanne & Chapman Reference Zanne and Chapman2005, Zanne et al. Reference Zanne, Chapman and Kitajima2005)

The data set for the analysis of plant survival was slightly different. Here, we included plants that died, plants with ‘negative growth’, and plants that had no foliage in the second year because we were merely interested whether a plant survived between the two years. Furthermore, we included plants for which the plant type was unknown, which was not considered in the analysis of plant growth. In total, we included 574 plants of 32 species: 289 in the control plots, and 285 in the elephant-dung plots. For each of the 10 plots treated with elephant dung, we included between 27 and 30 plants (mean ± SD = 28.5 ± 0.97), and for each of the control plots between 26 and 30 plants (mean ± SD = 28.9 ± 1.37).
We computed mixed models to analyse whether and how the treatment of plants with elephant dung affected their growth depending on the type of the plant and the survival of plants in general. For growth, we used either height or leaves in 2017 as dependent variables (Measurement2017), and the treatment (control vs. dung) and type of plant (light vs. shade) as independent variables. Furthermore, we included either height or number of leaves in 2016 (Measurement2016) as independent variable to control for differences between plants in initial size/number of leaves. Because one of our questions was whether treatment affected plant growth depending on species type, and whether this effect is dependent on the initial size/number of leaves of the plant, we tested for the effect of the three-way interaction Treatment:Type:Measurement2016. Accordingly, the structure of the full model was:
 $$\eqalign{ {\rm Measurement}_{2017} & \sim {\rm Treatment} + {\rm Type} + {\rm Measurement}_{2016} + \cr & {\rm Treatment:Type:Measurement}_{2016} + \cr & {\rm Treatment:Type} + {\rm Treatment:} \cr & {\rm Measurement}_{2016} + {\rm Type:Measurement}_{2016}} $$
With regard to random effects, we included Species and Site as random intercepts and the random slopes Measurement2016|Site and Measurement2016|Species to account for differential growth rates of plant of different species and at different sites (e.g. because of differences in micro-climate or soil composition).
We calculated all mixed models in R v.3.5.1 using the package lme4 v1.1-17 (R-Core-Team 2018). We built Gaussian linear mixed models for growth in height and leaves, and a binomial linear mixed model for the survival of plants using the lmer and glmer functions of the lme4 package v1.1-17 (Bates et al. Reference Bates, Mächler, Bolker and Walker2014) in R v.3.5.1. We used Maximum Likelihood (ML) rather than Restricted Maximum Likelihood (REML) to fit the models (Bolker et al. Reference Bolker, Brooks, Clark, Geange, Poulsen, Stevens and White2009). Although leaves represent a count variable, we did not use a Poisson regression because the number of leaves in the previous year was included as an independent variable. Thus, using such a model with a log-link function would have assumed that the link between the two years is log(Leaves2017) ~ β*Leaves2016 with β the coefficient estimated by the linear model (all other terms were excluded to simplify the formula). We considered this as a less reasonable assumption than a linear relationship in the number of leaves between the two years. Before running the models, Height2017 and Leaves2017 were both cube-root transformed to improve the normality of the model residuals. We also cube-root transformed the same measurement from the year before (Height2016 and Leaves2016) to maintain the direct relationships of these variables between the two years. Furthermore, we standardized Height2016 and Leaves2016 to a mean of 0 and SD of 1 to improve model convergence. For the model testing for the effect of elephant dung on plant survival, we only included treatment but not type of the plant as independent variable because only a few plants died (23/574) and we did not have dead plants in all tested conditions.
Results
We did not detect any effect of elephant dung on plant growth. The full model estimating the effect of the three-way interaction Treatment:Type:Height2016 on Height2017 was significantly better than the null model only including Height2016 as a fixed effect ( ${\chi _6}^2 = 15.8,{\rm{P}} \,\lt\, 0.05$). However, the three-way interaction had no significant effect on Height2016 (
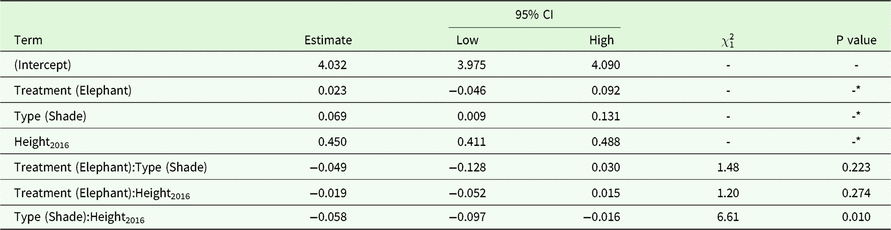
 ${\chi _1}^2 = 1.5,{\rm{P}} = 0.225$). A further investigation of the effect of elephant dung on plant growth excluding the three-way interaction (which tested for plant-size specific growth effects of experimental condition) revealed that only the interaction Type:Height2016 was significantly related to Height2017, but not the other two interactions (Treatment:Type and Treatment:Height2016) (Table 2). Thus, the only effect found was that light-demanding species were growing faster than shade-tolerant species.
Results of a linear mixed model investigating the effects of elephant dung treatment and plant type on plant growth from 2016 to 2017 in Kibale National Park, Uganda. The dependent variable was Height2017, and the independent variables included Height2016, Treatment (with the two levels ‘control condition’ and ‘elephant dung condition’), Type (with the two levels light-demanding species and shade-tolerant species), and the three potential interactions between these variables. Height2017 and Height2016 were cube-root transformed before running the model. Additionally, standardized z-scores were calculated for  $\root 3 \of {Heigh{t_{2016}}}$ (original mean ± SD of
 $\root 3 \of {Heigh{t_{2016}}} = 3.91 \pm 0.424\,\root 3 \of {{\rm{cm}}} $). The 95% confidence intervals (CI) were calculated using the function confint.merMod (from the lme4 package) using the profile method

* The P-values for these main effects are not reported because the interaction comprising this term is included in the model. Therefore, such P-values have only a limited interpretability and they are also not possible to calculate with a likelihood ratio test.
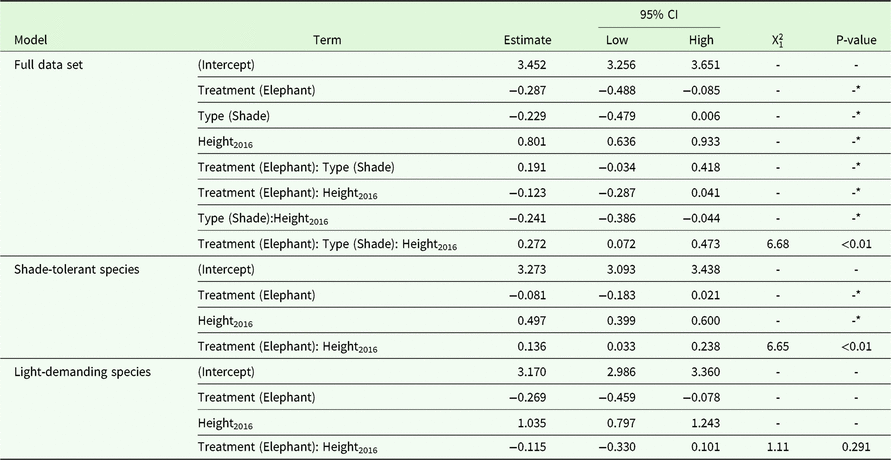
The addition of elephant dung affected the change in the number of leaves, but only for shade-tolerant species, and the direction and the size of this effect was dependent on the initial number of leaves. The full model estimating the effect of dung treatment on the change in number of leaves including the three-way interaction Treatment:Type:Leaves2016 was significantly better than the null model only comprising Leaves2016 as a fixed effect ( ${\chi _6}^2 = 19.7, {\rm{P}} \,\lt\, 0.01$). Additional tests showed that the three-way interaction was significantly related to the number of leaves in 2017 (Table 3, Model a). We divided the data into two subsets, one with only shade-tolerant species and the other with light-demanding species, and ran models on these two data sets. The results indicated there was only an effect of treatment on number of leaves with the size and direction of the effect depending on the initial number of leaves for shade-tolerant (Table 3, model b), but not for light-demanding species (Table 3, model c).
Results of a linear mixed model with Leaves2017 as the response variable from a field experiment conducted in Kibale National Park, Uganda. The dependent variable Treatment had the two levels ‘control condition’ and ‘elephant dung condition’. The variable Type had the two levels light-demanding species and shade-tolerant species. Leaves2017 and Leaves2016 were cube-root transformed before running the model. Additionally, standardized z-scores were calculated for  $\root 3 \of {{\rm{Leave}}{{\rm{s}}_{2016}}} $ (original means ± SD of
 $\root 3 \of {{\rm{Leave}}{{\rm{s}}_{2016}}} $: model
 ${\rm{a}} = 3.02{\rm{ }} \pm {\rm{ }}0.758\,\root 3 \of {{\rm{Leaves}}}$; model
 ${\rm{b}} = {\rm{ }}3.10{\rm{ }} \pm {\rm{ }}0.677\,\root 3 \of {{\rm{Leaves}}}$; model
 ${\rm{c }} = {\rm{ }}2.74{\rm{ }} \pm 0.934\,\root 3 \of {{\rm{Leaves}}}$). The 95% confidence intervals (CI) were calculated using the function confint.merMod (from the lme4 package) using the profile method

* See caption of Table 1 for an explanation.
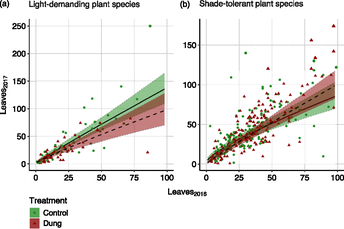
Shade-tolerant plants treated with elephant dung and only a few leaves in the first year grew fewer leaves than control plants (Figure 1). For examples, plants with 10 leaves in the first year were predicted to have 12.5 leaves in the second year when treated with elephant dung, but 17.3 leaves when not treated with dung. Plants with approximately 50 leaves in the first year were predicted to show, on average, no change in leaf numbers independent of treatment. Plants with about 100 leaves in the first year and treated with dung were also predicted to show no change in average number of leaves, however, control plants lost on average 13.5 leaves.
Changes in the number of leaves depending on the treatment and initial number of leaves for light-demanding plant species (a) and shade-tolerant plant species (b); based on an experiment in Kibale National Park, Uganda. The solid (control) and dashed (elephant dung treatment) lines illustrate the predictions for Leaves2017 from a model in Table 2. The dotted lines depict the bootstrapped 95% confidence intervals (n = 1000 bootstraps). The model was calculated with cube-root transformed Leaves2017 and Leaves2016 values, and  $\root 3 \of {{\rm{Leave}}{{\rm{s}}_{2016}}} $ was scaled to a mean of 0 and SD of 1. However, to improve the interpretability of the plot Leaves2016 and Leaves2017 are shown on its original scale. Furthermore, five data points with more than 100 leaves in 2016 were excluded from the plot, three of which were for light-demanding species (Leaves2016 = 113, 152 and 274, and Leaves2017 = 225, 172 and 282, respectively) and two for shade-tolerant species (Leaves2016 = 106, 111, Leaves2017 = 192, 106, respectively).

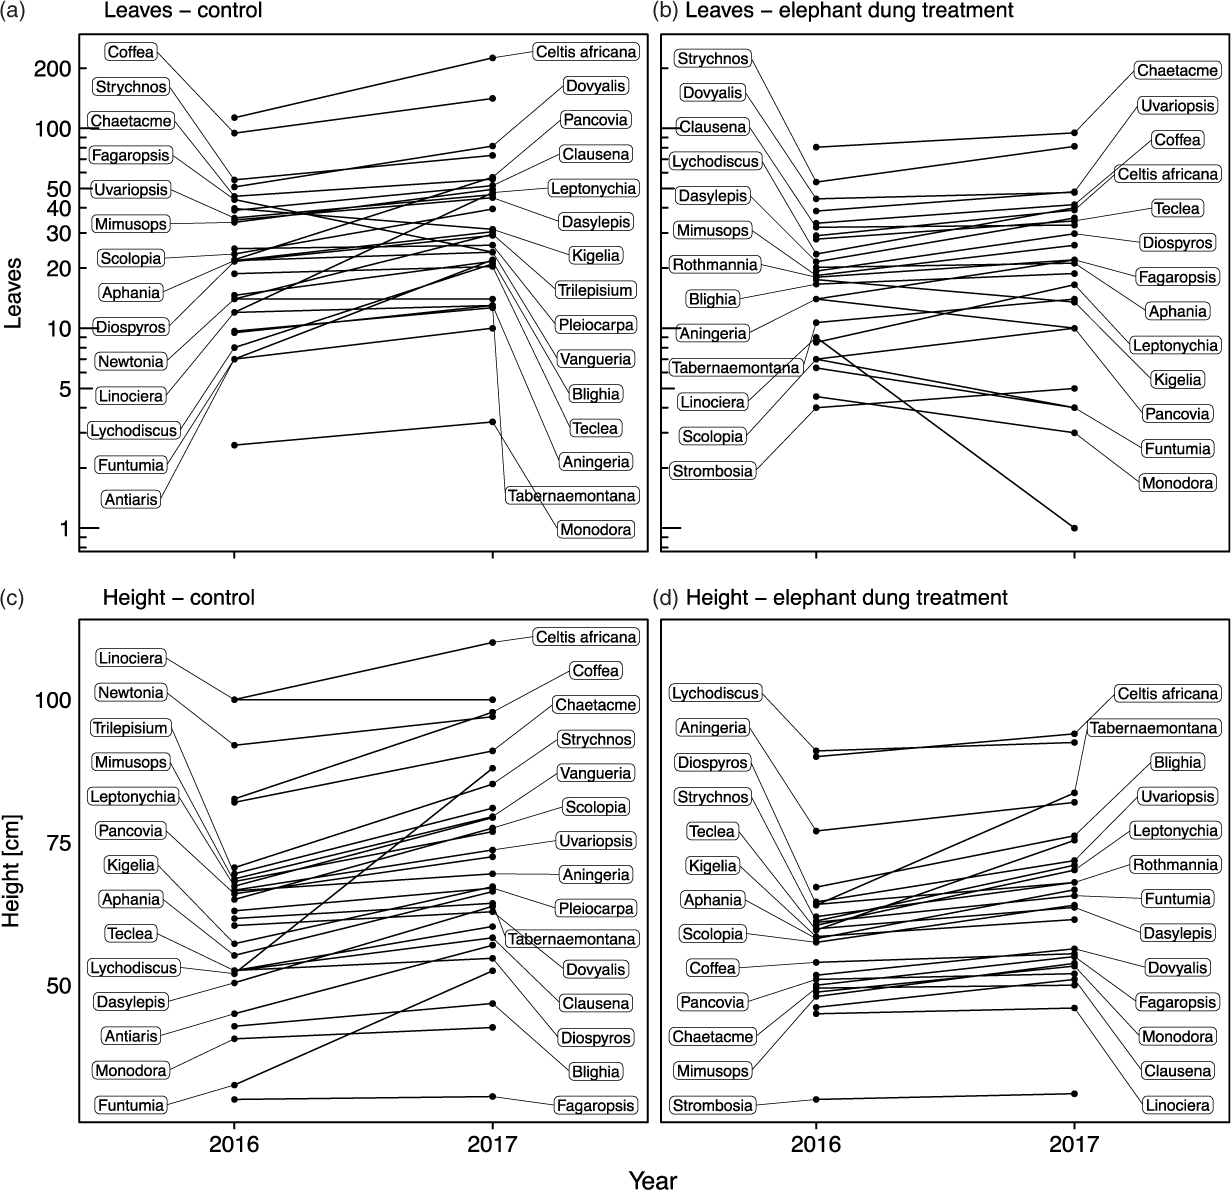
Observed change in height and number of leaves between 2016 and 2017 per species and treatment. Changes in the number of leaves in the control (a) and elephant dung treatment (b) condition, and changes in height in the control (c) and elephant dung treatment (d) condition. The y-axis for the number of leaves in (a) and (b) was log-transformed to improve the interpretability of the plot. Full species names are provided in Table 1.

The addition of elephant dung significantly reduced the mortality of seedlings. Within the control plots 5.9% of the plants (17/289) died over the duration of the experiment, whereas only 2.1% of the plants treated with elephant dung (6/285) died (GLMM: estimate of intercept with 95% CIs: −2.92 [−3.98, −2.19]; estimate of dung treatment with 95% CI: −1.03 [−2.08, −0.12];  ${\chi _1}^2 = 4.91, {\rm{P}} \,\lt\, 0.05$) (Figure 2).
Discussion
Elephants eat up to 200 kg d−1 (wet weight, Ruggiero Reference Ruggiero1992) and produce about 40 kg d−1 (dry weight) of dung (Rees Reference Rees1982). In a single 4-km by 10 m transect in Kibale, we encounter up to 47 fresh dung samples. Thus, through their foraging, nutrients that would be inaccessible for plants for years, quickly become available for use. Despite depositing large amounts of dung and counter to what we predicted, our results suggest its effect on seedlings is small and limited to an improved leaf growth for plants with already a large number of leaves.
There are a number of possible explanations for these findings. It could be that the increased N and P provided by the elephant dung are not needed by the plants (i.e. they are not nutrient limited). We view this as unlikely as the soils in the area are lixic ferralsols which are from geologically old parent materials and low in fertility and nutrients (Majaliwa et al. Reference Majaliwa, Twongyirwe, Nyenje, Oluka, Ongom, Sirike, Mfitumukiza, Azanga, Natumanya and Mwerera2010, Rode et al. Reference Rode, Chapman, Chapman and McDowell2003, Reference Rode, Chiyo, Chapman and McDowell2006). In addition, seedlings receiving the nutrients found in red colobus (Piliocolobus tephrosceles) dung did show a positive growth effect (Kalbitzer et al. Reference Kalbitzer, Mcinnis and Chapman2019). Since we do not know the nutrient content of forest elephant dung, it is possible that the nutrients did not increase sufficiently to enhance growth, but given the amount of dung added, we think that this is unlikely as well. Possibly, the effects of nutrient addition might take longer than 1 y to detect. Studies of N and P enrichment to soils found an effect of plant growth in some systems, but the effect was not evident within a single growing season (Hatch et al. Reference Hatch, Lovell, Antil, Jarvis and Owen2000). It is also possible that the amount of dung added to the experimental plots over-fertilized the seedlings causing damage, which could explain the smaller increase in number of leaves for dung-treated plants with few leaves in the first year. Excessive manure application can cause problems, such as plant toxicity due to high salt content (Meek et al. Reference Meek, MacKenzie, Donovan and Spencer1974). However, given the low N and P content of dung relative to levels of fertilizer that farmers use, this seems unlikely as well. Furthermore, the survival of plants was higher in the plot receiving elephant dung relative to the control, reinforcing the fact that the area was not over-fertilized. It is also possible that these species were not nutrient limited, but light limited (Augspurger Reference Augspurger1984, King Reference King1994), this possibility will require further study where light levels are measured and preferably experimentally manipulated.
Poulsen et al. (Reference Poulsen, Rosin, Meier, Mills, Nunez, Koerner, Blanchard, Callejas, Moore and Sowers2018) speculated that the loss of elephants would shift the composition of African forests to slow-growing tree species, because nitrogen supplementation has been proposed to shift community composition toward early-successional, fast-growing species (Tilman & Lehman Reference Tilman and Lehman2001). This speculation is supported by the observation that understorey species have a greater growth response to nitrogen addition when there is an increase in light availability (Thompson et al. Reference Thompson, Stocker and Kriedemann1988), such as gaps often created by elephants opening up the vegetation (Poulsen et al. Reference Poulsen, Rosin, Meier, Mills, Nunez, Koerner, Blanchard, Callejas, Moore and Sowers2018). Our finding that shade-tolerant plants with a higher number of leaves and the addition of elephant dung fared better than control plants provides evidence in contradiction to the speculation of Poulsen et al. (Reference Poulsen, Rosin, Meier, Mills, Nunez, Koerner, Blanchard, Callejas, Moore and Sowers2018). However, because our effect was relatively small it is clear that more research needs to be conducted on a larger scale, including more frequent applications of dung, observations over several years and the analysis of nutrients in the soil.
Forest elephant populations are being decimated across much of Central Africa (Maisels et al. Reference Maisels, Strindberg, Blake, Wittemyer, Hart, Williamson, Aba’a, Abitsi, Ambahe and Amsini2013, Poulsen et al. Reference Poulsen, Koerner, Moore, Medjibe, Blake, Clark, Akou, Fay, Meier and Okouyi2017), while in a few protected forested areas, like Kibale, where they are likely seeking refuge, their numbers are increasing rapidly (Omeja et al. Reference Omeja, Jacob, Lawes, Lwanga, Rothman, Tumwesigye and Chapman2014). It is therefore critical that the scientific community provides information on their role in forest ecosystems as they are a clear example of ecosystem engineers (Chapman et al. Reference Chapman, Bonnell, Gogarten, Lambert, Omeja, Twinomugisha, Wasserman and Rothman2013, Crain & Bertness Reference Crain and Bertness2006, Wright & Jones Reference Wright and Jones2006). A next important step will be to more fully understand their role within forest ecosystems and how their density in different forests influences plant community dynamics, thus influencing forest regeneration and the population size of animals that depend on these tropical forests.
Author ORCID
Colin A. Chapman 0000-0002-8827-8140
Acknowledgements
Permission to conduct this research was given by the Uganda Wildlife Authority. We thank Mike Lawes, John Poulsen and two anonymous reviewers for helpful comments on this project.
Financial support
Funding for the research was provided by the IDRC grant ‘Climate change and increasing human-wildlife conflict’.