

Measuring how confrontational parties are within a legislature and in particular the ‘distance’ between cabinet and opposition parties (that is, the extent to which a government and its opposition oppose each other) is a relevant political metric, as it relates to the ability of a cabinet to change the status quo and its survival rate, among other things. The distance between parties is measured in terms of ideology in most political science literature, for example through the reliance on commonly used data, such as expert surveys or the data set of the Comparative Manifestos Project (CMP). The line of conflict between parties and its political consequences can additionally outline factors other than ideological or policy considerations, though, such as evolving parliamentary dynamics, past behaviours, forward expectations and emotional factors, including mutual (dis)trust (Marcus Reference Marcus2000). As a result, in certain circumstances, divides between parties could be much less (or much larger) than would appear based on ideological considerations alone.
Through the analysis of legislative speeches made by prime ministers and party representatives in parliamentary sessions in Japan from 1953 to 2013, we argue that by focusing on the type of language (i.e. words) that different political actors employ to express their positions in respect of the cabinet, it is possible to place parties according to a dimension that is more suited to capture their confrontational nature (the by-product of the several factors as mentioned above) as well as its evolution over time within a parliamentary democracy. By placing parties in a dimension that depicts their actual degree of confrontation, we then show that we can solve some important puzzles in legislative politics in Japan, namely the survival rate of governments and the speed of passage of cabinet bills.
The case of Japan serves our purposes particularly well for two main reasons. First, the Japanese Diet is known for its adversarial nature (Masuyama Reference Masuyama2000), which makes it an ideal case for a study like ours that wants to investigate the distance between government and opposition parties by focusing on their legislative speeches. Second, Japan has been characterized by a period of no alternation of power – termed the ‘dominant party system’ (1955–93) – followed by an arguably different party system where alternation in power and coalition cabinets have become more common. This change in political dynamics provides us with an interesting quasi-experimental setting, as we will discuss below.
To the large set of Japanese legislative speeches that we have collected (more than 400), we apply a well-known scaling algorithm, Wordfish (see Proksch and Slapin Reference Proksch and Slapin2008), which allows us to recover Japanese parties’ relative positions as expressed by their speeches along a latent dimension that we identify as a government–opposition dimension that goes beyond ideological aspects. Starting from such recovered party positions, we develop an index of the intensity of the government–opposition divide directly related to the dynamics of the electoral cycle of Japanese politics. As we will discuss, compared to a situation in which we limit ourselves to more traditional measures of capturing the ideological position of parties alone, a new index such as this greatly facilitates the investigation of important aspects of Japanese legislative politics.
Our article is organized as follows. We first discuss the consequences of analysing legislative speeches, introducing data on legislative speeches in the Japanese Diet, as well as the method we adopt to analyse them, in the following section. In the third section we show how a party’s position, extracted from legislative speeches, changes dramatically once it enters government and/or moves to opposition. The fourth section discusses how an index of party polarization within a legislature based on the intensity of the cabinet–opposition divide can be derived from the aforementioned party position. The fifth section illustrates the determinants of the ebbs and flows of such an index and in particular its relationship with the electoral cycle, while the sixth section shows its relevance in helping us to empirically understand relevant dimensions of Japanese politics (the survival rate of governments and the speed of passage of cabinet bills). In the conclusion we discuss the general implications of our findings beyond the Japanese case.
What we can learn from analysing legislative speeches
As noted by Keith Krehbiel and Zachary Peskowitz (Reference Krehbiel and Peskowitz2015), the preferences of political actors are the animating forces of politics. The method used to derive such preferences can be affected, however, by the institutional context in which the preferences are captured. When this is the case, those preferences become ‘institutionally endogenous’. For example, Michael Laver (Reference Laver2006) shows the implication of analysing roll calls in a presidential versus a parliamentary system. In the roll calls in the latter context, the structure of the ‘revealed behavioural space’ (Hix and Jun Reference Hix and Jun2009) is measured, instead of the underlying ideological dimension of the members of parliament (MPs). As a consequence, by applying roll call analysis to parliamentary democracies, what a researcher extracts is first and foremost MPs’ positions along a government–opposition dimension, rather than their ideological placement (Curini and Zucchini Reference Curini and Zucchini2012; we will return to this point below).
Similarly, analysing political texts to understand the positions of the speakers expressing them (Benoit and Laver Reference Benoit and Laver2003; Lauderdale and Herzog Reference Lauderdale and Herzog2016; Laver et al. Reference Laver, Benoit and Garry2003; Monroe and Schrodt Reference Monroe and Schrodt2008) must begin with the recognition of the particular institutional setting in which such speeches are given, and its consequences. An important aspect is whether the speech has its place in a legislative or an electoral setting. As the language spoken on the floor is primarily directed at other delegates, cabinets or opposition parties rather than voters, it could be expected that the dimension of conflict would possibly be different from the ideological one often found in different political texts primarily prepared for election campaigning.
Let us take an example to illustrate this. After the prime minister gives a speech in parliament, defining the agenda of the cabinet, the parties will react to it, positioning themselves according to the agenda set out by the speech. In so doing, they will probably be affected by several factors, linked not only to their respective ideological positions but also to other motivations that they might reasonably have for maximizing their electoral fortunes in the following election and obtaining official positions in the future. If political parties have vote-seeking and office-seeking incentives on top of policy-seeking incentives (Strøm Reference Strøm1990), the line of conflict may not be exclusively conditioned by an ideological dimension driven by policy-seeking incentives but also by the former incentives. Moreover, parties (both within and without the cabinet) may be interested in postponing the next election or enacting specific institutional reforms that their constituency also cares about. All these factors may well affect the division (and therefore the distance) between the positions of the different speakers expressed through texts in the legislative arena on behalf of their parties. We thus assume that the settings in which messages are produced matter to a non-negligible extent. In particular, by analysing legislative speeches, we should be able to place parties along a dimension including more factors beyond ideology or policy considerations, which existing measures deal with exclusively.
This possibility is fully exploited once we employ an unsupervised scaling model, such as Wordfish, to analyse legislative texts and extract the respective (latent) positions of each speaker. Wordfish analyses textual documents by comparing the frequencies of the words contained in each text, under the assumption that for each document, the words’ relative frequencies (assumed to be drawn from a Poisson process) are informative of the general position of that text. The underlying assumption is that the more texts share word usage, the more likely they are to have a similar position, and vice versa. Using this scaling method, it is possible not only to array documents along a single latent dimension, providing estimates of their respective positions, but also to recover which words have more explanatory power to differentiate across documents (see online Appendix).
Let us suppose that we want to scale a set of speeches from a legislative debate through Wordfish. Let us suppose that the prime minister makes a speech on a special occasion, such as the speech to parliament after the investiture votes in a parliamentary session. In this case, we can also suppose that the speeches made by the prime minister, precisely because of her role, would present (recurring) peculiarities as well as constraints in terms of the words employed, because the cabinet, after all, must deal with immediate routines and administrative problems and concerns with the ongoing matters of government (for example, defence and foreign policy) as well as with the practicalities of policymaking (Warwick Reference Warwick2011).
If a prime minister tends to use peculiar concepts and topics (and words to discuss such topics) consistently over time and irrespective of any other consideration (including ideological considerations), we could then expect that those words will have high relevance, given that they identify quite clearly the speeches made by a prime minister. Similarly, the speeches made by MPs following the prime minister’s speech will be placed more or less distantly from those of the prime minister, according to the similarity of languages that they employ, once again in a way not necessarily linked to a clear ideological stance.
Speeches in the Japanese Diet
We have selected all the speeches in the Japanese House of Representatives following the prime ministers’ general policy speeches and the questions from each party representative, including the speeches (answers) made by the prime ministers themselves. We here refer to sessions in which the prime minister makes a speech (shoshin hyoumei enzetsu) in the following situations: (1) after being nominated in a special session; (2) after having succeeded a predecessor during a parliamentary session; and (3) at the beginning of an extraordinary session.Footnote 1 In all of these circumstances, the speeches made by the prime minister and the questions by party representatives are highly important, which makes them an ideal subset of speeches for the study of the nature of party competition.Footnote 2 These include in total 82 sessions. The prime ministers’ speeches are given in both houses, but since they are generally given first in the House of Representatives, we take the ones given there for our analyses.
In the relatively few cases (less than 30%) where more than one speech from one party is given in the same session, we have selected the speech of the speaker who is of higher rank in the party. This also means that, in respect of the party to which the prime minister belongs, we have always selected the prime minister’s speech, given that the prime minister in Japan is generally the leader of her party.Footnote 3 For the other parties, scaling for each legislative speech session to just the speech made by the most important speaker for each of them, the possibility of obtaining an expression of position that is not the official one of the party should be negligible. Sven-Oliver Proksch and Jonathan Slapin (Reference Proksch and Slapin2015) note in this respect that rebellious MPs became less likely to speak during high-profile debates (such as the ones analysed here) because parties do not want to offer a disunited image of themselves to the public. To avoid that, they exert greater control over speeches in these situations. Collapsing all the speeches made by the speakers of one party in a given session within a single ‘unified’ speech before running our analysis does not, however, alter the results reported below.
Overall, 439 speeches over 82 sessions, and almost 20,000 words are collected from 1953 (Diet 18, under a cabinet of Prime Minister Shigeru Yoshida) to 2013 (Diet 185, under a cabinet of Prime Minister Shinzō Abe) from the database of the National Diet Library.Footnote 4 The coding procedures take place in two steps. The difficulty of computer-assisted text analysis in Japanese is that Japanese sentences are only broken up by commas and full stops, and words are written without spaces between them. We thus applied the MeCab tokenizer engine to split the speeches into words or morphemes. This procedure produces a data matrix in which the frequencies of the words that appeared in the speech of each party are recorded. Having transformed words from the speeches into numbers, we estimate the position of each speaker (i.e. party position) through Wordfish.Footnote 5
Given the wide cross-temporal range of our analyses, we must also make sure that our results are not biased by changes in the meaning of some political words. By scaling texts, in fact, we can track variations in actors’ preferences across time in a reliable way, but only if word usage and political language remain relatively constant, at least at a minimum level, over time. For example, if the political debate changes and new vocabulary enters the political lexicon in election t, this will differentiate the texts at point t from those at point t-1. In fact, in this instance, we are likely to pick up an agenda shift in texts, whereas we are interested in change in party position.
A measure to address this issue would be to select carefully the words to be analysed; thus, if there is a movement by parties, it can only be due to differences in word usage. This requires that word data over time must be minimally comparable. Following Proksch and Slapin (Reference Proksch and Slapin2009), we chose to include in the analysis only words that fulfil a minimum threshold criterion based on informative priors – that is, we retained in the analysis only those words that appear both pre- and post-1990. In this respect, we assume that political language changed after the collapse of communism and the rise of new technology and the globalized economy: this added words to the Japanese political lexicon that were not present previously. Similarly, some words that were previously important probably fell out of use. By eliminating words unique to either the pre- or post-1990 period, we wanted to control for such changes, allowing at the same time estimations of parties’ positions that are comparable over time.Footnote 6
After normalization, the average number of words for a typical legislative speech is 4119.7 (standard deviation: 1408.5). This relatively large number of words is reassuring; it has been shown that Wordfish tends to estimate positions more accurately as the number of words increases (see Hjorth et al. Reference Hjorth, Klemmensen, Hobolt, Ejnar Hansen and Kurrild-Klitgaard2015).
Changes of party positions over time
As already underlined, the Wordfish algorithm allows us to identify which words are more useful in differentiating between documents. In this respect, two interesting sets of words appear to arise in the analysis of Japanese legislative speeches (see online Appendix). On one side we have words such as 躍進 (breakthrough), 成功裏 (successfully), 成案 (bills passed), 着実 (steady), 迅速 (prompt), 施策 (policy measure), 立案 (policymaking). On the other, there are such words as 低落 (decline), 悪政 (misgovernment), 不遜 (arrogance), 進退 (resignation), 改悪 (deterioration), 強硬 (by force), 否決 (rejecting bills). The two opposite sides of the words spectrum appear to define different attitudes towards government very well: a positive one (the former set) and a negative one (the latter set). It seems therefore natural to link such words to government–opposition terminology.
This becomes even more apparent once we focus on the position of each speech analysed, and therefore of each party, along the latent dimension recovered through Wordfish. Figure 1 illustrates in this respect the shifts through the decades in the positions of the five main Japanese parties: the Liberal Democratic Party (LDP), the Japanese Socialist Party (JSP), the Democratic Party of Japan (DPJ – since the mid-1990s), the Japanese Communist Party (JCP) and Komeito, often known as the Clean Government Party.
Evolution of Japanese Party Positions on the Wordfish Scale: LDP, JSP and DPJ (Upper Panel), JCP and Komeito (Lower Panel) Note: The horizontal axis shows the number of Diet sessions. The axis denotes the interval of 10 sessions but does not necessarily match with the sessions included in the data. In the upper panel of the figure we highlight with a circle the two periods in which the LDP was not expressing the position of the Japanese prime minister.

Japan serves as an interesting quasi-experimental case where the government–opposition divide can be investigated, given the change in Japanese political dynamics before and after 1993. In fact, as long as the positions extracted through the analysis of legislative speeches reflect mainly a cabinet–opposition continuum, we should expect that such positions do not change abruptly in the era of the dominant party system. The opposite should happen in the era of alternation in power. This is exactly what we find in the data.
Speeches by the LDP always place the party on the upper side of the dimension, but only when the LDP expresses the prime minister’s position (Figure 1, upper panel). When this does not happen (between 1993 and 1994, when several parties/groups including the JSP formed a non-LDP coalition, and between 2009 and 2012, following the landslide victory of the DPJ in the 2009 general elections; both situations are highlighted with a circle in Figure 1, upper panel), the LDP’s position changes drastically, leapfrogging the position of the two main (centre) leftist parties – that is, the JSP (between 1993 and 1994) and the DPJ (between 2009 and 2012). Note that this trend also applies to Komeito from the end of the 1990s (Figure 1, lower panel) – that is, when the party began to be a long-term coalition partner of the LDP. The same logic also applies to the JSP and DPJ: both parties are mostly in the lower part of the graph (i.e. with a negative score) except for the periods when they enter the cabinet. In those cases, they begin to present a very high positive coefficient. By contrast, the JCP, a party that has always been in opposition, rarely changes its trajectory, consistently staying on the lower half of the graph.
Clearly, the overall trend of party positions appears at odds with the conventional wisdom of the left–right or conservative–progressive (hosyu-kakushin in Japanese: Curtis Reference Curtis1988) ideological positions of Japanese parties. Not surprisingly, the overall correlation between the estimated positions reported in Figure 1 and the left–right positions of parties recovered using the CMP data set (see Budge et al. Reference Budge, Klingemann, Volkens, Bara and Tanenbaum2001) over time is just 0.36.Footnote 7 Given the long period of LDP dominance up to the early 1990s, this value is even higher. The correlation coefficient indeed drops to 0.05 when we focus only on those parliamentary sessions in which we experience an alternation in power.
Our results speak directly to what has been found by other authors (see in particular Dewan and Spirling Reference Dewan and Spirling2011), who show that in parliamentary systems voting tends to be done along government-versus-opposition lines. In similar fashion, in Figure 1 we illustrate how speeches immediately following the prime ministers’ general policy speeches can be employed to measure the positions of political actors along a similar divide.
Intensity of the government–opposition divide index
Based on the estimates of party positions in the previous section, we compute a measure of the intensity of the government–opposition divide for each session. To this end, we adopted the Dalton index of party system polarization (Dalton Reference Dalton2008) to summarize the extent to which parties are polarized and oppose each other.Footnote 8 We call this measure the index of the intensity of government and opposition (IGO index).
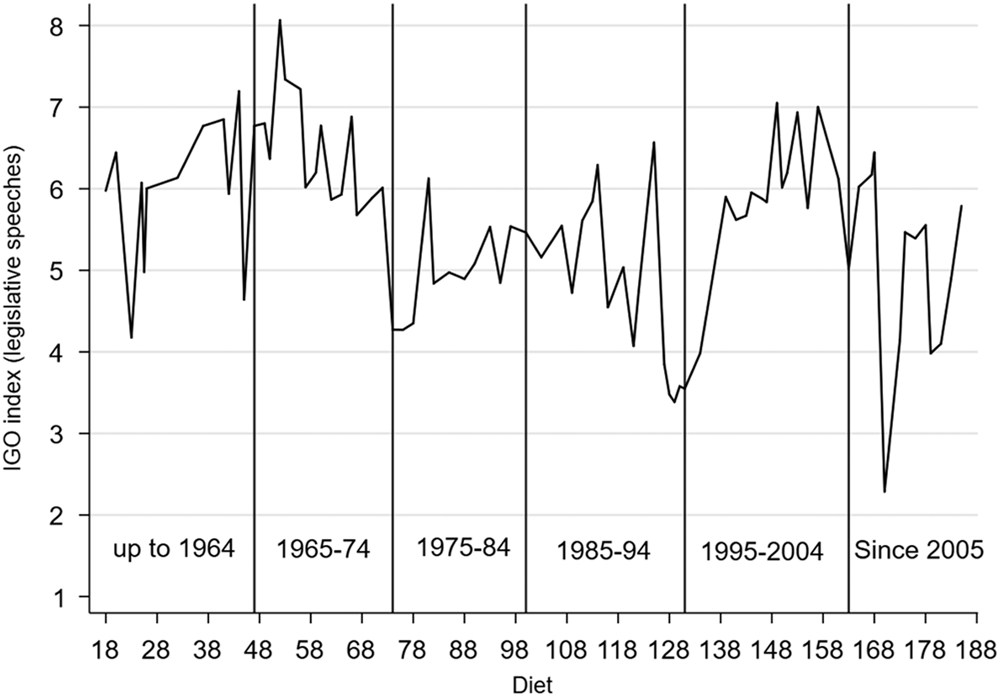
Figure 2 shows the changes in the degree of the IGO index over the decades. The trend largely reflects the history of party politics in Japan, and it presents good apparent validity. The IGO index reaches its highest in the middle of the 1960s (during the 60th Diet), where a fierce exchange was made concerning the Vietnam War, and remained relatively high in the early 1970s. This period corresponds to the making of Diet management politics (what is commonly referred to in Japan as kokutai-seiji) between the LDP and opposition parties (mainly the JSP), where they performed confrontationally in debates but had (welfare) policy consensus behind the scenes (Curtis Reference Curtis2013: 116–20). The IGO index drops dramatically in the middle of the 1970s when Prime Minister Kakuei Tanaka resigned due to a bribery scandal and the arrival of the new prime minister, Takeo Miki, was welcomed by the public and even by the opposition parties. The index rises in the Diet session of 1989 when the LDP faced a major defeat in the Upper House election. The rise of the IGO index is also remarkable a few years later in the Diet session under the Miyazawa cabinet led by the LDP, which eventually led to the transfer of power to opposition parties. Then the IGO index drops for sessions where non-LDP cabinets were formed in the 1990s but rises again once the LDP regained power through the first decade of the 21st century, before sinking in the sessions that led to the alteration of government in 2009 and 2012.
The Fluctuation of the IGO Index Over Time (1953–2013) Note: The horizontal axis shows the number of Diet sessions. The axis denotes the interval of 10 sessions but does not necessarily match with the sessions included in the data.

The determinants of the IGO index
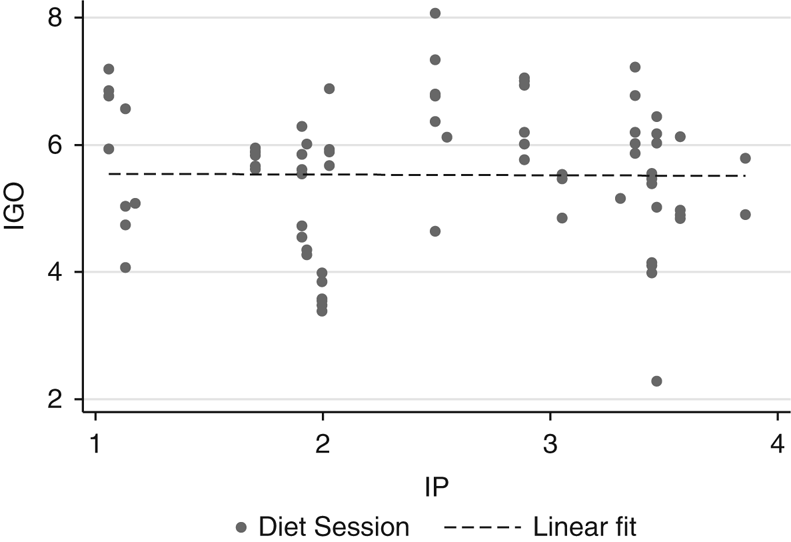
As discussed above, the evolution of the IGO index over time appears to record a convincing apparent validity, capturing salient moments of the legislative dynamics in the Japanese parliament. We now investigate the determinants of its trend over time. In Figure 3, we compare the trend in the IGO index with an index of polarization based on ideological considerations alone. We have estimated this latter index (the IP index, for ideological polarization) using the left–right placements of parties as provided by CMP data for the Japanese case (1960–2012).Footnote 9
Correlation Between the IGO and IP Indices Over Time (1960–2013) Source: Japanese Legislative Speeches and CMP data.

Figure 3 shows that the two indices measure two fundamentally different phenomena (the correlation between the two, if we compare the IP with the IGO index following an election, is basically non-existent), confirming our idea that the underlying dynamic of the IGO index (i.e. the relative level of confrontation between parties within a legislative setting) is determined by factors other than ideological position as seen during an electoral campaign. On the contrary, it appears more related to events characterizing what is called the between-election period (or during the ‘between-election democracy’, as it is sometimes called in the literature; Esaiasson and Narud Reference Esaiasson and Narud2014).
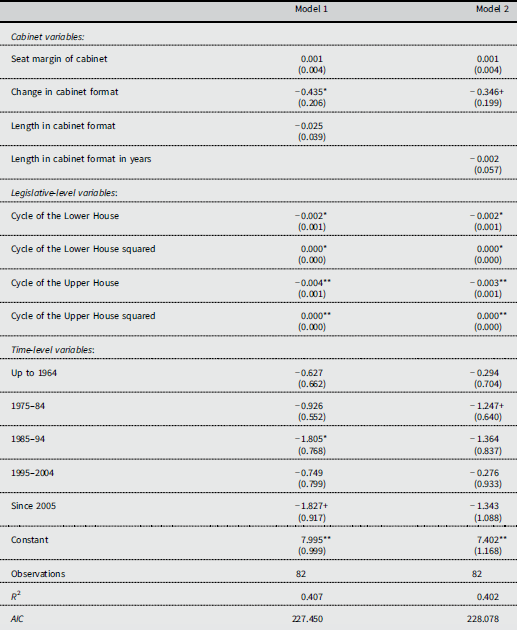
To investigate the possible determinants of the IGO index, in Table 1 we analyse its variation over time and include three sets of explanatory variables. The first set is related to the cabinet to which each legislative speech is referred. Seat margin of cabinet refers to the number of seats above (or below) the majority a cabinet controls; Change in cabinet format is a dummy variable equal to 1 every time there is a change in the cabinet composition (for example, during Session 146, when a cabinet formed by just the LDP was followed by a cabinet formed by the LDP and LP, or during Session 173, when the cabinet formed by the LDP and Komeito was followed after the 2009 election by a coalition of the DPJ, SDP and People’s New Party (PNP)); Length in cabinet format counts the number of consecutive parliamentary sessions during which the same cabinet composition remains intact. The variable starts with the value 1, which increases to 2 if at session time t the composition of the cabinet does not change between session t-1 and t. Similarly, it increases to 3 if there is no change in cabinet membership between t-2 and t-1 or between t-1 and t. To assure the robustness of the results, we also test this with another variable, Length in cabinet format in years, which is not susceptible to the different lengths of the Diet sessions.
Explaining the Variation of the IGO Index

Notes: Clustered standard errors on legislature in parentheses. +p<0.10, *p<0.05, **p<0.01, ***p<0.001.
The second set of variables is at legislative level. We have included the electoral cycle of both the Lower and the Upper House (i.e. the number of days since the beginning of the legislative session in either chamber), together with its squared term, taking into consideration any possible non-linear relationship.
The third set of variables is at the time level. We have included a dummy for roughly each 10 years (as depicted in Figure 2), using as the omitted category 1965–74. Table 1 shows the statistical results of the model estimated.
Among the cabinet variables, the only significant one is the Change in cabinet format, which has a negative sign – that is, when a new government formula is established, the confrontational attitude in the Diet appears to decrease. This is to be expected, since new cabinets are generally welcomed at first, in what is known as ‘congratulatory exchanges’, when the initial parliamentary debates take place. The tendency is expected to be more pronounced when this is coupled with a change of cabinet formation.
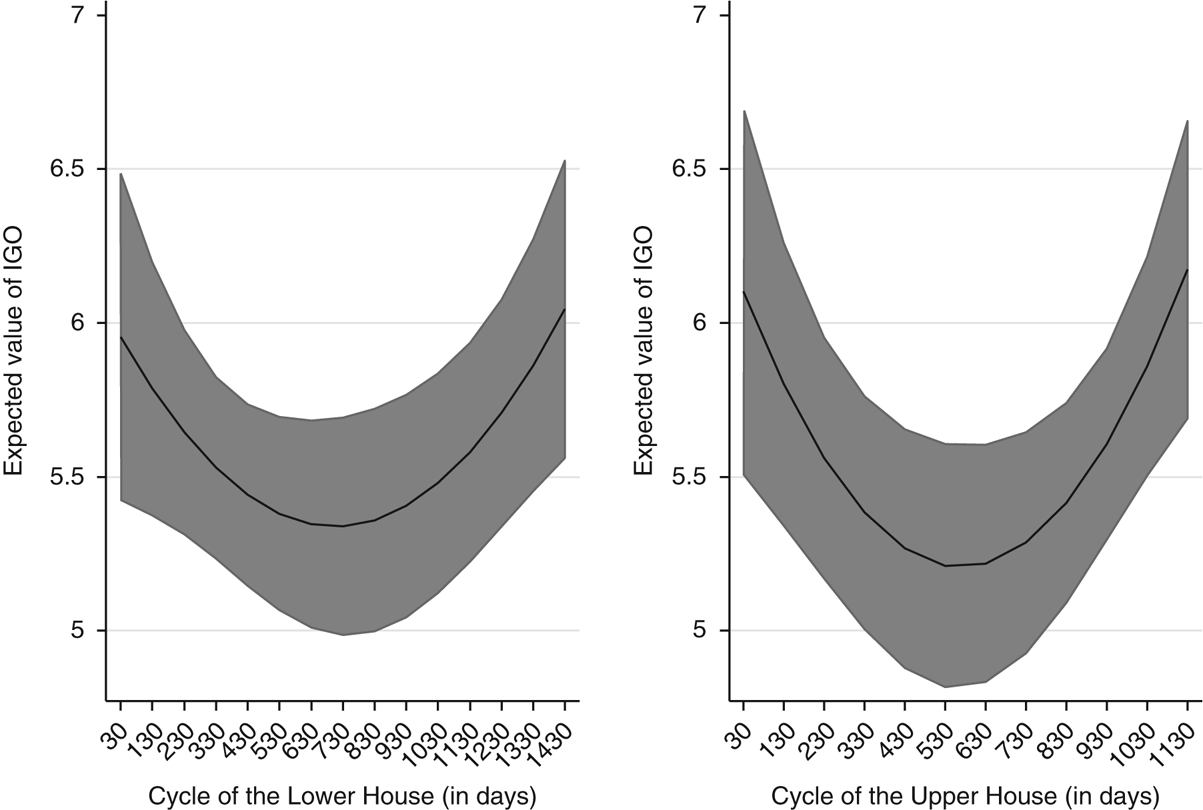
The estimated relationship between electoral cycle in both the Lower and Upper House and the IGO index appears to be a U-shaped one (see Figure 4). That is, parties appear to be very confrontational right after the end of elections. Then, as days pass, the salience of the government and opposition keeps decreasing until it reaches a minimum (after around 705 days in the Lower House and after around 570 days in the Upper House).Footnote 10 Then the salience starts to increase once again as the next election approaches, implying that parties become more confrontational in order to appeal to voters and to project a better image for the forthcoming election.
Electoral Cycles of, Respectively, the Lower House (Left Panel) and the Upper House (Right Panel) and Expected Value of the IGO Index (1953–2013) Source: Model 1, Table 1.

Finally, in respect of time-level variables, all decades under study other than the turbulent period of 1965–74 present a lower value of the IGO index (although not always in a significant way).
The relevance of the IGO index
We now examine whether the new measurement that we have estimated substantially relates to important legislative phenomena to demonstrate its external validity. We focus, in particular, on two specific examples in the context of Japanese politics: the survival rate of governments and the time needed for them to pass their proposed bills. In both cases, we contrast results based on the IGO index with ones based on the IP index discussed above (a pure ideological polarization index), while controlling for several variables generally included in the literature (Becker and Saalfeld Reference Becker and Saalfeld2004; King et al. Reference King, Alt, Burns and Laver1990; Masuyama Reference Masuyama2007; Taylor Reference Taylor2014; see online Appendix).
As noted, the IGO index is a political metric endogenous to institutional factors. While this is per se less problematic when we reconnect it with something that happens after, rather than before, cabinet formation (such as, precisely, cabinet duration), we should nonetheless acknowledge the risk of the existence of a spurious relationship between the IGO score and the dependent variables we want to explain. For instance, a possible correlation between the duration of cabinet and the IGO index might be a mere product of a common cause, such as a scandal involving the prime minister which both made the cabinet vulnerable and gave the opposition an opportunity to use strong words in speeches, thus affecting the value of the IGO index. In other words, it may be that when a cabinet weakens for some reason, the opposition attacks the government more, and vice versa. The variables we include as controls (such as cabinet approval rate, among others) allow us to take these possible factors into consideration, thereby allowing us to estimate the relationship between the IGO index and the dependent variables cleansed of such eventualities.
In the case of the survival rate of Japanese cabinets, we expect a positive impact of the IGO index on the hazard rate of the survival of Japanese cabinets; that is, as the IGO index increases, the predicted length of a cabinet is expected to decrease as the bargaining environment in which the cabinet operates becomes more complex (Laver and Schofield Reference Laver and Schofield1990; Saalfeld Reference Saalfeld2008; Warwick Reference Warwick1994).Footnote 11 The complex arrays of parties and party positions within a parliament can in fact increase the likelihood that small exogenous events will redistribute parties’ bargaining power. This can upset any worked-out solution, for example by encouraging attempts to renegotiate cabinets or form new ones. One main indicator deployed in the literature to estimate such ‘bargaining complexity’ is the polarization between parties’ positions. Its empirical investigation, however, relies crucially on how we estimate the level of ideological confrontation among parties within a parliament (i.e. the actual content of parties’ relative positions). This goes back directly to our discussion on how to estimate such confrontation. We also expect a positive impact of the IGO index on a second important dimension of Japanese legislative politics: the duration of cabinet bills, which can also be regarded as a phenomenon related to the intensity of the government–opposition divide (i.e. the larger the IGO index becomes, the stronger the expected efforts by the opposition to delay cabinet bills). In this respect, we applied the concept of ‘bill duration’ devised by Kentaro Fukumoto (Reference Fukumoto2000a, Reference Fukumoto2000b) for the period 1953–96, which takes the length of each Diet session into consideration (so that the dependent variable of bill duration is the average time needed to pass a cabinet bill relative to the duration of a diet – a variable ranging between 0 and 1, computed for each session).Footnote 12
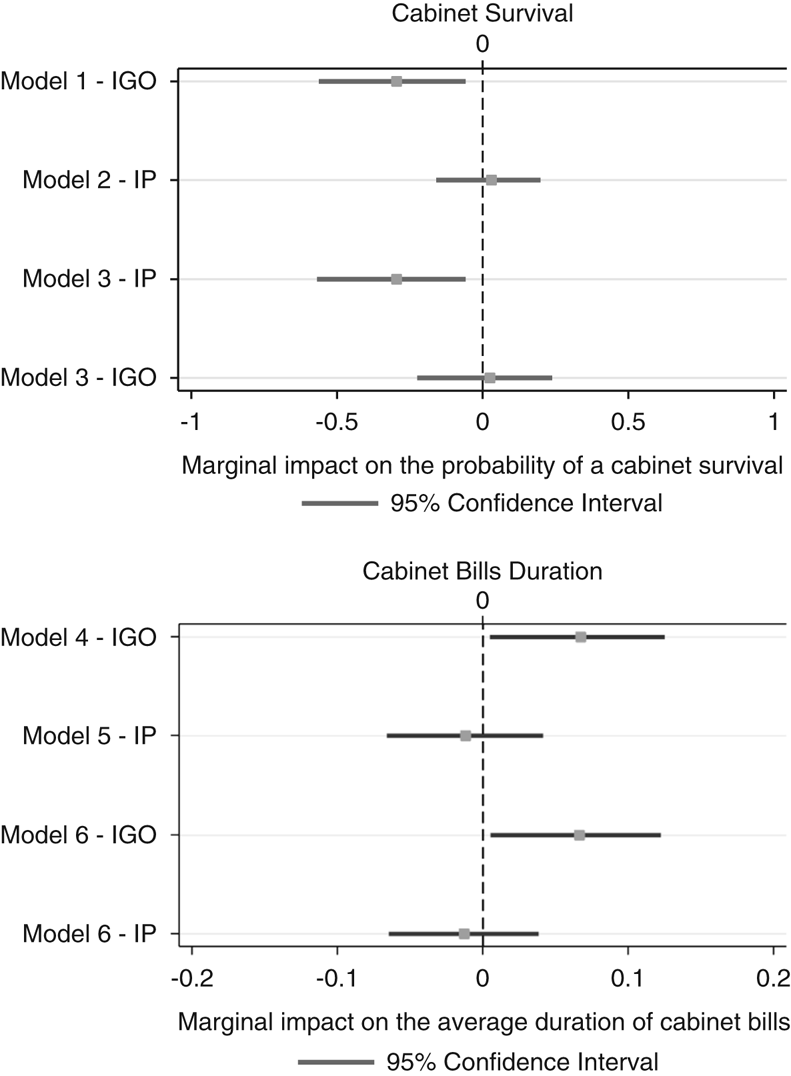
In Figure 5 we show the estimated marginal impact of both the IGO and IP indices on, respectively, the probability of cabinet survival (Figure 5, upper panel) and the average duration of cabinet bills (Figure 5, lower panel: see Table 1A and Table 2A in the online Appendix for the results of the statistical analyses on which both panels of Figure 5 are based).Footnote 13 As can be seen, the IGO index is always positive and significant at the 0.05 level or lower, unlike the IP index. Moreover, the impact of the IGO index is far from being negligible: when it increases by one standard deviation from its mean, cabinets are around 29% more likely to fail at any given time (assuming that they are still in charge until that time), while this same change produces a 7% expected increase in the average duration of cabinet bills.
The Marginal Impact of Increasing the IGO and IP Indices by One Standard Deviation from their Means on Cabinet Survival (Upper Panel) and Cabinet Bills Duration (Lower Panel) in Japan Source: Cabinet survival: Table 1A in the online Appendix; cabinet bills duration: Table 2A in the online Appendix. Note: The reported marginal impact and their corresponding confidence intervals are calculated via simulation using 10,000 draws from the estimated coefficient vector and variance-covariance matrix using the estimations of Tables 1A and 2A in the online Appendix.

To sum up, we have shown that the inclusion of the IGO index effectively improves the models. In this respect, the relative degree of confrontation among parties within a legislature appears to matter greatly in respect of Japanese legislative politics, but only if we capture that by employing an index that is more sophisticated than a simple measure based on the ideological position of parties alone (on the need to develop a more fine-grained measure of ‘polarization’, see also Warwick Reference Warwick1994). This would also help to explain why the impact of ‘polarization’, estimated for ideological party positions alone, has received mixed empirical corroboration within the literature in respect of, for example, cabinet survival (see Saalfeld Reference Saalfeld2008).
Conclusion
Parliamentary debates have received increased attention over the last half-decade as a potential data source on legislative politics and party competition more generally (Sieberer Reference Sieberer2016). A unique advantage of analysing legislative speeches is that it produces a more dynamic approach than the alternatives (such as analysing electoral programmes or relying on expert or voter surveys), given that legislative speeches are a recurring phenomenon in the life of a legislature. This allows us to better capture the (possible) political changes that can occur in the between-election period (such as party splits and mergers, changes in prime minister, and other events). Moreover, it has been shown that floor debates can be used to better understand coalition partners’ communication on policy (Martin and Vanberg Reference Martin and Vanberg2008), to investigate intra-party politics (Proksch and Slapin Reference Proksch and Slapin2012) and to dig into electorally motivated activities of parties and MPs (Mayhew Reference Mayhew1974).
In an influential paper, Proksch and Slapin (Reference Proksch and Slapin2012) note that debates within a legislature may function as a forum for communication in which parties express their positions to other parties and (possibly) voters. However, they also warn of the possibility that observed floor speeches may not reflect the true distribution of preferences of political actors every time speeches are the result of strategic choices made by political actors (see also Bäck and Debus Reference Bäck and Debus2016). On a similar note, albeit concerning method rather than research topic, Justin Grimmer and Brandon Stewart (Reference Grimmer and Stewart2013) stress that the substantial content of the dimension extracted from texts through any scale algorithm always needs to be properly understood.
The present study agrees with all such statements. Studying legislative speeches is quite relevant and in some instances an irreplaceable opportunity, given that by analysing what political leaders say during public confrontations we are in a better position to assess their relative degree of distance at that precise moment. However, researchers should devote extra attention to the substantial content of the positions of political actors obtained by the analysis of such speeches, especially if they decide to employ an unsupervised scale algorithm to texts such as Wordfish. Indeed, such recovered positions may contain not only policy considerations but also several other aspects that are, however, relevant for better definition of the intensity of the cabinet–opposition divide.
Establishing a method for measuring the level of confrontation between parties, in particular between government and opposition, is important because it can contribute to a better understanding of parliamentary dynamics. Among the many possible questions to which this index can be applied, we have focused on accounting for the survival of Japanese cabinets and the length of time needed for a cabinet to pass its bills. Our analyses demonstrate that our index better explains variation in both cabinet survival and the time cabinet bills take to pass than indices using the policy considerations alone. This confirms our theoretical expectation that the line of conflict derives not only from policy confrontations but also from many other aspects involved in politics. In this respect, what we recover by scaling legislative speeches is more than cheap talk. Moreover, we have shown how a measure of the overall distance between parties obtained through the scaling of legislative speeches appears to be more informative than a simple measure of ideological distance, given that the former index captures more information beyond the already recalled ideological distance.
It may be asked whether the dimension extracted in the Japanese Diet is applicable to other democracies. It is important to note here that the divide we showed between government and opposition is not the product of any unique aspect of the Japanese language. Proksch et al. (Reference Proksch, Slapin and Thies2011) have indeed recovered, using Wordfish, the position of Japanese parties along a clear ideological dimension using the same scaling method with documents regarding party policies, while Amy Catalinac (Reference Catalinac2016) did the same using candidate manifestos, employing a latent Dirichlet allocation. The only difference in respect of the present article is related to the texts analysed. While the former analyses were based on the electoral pledges of parties and candidates, our analysis is based on the words spoken in the parliamentary arena. These differences seem to suggest, once again, that institutional constraints matter for the content of the latent scale extracted.
Finally, if it is true that, as already noted above, by scaling roll calls it is possible to recover party positions much in line with a cabinet–opposition divide (Hix and Noury Reference Hix and Noury2016), the advantages of focusing on legislative speeches, as we have done, remain relevant: they are even more easily available than roll calls now, thanks to the growing trend of digitalization in recent years, and they cover a longer period of time (excluding the US, very few countries can present data on roll calls spanning 60 years of politics – the time period that we cover in this article using legislative speeches) as well as more countries (going back to the Japanese case, roll-call vote data are available only for a limited range).Footnote 14
There are several ways to extend the scope of the current analysis beyond our application to cabinet survival and the duration of cabinet bills. A measure such as the IGO index could be used to compare a variety of legislatures in different countries and differentiate between types of parliamentary confrontation, such as degree of adversarialness (Polsby Reference Polsby1975), or to measure the degree of relative cabinet cohesion. We have confined the analysis to a well-defined subset of legislative speeches. It would also be interesting to explore whether the patterns found in this article could be extended to another set of speeches, including at the committee level. This is obviously beyond the scope of this article.
Supplementary material
To view supplementary material for this article, please visit https://doi.org/10.1017/gov.2018.15
Acknowledgements
Curini’s work was supported by the Japan Society for the Promotion of Science (JSPS) Fellowship, grant number S-12123 and the Italian Ministry for Research and Higher Education, Prin 2015–prot. 2015P7RCL5_001. Hino’s work was supported by JSPS grant number 25780104 and 15KK0136. We would like to thank the participants in the seminars and conferences where the previous version of this paper was presented, including the Global COE at Waseda University, Waseda Institute for Advanced Studies, European Consortium for Political Research’s General Conference in Bordeaux, Bocconi University, and the Institute of Asia and Pacific Studies of University of Nottingham.