Introduction
Since the 1990s, seismic survey activities have often been a matter of controversy, because of the potential impact of the applied sound sources (air guns) on marine mammals and other marine organisms (McCauley et al. Reference McCauley, Fewtrell, Duncan, Jenner, Jenner, Penrose, Prince, Adhitya, Murdoch and McCabe2000, Gordon et al. Reference Gordon, Gillespie, Potter, Frantzis, Simmonds, Swift and Thompson2004, Nowacek et al. Reference Nowacek, Thorne, Johnston and Tyack2007). This concern applies to both industrial hydrocarbon exploration surveys (Stone & Tasker Reference Stone and Tasker2006, Johnson et al. Reference Johnson, Richardson, Yazveno, Blokhin, Gailey, Jenkerson, Meier, Melton, Newcomer, Perlov, Rutenko, Würsig, Martin and Egging2007) and academic research surveys (Malakoff Reference Malakoff2002). To mitigate the potential impact of seismic surveys on marine mammals, several countries have established guidelines that regulate the visual observation and passive acoustic monitoring of the survey area, and regulate the start-up and shut-down procedures for air guns during day and night in case marine mammals enter the mitigation zone (Castellote Reference Castellote2007, Weir & Dolman Reference Weir and Dolman2007, Compton et al. Reference Compton, Goodwin, Handy and Abbott2008). The horizontal extent of this mitigation zone, within which marine mammals might experience permanent or temporary hearing threshold shifts (PTS or TTS) due to the received sound pressure or sound exposure levels emitted by the air guns, is defined either by distance guidelines, i.e. through a fixed radius (e.g. 500 or 1000 m), or by environmental impact assessment (EIA) guidelines, i.e. through certain root mean square (rms) sound pressure (e.g. 160 or 180 dB re 1 μPa) (e.g. National Marine Fisheries 2008) or sound exposure level (SEL) thresholds (e.g. 198 or 183 dB re 1 μPa2s) (Southall et al. Reference Southall, Bowles, Ellison, Finneran, Gentry, Greene, Kastak, Ketten, Miller, Nachtigall, Richardson, Thomas and Tyack2007). In the latter case, the radius of the mitigation zone depends on the acoustic intensity, i.e. the nominal source level of the applied air-gun array, and usually increases with the air-gun array volume provided that the number of air guns is constant (Dragoset Reference Dragoset1990, Reference Dragoset2000, Caldwell & Dragoset Reference Caldwell and Dragoset2000). For example, for a typical deep-water sound velocity profile in the Weddell Sea, the horizontal mitigation radius for the 180 dB re 1 μPa rms sound pressure level threshold amounts to 625 m if a large 8 G-gun cluster of 68.2 l volume is used, but only to 100 m if a small 3 GI-gun cluster of 7.4 l volume is applied (Breitzke & Bohlen Reference Breitzke and Bohlen2010).
In the Southern Ocean, which is regulated by the Antarctic Treaty System, all seismic surveys are dedicated to academic research. They typically address topics related to the plate tectonic, palaeoceanographic and climate history of the Southern Ocean, the opening of gateways, the development of the global ocean current system, and/or the depositional history of sedimentary structures on Antarctica's continental margin and in the surrounding ocean basins. Due to the harsh environmental (ice) conditions, seismic surveys can only be conducted during the summer months and are usually 2D surveys (Cooper & ANTOSTRAT Steering Committee Reference Cooper1991, Wardell et al. Reference Wardell, Childs and Cooper2007).
Based on the Protocol for the Protection of the Antarctic Environment, established in 1991, all activities south of 60°S latitude are subject to an EIA. In the case of seismic surveys, such EIAs typically include descriptions of the geophysical characteristics of the applied sound sources, the sound propagation and the mitigation radii. These aspects have extensively been examined by field tests and modelling studies for the German icebreaker RV Polarstern (Breitzke et al. Reference Breitzke, Boebel, El Naggar, Jokat and Werner2008, Breitzke & Bohlen Reference Breitzke and Bohlen2010, Reference Breitzke and Bohlen2012) and the US seismic research vessels RV M. Ewing (Tolstoy et al. Reference Tolstoy, Diebold, Webb, Bohnenstiel, Chapp, Holmes and Rawson2004) and RV Marcus G. Langseth (Tolstoy et al. Reference Tolstoy, Diebold, Doermann, Nooner, Webb, Bohnenstiel, Crone and Holmes2009, Diebold et al. Reference Diebold, Tolstoy, Doermann, Nooner, Webb and Crone2010) in Antarctic and temperate marine environments. Additionally, the EIAs include resumes of the biological conditions and the abundances and spatio-temporal distributions of marine mammal species in the study area, and an assessment of the risk posed to marine mammals by the seismic survey activity. Furthermore, information on the amount and the spatio-temporal distribution of previous seismic surveys are also important for the EIAs to evaluate the acoustic impact of future seismic surveys on specific regions of the Southern Ocean and to assess the overall noise pollution (Boebel et al. Reference Boebel, Breitzke, Burkhardt and Bornemann2009, Reference Boebel, Breitzke, Burkhardt and Bornemann2012).
This paper follows and updates the initial approach of Miller et al. (Reference Miller, Gohl, Uenzelmann-Neben, Müller and Jokat2002) and quantifies the environmental (acoustic) impact of seismic research surveys in the Southern Ocean in the following ways: not only by the acoustic intensity of the applied air-gun arrays, but also rather by the profile length and duration of the surveys within a season, by their rate of occurrence in the whole Southern Ocean and in particular regions over several decades and, by the area of each region under consideration, i.e. by the average number of profile kilometres fired per season in an area of 1 km2 (Nigel Wardell, personal communication 2013). The cruise table, the information on the seismic equipment used and the navigation data in the Antarctic Seismic Data Library System for Cooperative Research (SDLS) (Cooper & ANTOSTRAT Steering Committee Reference Cooper1991, Wardell et al. Reference Wardell, Childs and Cooper2007) is used as input dataset:
-
• to visualize the total amount of multichannel seismic (MCS) lines acquired in the Southern Ocean up to now,
-
• to analyse, which and along how many profile kilometres specific air-gun array volumes were used to acquire these MCS lines,
-
• to determine the number, total length and spatial distribution of all MCS lines conducted by different nations,
-
• to determine the seasonal distribution of the MCS profile lengths and survey durations in the whole Southern Ocean during the last 35 years, i.e. from 1976/77 to 2010/11,
-
• to determine the seasonal distribution of the MCS profile lengths and survey durations in particular regions of the Southern Ocean and compare the acoustic impacts by the average number of profile kilometres and survey days per season and per km2, and
-
• to compare the acoustic impact of all MCS research surveys in the Southern Ocean with the acoustic impact of the industrial seismic exploration activity off Norway as an example of a region where commercial exploration for hydrocarbons is taking place, by the total amount of MCS profile kilometres and survey days, and by the corresponding average values per season and per km2 (Nigel Wardell, personal communication 2013).
Study area
The Southern Ocean is the body of water that encircles Antarctica. From a scientific point of view it reaches northward up to the Antarctic Polar Front and encloses the body of water affected by the Antarctic Circumpolar Current (ACC). However, according to the official definition of the International Hydrographic Organization (IHO) and in agreement with the Antarctic Treaty System (including the Protocol for the Protection of the Antarctic Environment), it encompasses a somewhat smaller area, which extends from 60°S latitude to the coastline of Antarctica. Based on this latter definition, which will be used throughout this study, the Southern Ocean covers an area of ∼20.3 × 10⁶ km2, which is slightly more than twice the size of the USA (9.8 × 10⁶ km2) (https://www.cia.gov/library/publications/the-world-factbook/geos/us.html, accessed March 2013). It includes the Amundsen Sea, Bellingshausen Sea, Weddell Sea, Ross Sea, Lazarev Sea, Riiser-Larsen sea (unofficial name), Cosmonaut sea (unofficial name), Cooperation sea (unofficial name), Davis Sea and Dumont d'Urville sea (unofficial name). The Southern Ocean has water depths of 4000–5000 m and only limited areas of shallow water. Antarctica's continental shelf is relatively deep with average water depths of 400–800 m at the shelf edge. Most parts of the shelf are covered by seasonal sea ice. Only few ice-free beaches exist, e.g. along the coast of the Antarctic Peninsula.
Onshore, Antarctica covers an area of ∼14 × 106 km2, which is ∼1.5 times the size of the USA (https://www.cia.gov/library/publications/the-world-factbook/geos/ay.html, accessed March 2013). Its coastline has a length of ∼18 000 km, which is slightly less than half the circumference of the earth (∼40 000 km).
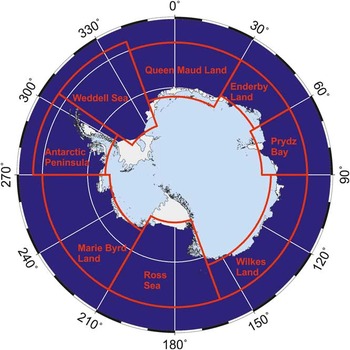
For the purposes of this study, the Southern Ocean and the adjacent onshore areas of Antarctica are divided into eight regions, which are the Antarctic Peninsula, Weddell Sea, Dronning Maud Land, Enderby Land, Prydz Bay, Wilkes Land, Ross Sea, and Marie Byrd Land (http://www.scar-sdls.org, http://sdls.ogs.trieste.it/index.php?incl=whatDataAreIn.html), accessed March 2013) (Fig. 1).
Boundaries of the eight Antarctic regions used in the Seismic Data Library System for Cooperative Research (SDLS): Antarctic Peninsula, Weddell Sea, Dronning Maud Land, Enderby Land, Prydz Bay, Wilkes Land, Ross Sea, Marie Byrd Land. Adopted and modified from http://www.scar-sdls.org, http://sdls.ogs.trieste.it/index.php?incl=whatDataAreIn.html), accessed March 2013.

Dataset
The dataset used in this paper is stored in the SDLS (Cooper & ANTOSTRAT Steering Committee Reference Cooper1991, Wardell et al. Reference Wardell, Childs and Cooper2007). Initiated in 1991, this seismic data library functions under the auspices of the Scientific Committee for Antarctic Research (SCAR) and holds all MCS data acquired in the Southern Ocean. The SDLS's objective is to facilitate scientific data exchange and open data access to all MCS data collected in the Southern Ocean for use in cooperative geoscientific research projects. The regulations, time schedules and rights for data access are described in SCAR Report No. 9 (Cooper & ANTOSTRAT Steering Committee Reference Cooper1991). They define that all digital MCS data: i) have to be submitted to the SDLS within four years of collection during which time the data collector has exclusive use of the data, ii) remain under SDLS guidelines for a further four years for use in cooperative research projects, and iii) are made openly available for general use and data dissemination eight years after collection, but with an acknowledgment to the data collector (Cooper & ANTOSTRAT Steering Committee Reference Cooper1991, Wardell et al. Reference Wardell, Childs and Cooper2007). Additionally, the navigation data of all MCS track lines should be made openly available via the SDLS almost immediately after the end of each cruise. Thus, the SDLS is not only a tool for scientific data exchange and access, but is also a tool which provides an overview of all completed MCS surveys, so that future cruises can be planned, a duplication of track lines can be avoided, and the acoustic impact on specific areas can be minimized.
This paper uses the cruise table of the SDLS (http://www.scar-sdls.org, http://sdls.ogs.trieste.it/index.php?incl=whatDataAreIn.html), accessed March 2013), which lists the area, the season, the national programme responsible and the total MCS profile length of each cruise, all navigation data and all information on the seismic equipment used, particularly on the total air-gun array volumes, available up to now. The last update of the cruise table used for this paper was on 6 September 2012. Single-channel seismic data, also collected in the Southern Ocean usually with rather small sound sources (Cunningham et al. Reference Cunningham and Vanneste1995), are not included in the SDLS and are therefore not considered in this study.
Results
National survey statistics
The total profile lengths, the spatial distribution and the number of the MCS surveys collected by different nations are analysed mainly with the objective to provide information on potential cooperation partners, who have already collected a large number of seismic survey lines and could therefore contribute to a regional study and interpretation or could complete planned future surveys, so that duplication of profile lines can be avoided and the acoustic impact be minimized.
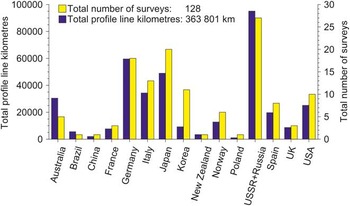
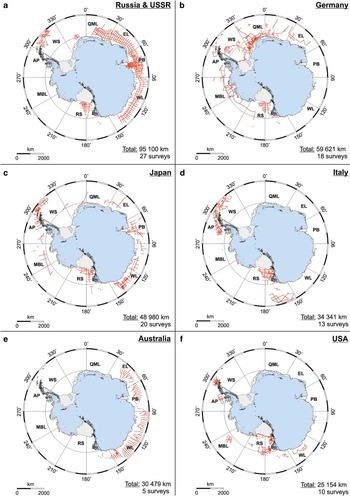
In total, 15 nations acquired MCS data in the Southern Ocean by 128 surveys with an overall profile length of 363 801 km (Fig. 2; Table S1, which will be found at http://dx.doi.org/10.1017/S095410201300031X). The USSR/Russia collected most (∼25%) of these MCS data followed by Germany (∼17%), Japan (∼14%), Italy (∼10%), Australia (∼8%) and the USA (∼7%). The spatial distributions of the seismic lines of these six nations tend to focus on areas around Antarctica, where their land station(s) are based, due to the logistic support for the ships (Fig. 3). A grid of USSR/Russian lines surrounds East Antarctica from Dronning Maud Land through Enderby Land and Prydz Bay to Wilkes Land, plus some additional lines in the Ross Sea and the northern Weddell Sea (Fig. 3a). The German lines focus on the Weddell Sea, Dronning Maud Land and Enderby Land off East Antarctica and on the Antarctic Peninsula, Marie Byrd Land and the Ross Sea off West Antarctica (Fig. 3b). Japanese lines are located in each of the eight Antarctic regions with a concentration in the Prydz Bay, Wilkes Land, Ross Sea and Antarctic Peninsula/northern Weddell Sea regions (Fig. 3c). Italian lines are collected in the Ross Sea, off the north-western Antarctic Peninsula and in the northern Weddell Sea (Fig. 3d). Like the USSR/Russian surveys, the Australian surveys acquired a series of parallel MCS lines around East Antarctica, mainly by three large cruises within a specific programme that had the objective to collect MCS data off the sector of East Antarctica claimed by Australia, i.e. from Enderby Land through Prydz Bay to Wilkes Land (Fig. 3e). The USA lines focus on the Ross Sea and some additional lines off Wilkes Land, Marie Byrd Land and the western Antarctic Peninsula (Fig. 3f).
Histogram of the total multichannel seismic (MCS) profile length and the total number of MCS surveys conducted by the 15 nations contributing to the Seismic Data Library System for Cooperative Research.

Maps of the multichannel seismic (MCS) survey lines acquired by the six nations with the highest total MCS profile lengths: a. Russia and USSR, b. Germany, c. Japan, d. Italy, e. Australia, and f. USA. The navigation data of seven USSR/Russian cruises (15 204 km) are presently still under editing in the Seismic Data Library System for Cooperative Research (28 March 2013) and are therefore not included in the maps. The total MCS profile length and number of surveys are given in each lower right corner. AP = Antarctic Peninsula, WS = Weddell Sea, QML = Dronning Maud Land, EL = Enderby Land, PB = Prydz Bay, WL = Wilkes Land, RS = Ross Sea, MBL = Marie Byrd Land.

Network of MCS lines and sound sources
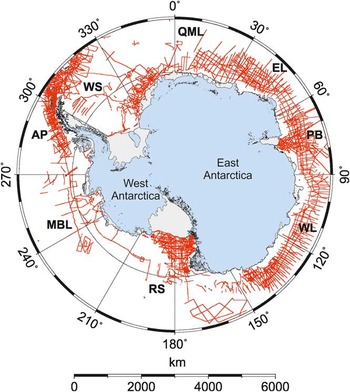
A map of all survey lines of all nations indicates that an extensive network of MCS lines is available for the Southern Ocean, which may give insight into subsurface structures (Fig. 4). However, the typical line spacing still ranges from tens to hundreds of kilometres, allowing large-scale regional investigations, but not detailed studies of specific subsurface structures. Additionally, some areas are still almost unsurveyed, either because they are difficult to reach due to the ice conditions (e.g. the south-western Weddell Sea) or have only recently come into scientific focus (e.g. Marie Byrd Land).
Map of all multichannel seismic survey lines acquired by all nations in the Southern Ocean. In total, the navigation data of three (China, Poland, Korean) cruises (3795 km) are still due and of seven USSR/Russian cruises (15 204 km) are still under editing in the Seismic Data Library System for Cooperative Research (28 March 2013) and therefore not included in the map. AP = Antarctic Peninsula, WS = Weddell Sea, QML = Dronning Maud Land, EL = Enderby Land, PB = Prydz Bay, WL = Wilkes Land, RS = Ross Sea, MBL = Marie Byrd Land.

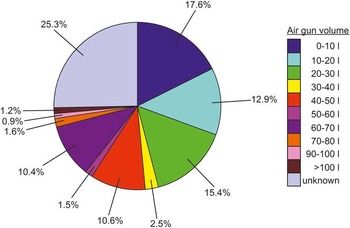
The sound sources used to acquire these MCS lines range from small single air guns or air-gun clusters consisting of 2–8 air, GI™- or water guns of less than 10 l total volume, over mid-size clusters of 2–24 air, GI™- or water guns and total volumes of up to 40 l, to larger air-gun clusters composed of up to 2–32 air, G™- or GI™-guns and total volumes of typically 40–60 l, in a few cases even of 60 to more than 100 l, comparable to the large air-gun arrays used for hydrocarbon exploration. In detail, almost a third (30.5%) of the total MCS profile kilometres were collected with small air-gun clusters of less than 20 l volume and nearly a half (48.4%) of the total MCS profile kilometres with air-gun clusters of less than 40 l volume (Fig. 5). Larger air-gun clusters of 40–50 l and 60–70 l volume were fired along only ∼10% each of the total MCS profile kilometres. Even larger arrays (>70 l), such as the 137 l array of the RV M. Ewing, were applied only during one or very few (maximum four) surveys, which altogether account for less than 4% of the total MCS profile kilometres. For 25% of the total MCS profile kilometres, no information on the seismic equipment used is available from the SDLS. This particularly refers to cruises that were conducted within the last eight years, i.e. from 2003/04 to 2010/11, where the seismic data is not openly available for general use yet, or to earlier cruises, for which the seismic data is only available on microfilm or has not yet been submitted to the SDLS by the collector (Fig. 6). Typical shot intervals ranged between 10 and 20 s (∼25–50 m shot spacing), whereupon the smaller air-gun configurations were usually fired at the shorter intervals, the larger configuration at the longer intervals.
Pie chart of the percentage distribution of the multichannel seismic (MCS) profile kilometres acquired with air-gun arrays of different total volumes in the Southern Ocean. For 25.3% of the total MCS profile kilometres no information on the type of seismic equipment used is available from the Seismic Data Library System for Cooperative Research (SDLS), either because the seismic data were acquired less than eight years ago and are therefore not openly available for general use yet, or have not yet been submitted to the SDLS by the data collector yet.

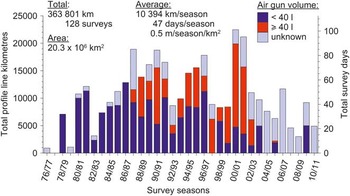
Histogram of the seasonal distribution of the total multichannel seismic (MCS) profile lengths acquired during each season from 1976/77 to 2010/11. The average MCS profile length and survey duration per season, as well as the total survey days are computed from the total MCS profile length by assuming a ship velocity of 5 knots and division by 35 seasons, and the average number of MCS profile metres per season and per km2 by a further division by the area of the Southern Ocean. The air-gun volumes used to acquire the MCS profile lines are divided into three classes (small, < 40 l; large, ≥40 l; unknown) and coded by colours.

For reasons of clarity in subsequent sections, the air-gun array volumes are divided into only three classes: 1) volumes < 40 l, 2) volumes ≥40 l, and 3) volumes of unknown size. This division has been chosen, because ∼50% of the MCS profile kilometres were collected with air-gun arrays of < 40 l volume and ∼50% with air-gun arrays of > 40 l volume or of unknown size.
Seasonal survey statistics
The seasonal distribution of MCS profile lengths are analysed to identify seasons with a high number of profile kilometres and visualize their spatial distribution in the Southern Ocean, so that the distribution and the distances between the acoustic disturbances caused by these MCS surveys can be judged at least qualitatively.
A histogram of the seasonal distribution of the MCS profile lengths of all surveys in the Southern Ocean approximately resembles a bell-shaped curve, which is overlain by several seasons with increased survey activity and only one season with no survey activity (Fig. 6; Table S2, which will be found at http://dx.doi.org/10.1017/S095410201300031X). In detail, from 1976/77 to 1987/88 the annual MCS profile length increased from ∼1000 km to ∼19 000 km, superposed by two periods with survey activities higher than the increasing trend. Only small air-gun clusters of < 40 l volume were used during this initial period of MCS research surveys. The highest annual survey activities occurred between 1987/88 and 2001/02, when both small (< 40 l) and large air-clusters (≥40 l) were used. During this time span, two- to five-year periods of ∼19 000 km annual MCS profile length alternated with two- to three-year periods of ∼9000 km annual MCS profile length. The highest numbers of MCS profile kilometres were collected during the seasons 2000/01 and 2001/02, mainly with large air-gun clusters (≥40 l) and amount to ∼21 000 and ∼22 000 km per season. A major contribution to this burst of activity was the Australian programme to collect data off the sector of East Antarctica claimed by Australia (cf. Fig. 3e). Since then, i.e. between 2002/03 and 2010/11, the annual MCS profile length has remained at a moderate to low level of ∼12 000 km or less, with an overall decreasing trend and air-gun configurations not yet disclosed to the SDLS. That is, over this most recent period the annual survey lengths have been of similar order or less than the long-term average of 10 394 km per season computed from the total MCS profile length of all surveys for the 35 seasons under consideration. For an average ship velocity of 5 knots, this average MCS profile length per season means that air-gun sounds are emitted into the whole Southern Ocean for an average duration of 47 days per season, i.e. into an area of slightly more than twice the size of the USA during ∼1.5 months. Set in relation to the area of the whole Southern Ocean, this average MCS profile length means that 0.5 m seismic profile lines were collected per season within an area of 1 km2 (Nigel Wardell, personal communication 2013), or in other words, 50 m seismic profile lines were collected per season within an area of 10 × 10 km2, which corresponds to approximately two air gun shots fired per season in an area of 10 × 10 km2 at a shot interval of 10 s (25 m shot spacing at 5 knots).
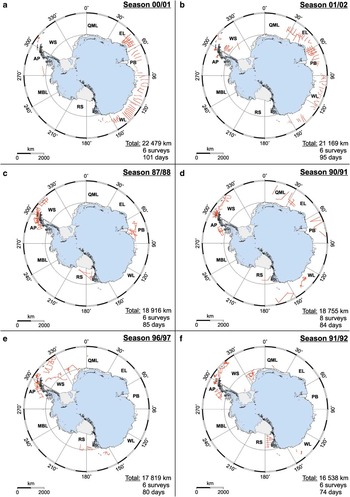
Figure 7 illustrates the spatial distribution of the MCS survey lines during the six seasons with the highest number of profile kilometres. For reasons of clarity, coloured identification of the profile lines according to the applied air-gun volumes is not used. During the two seasons 2000/01 and 2001/02 with the highest survey activity due to the large Australian programme (cf. Fig. 3e), the seismic lines concentrate mainly around East Antarctica with an average line spacing of 100 km and more, and total survey durations of 101 and 95 days, i.e. in an area covering approximately one third of the Southern Ocean and with durations of approximately three months (Fig. 7a & b). During the other four seasons 1987/88, 1990/91, 1996/97 and 1991/92 the seismic lines were not acquired in adjacent regions, but are rather distributed over the whole Southern Ocean (Fig. 7c–f) leading to widely spread air-gun sound emissions into the Southern Ocean for 85, 84, 80 and 74 days. Some concentration of activity in the Antarctic Peninsula/Weddell Sea region occurred during the seasons 1987/88, 1990/91, 1996/97 and 1991/92 (Fig. 7c–f).
Maps of the multichannel seismic (MCS) survey lines acquired during the seasons with the six highest total MCS profile lengths: a. season 2000/01, b. season 2001/02, c. season 1987/88, d. season 1990/91, e. season 1996/97, and f. season 1991/92. The navigation data of one Chinese cruise (2015 km) are due in season 1990/91. The total MCS profile length and number of surveys and the total survey duration computed from the total MCS profile length by assuming a ship velocity of 5 knots are given in each lower right corner. AP = Antarctic Peninsula, WS = Weddell Sea, QML = Dronning Maud Land, EL = Enderby Land, PB = Prydz Bay, WL = Wilkes Land, RS = Ross Sea, MBL = Marie Byrd Land.

Regional survey statistics
Histograms of the seasonal distribution of the MCS profile lengths in the eight Antarctic regions illustrate the amount and the rate of occurrence of air-gun surveys in these regions and allow an assessment of their regional acoustic impact in detail (Fig. 8, Table S3, which will be found at http://dx.doi.org/10.1017/S095410201300031X).
Histograms of the seasonal distribution of the total multichannel seismic (MCS) profile lengths acquired in the eight Antarctic regions during the seasons 1976/77 to 2010/11: a. Antarctic Peninsula, b. Wilkes Land, c. Ross Sea, d. Weddell Sea, e. Prydz Bay, f. Queen Maud Land (Dronning Maud Land), g. Marie Byrd Land, and h. Enderby Land. The area, the total MCS profile length and number of surveys, the average MCS profile length and survey duration per season and the average number of MCS profile metres collected per season in an area of 1 km2 are given in each upper left or right corner. The average MCS profile length and survey duration per season, as well as the total number of survey days are computed from the total MCS profile length by assuming a ship velocity of 5 knots and division by 35 seasons, and the average number of MCS profile metres per season and per km2 by a further division by the area of each region. The air-gun volumes used to acquire the MCS profile lines are divided into three classes (small, < 40 l; large, ≥40 l; unknown) and coded by colours.

Even in the Antarctic Peninsula region, which experienced the highest total number of surveys (i.e. 40) and the highest total MCS profile length (i.e. 90 356 km), seismic surveys were not conducted in every season between 1976/77 and 2010/11. Rather, periods of five to six years duration with seismic survey activity and a maximum annual survey length of ∼13 000 km are followed by periods of at least one year duration with no seismic survey activity (Fig. 8a). This similarly also applies to the Wilkes Land, Ross Sea, Weddell Sea and Prydz Bay regions, in which the total number of MCS profile kilometres decreases successively, and the annual MCS profile lengths are typically lower than ∼8000 km (except seasons 2000/01 and 2001/02 in Wilkes Land with the three large Australian cruises, cf. Fig. 6) (Fig. 8b–e). Additionally, the durations of the periods with seismic survey activity shorten to a maximum of three to four years, whereas the interruptions with no seismic survey activity extend to two to five years. In the remaining three regions Dronning Maud Land, Marie Byrd Land and Enderby Land these periods further increase and are only interrupted by short (one to three years) periods with seismic survey activity, when the maximum annual MCS profile lengths do not exceed 5000 km (Fig. 8f–h). In the eight regions no specific air-gun configurations and volumes were preferentially used. Instead, seasons in which large air-gun array volumes (≥40 l) dominate, alternate with seasons in which small air-gun volumes (<40 l) prevail.
A computation of the average MCS profile lengths and survey durations per season indicates that the Antarctic Peninsula region was subject to the highest survey activity. There, an average of ∼2600 km of MCS profile lines were acquired per season during ∼12 survey days in an area (2.8 × 10⁶ km2) slightly less than approximately one third of the size of the USA (Fig. 8a). For the Wilkes Land, Ross Sea, Weddell Sea and Prydz Bay regions these average values decrease from ∼2000 km per season to ∼1700 and ∼1300 km per season and from approximately nine survey days per season to approximately eight and approximately six survey days per season, while the affected areas range from 1.6–3.2 × 10⁶ km2, i.e. from approximately one sixth to one third the size of the USA (Fig. 8b–e). For the remaining three regions the average MCS profile lengths and survey durations per season are less than 1000 km and less than four days respectively (Fig. 8f–h).
If, additionally, the average MCS profile lengths per season are examined in relation to the areas of the corresponding regions, it turns out that the Antarctic Peninsula, Prydz Bay and Wilkes Land regions experienced the highest acoustic impact, which exceeds the average value of 0.5 m per season and per km-2 of the whole Southern Ocean (cf. Fig. 6) and amounts to 0.7–0.9 m per season and per km-2 (or 70–90 m seismic profile lines per season within an area of 10 × 10 km2). That means, maximum approximately three to four shots were fired per season within an area of 10 × 10 km2 at a shot interval of 10 s (25 m shot spacing at 5 knots). In the other five regions the acoustic impact is lower than the average value of the Southern Ocean and ranges between 0.1 m per season and per km-2 (Marie Byrd Land) and 0.4 m per season and per km-2 (Ross Sea, Weddell Sea). That is, approximately one to two shots maximum were fired per season within an area of 10 × 10 km2 at a shot interval of 10 s at 5 knots.
Comparison with industrial seismic exploration off Norway
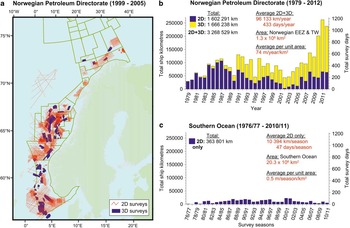
To provide a further perspective on the amount of seismic research survey activities in the Southern Ocean, the seasonal distribution of the MCS profile length is compared to the amount of industrial 2D and 3D seismic surveys acquired off Norway between 1979 and 2012, as an example of commercial hydrocarbon exploration activities (Fig. 9). For reasons of clarity, as example these commercial seismic lines are visualized only for the period 1999–2005, i.e. for approximately one fifth of the whole time span under consideration (Fig. 9a). In the following discussion only ship track lengths (and not common depth point (CDP) kilometres) are considered, because seismic shots are fired only along these track lines, which are therefore relevant for quantifying the acoustic impact.
a. Map of the industrial seismic exploration survey lines acquired off Norway between 1999 and 2005 (provided by Harald Brekke, Norwegian Petroleum Directorate). b. Histogram of the total 2D and 3D seismic ship track lengths acquired off Norway from 1979–2012 (provided by Harald Brekke, Norwegian Petroleum Directorate). EEZ = exclusive economic zone, TW = territorial waters (12 nm zone). c. Histogram of the seasonal distribution of the total multichannel seismic (MCS) profile length of the 2D seismic research surveys in the Southern Ocean scaled to the same maximum value as in b. The average MCS profile length and survey duration per year are computed from the total MCS profile length by assuming a ship velocity of 5 knots and division by 34 or 35 seasons, respectively and the average number of profile metres per year and per km2 by a further division by the area of the Norwegian EEZ & TW or the area of the Southern Ocean, respectively.

Since the beginning of the 1990s, most of the industrial exploration surveys were conducted as 3D surveys along the Norwegian continental margin with an overall ship track length of 1 666 238 km, whereas 2D seismic data acquisition prevailed in the 1980s with an overall seismic profile length (= ship track length) of 1 602 291 km (Fig. 9b). This means that in total 3 268 529 km of 2D and 3D seismic ship track lines were collected within a time interval of 34 years, which is approximately nine times more than the total of 363 801 km acquired during 35 seasons of seismic research in the Southern Ocean (Fig. 9c). This similarly holds true for the average values per year, where 96 133 km per year and 433 days per year of commercial seismic data acquisition compare with the approximately nine times lower values of 10 394 km per season and 47 days per season of 2D seismic research surveys in the Southern Ocean. However, the area of the exclusive economic zone (EEZ) and territorial waters (TW) of the Norwegian mainland (1.3 × 10⁶ km2) (http://en.wikipedia.org/wiki/Exclusive_economic_zone#Norway, accessed March 2013) covers only 6.4% of the area of the Southern Ocean. Thus, on average 74 m of commercial 2D and 3D seismic ship track lines were collected per year in an area of 1 km2 off Norway, compared to only 0.5 m of 2D seismic research surveys per season in an area of 1 km2 in the Southern Ocean (Nigel Wardell, personal communication 2013). In other words, on average ∼300 shots were fired per year at an interval of 10 s (25 m shot spacing at 5 knots) within an area of 10 × 10 km2 off Norway, compared to only approximately two shots per season in an area of the same size in the Southern Ocean at the same shot interval. That is, the acoustic impact of the commercial 2D and 3D seismic surveys off Norway is ∼150 times higher than the acoustic impact of the seismic research surveys in the Southern Ocean, provided that the same shot interval and the same time span are assumed, during which seismic surveys are possible due to the weather conditions (e.g. only approximately four to five months during the summer in the Southern Ocean), and the air-gun array volumes are neglected.
However, if it is additionally taken into account that ∼50% of the MCS profile kilometres in the Southern Ocean were acquired with small air-gun clusters of < 40 l volume, which typically have ∼15–20 dB (approximately six to ten times in sound pressure amplitude) lower nominal peak-to-peak source levels (SL ≈ 240–250 dB re 1 μPa) (Richardson et al. Reference Richardson, Greene, Malme and Thompson1995, Breitzke et al. Reference Breitzke, Boebel, El Naggar, Jokat and Werner2008, Tolstoy et al. Reference Tolstoy, Diebold, Doermann, Nooner, Webb, Bohnenstiel, Crone and Holmes2009, Breitzke & Bohlen Reference Breitzke and Bohlen2010) than the large air-gun arrays of > 100 l volume, typically used for hydrocarbon exploration surveys (SL ≈ 260–264 dB re 1 μPa) (Johnston et al. Reference Johnston, Reed and Desler1988, Caldwell & Dragoset Reference Caldwell and Dragoset2000), then the value of an approximately 150 times higher acoustic impact of the industrial seismic exploration off Norway must be considered as a minimum value. The reason is that a consideration of the air-gun array volumes and the associated source levels implies that the length of the mitigation radii for given sound pressure level thresholds also become important for the quantification of the acoustic impact, such that the ensonified horizontal circular areas and half-sphere volumes around the air-gun shot positions increase with the square and the cube of the mitigation radii respectively. In particular, as the (total) mitigation radii of single air-gun shots increase linearly with the sound pressure amplitude of the source signal (Breitzke & Bohlen Reference Breitzke and Bohlen2010), ∼15–20 dB higher source levels imply approximately six to ten times larger mitigation radii, ∼36–100 times larger horizontal areas, and ∼216–1000 times larger volumes ensonified with sound pressure levels higher than the threshold associated with the mitigation radii. Combined with the ∼150 times higher number of profile metres (or shots) per year and per km2, this leads to an ∼5400–15 000 times higher acoustic impact of the industrial seismic exploration off Norway, compared to the seismic research surveys in the Southern Ocean, if the ensonified horizontal circular areas of each single shot are taken into account, and to an approximately 32 400–150 000 times higher acoustic impact, if the corresponding ensonified half-sphere volumes are also considered. These values do not take account of any interaction and cumulative effects of multiple shots, e.g. along a seismic line. If such multiple effects are also taken into account, the contrast between the acoustic impacts of the industrial seismic exploration off Norway and the seismic research surveys in the Southern Ocean will even be higher, because then the (total) mitigation radii increase with the square of the amplitude of the source signal P0 (Breitzke & Bohlen Reference Breitzke and Bohlen2010), and the ensonified half-cylinder volume beneath the seismic line with the square of the radius, leading to a P0 4-dependence for the ensonified volume V (V∼P0 4), compared to a P0 3 dependence (V∼P0 3) in the case of single shots.
Summary
Based on the data from the SDLS the national, seasonal and regional distributions of seismic research surveys are analysed to assess their potential acoustic impact on marine mammals in the Southern Ocean. The results are:
-
1) Each country tends to collect more seismic research data in the area around where its land station is based, due to the logistic constraints of the ship.
-
2) Overall, a rather extensive network of seismic lines surrounding Antarctica has been acquired in the Southern Ocean up to 2012, but the line spacing is still in the order of tens to hundreds of kilometres.
-
3) Almost 50% of all MCS profile kilometres were acquired with relatively small air-gun clusters of < 40 l volume and only ∼25% with larger air-gun clusters of > 40 l volume. For the remaining 25% of the MCS profile kilometres, the air-gun configuration used is not yet published.
-
4) The seasonal (i.e. yearly) distribution of the MCS profile length of all surveys in the Southern Ocean shows some periods of significantly greater than average seismic survey activity with a maximum survey length and duration of ∼22 000 km and ∼101 days in season 2000/01. However, the corresponding survey lines have a spacing of at least 100 km and more, and are usually distributed over areas covering at least a quarter to one third of the Southern Ocean. This agrees with an acoustic impact of 0.5 m per season and per km2, derived from the area and the total number of MCS profile kilometres collected in the Southern Ocean.
-
5) From 2002/03 to 2010/11 the seasonal survey activity remains on moderate/low levels with MCS profile lengths and survey durations of less than ∼12 000 km and ∼54 days per season distributed over great parts of the Southern Ocean.
-
6) The seasonal distribution of the MCS profile lengths in the eight Antarctic regions shows that during the last 35 years, i.e. between 1976/77 and 2010/11 seismic survey activity did not occur in all summer seasons. Instead periods with seismic survey activity are interspersed by periods with no seismic survey activity. The average MCS profile length and survey duration range from ∼2600 km and ∼12 days per season off the Antarctic Peninsula to ∼260 km and ∼1 day per season in Enderby Land, and the acoustic impact from 0.9 m per season and per km2 off the Antarctic Peninsula to 0.1 m per season and per km2 off Marie Byrd Land.
-
7) A comparison with the industrial seismic hydrocarbon exploration off Norway between 1979 and 2012 illustrates that in total and on average per year approximately nine times more commercial 2D and 3D seismic ship track lines were collected along the Norwegian continental margin than 2D seismic research surveys in the Southern Ocean. If these average values are set in relation to the areas of the Norwegian EEZ and the Southern Ocean, then the acoustic impact of the hydrocarbon exploration surveys off Norway, quantified by the number of seismic profile metres fired per season in an area of 1 km2, turns out to be ∼150 times higher than the acoustic impact of the seismic research surveys in the Southern Ocean. This value increases to an approximate 5400–15 000 times higher acoustic impact, if the horizontal circular areas ensonified by the different air-gun array volumes used for hydrocarbon exploration and for seismic research in the Southern Ocean are taken into account, and to an approximate 32 400–150 000 times higher acoustic impact, if the ensonified half-sphere volumes of single shots are considered, too.
Finally, it is worth noting that it is beyond the scope of this paper to judge, in general, if seismic research surveys can harm marine mammals in the whole Southern Ocean or in particular regions of the Southern Ocean. This study can only be one small part of an EIA. For an overall assessment of the risk posed to marine mammals by seismic research surveys in the Southern Ocean the biological conditions and the spatio-temporal distributions and abundances of particular marine mammals species in the region(s) under consideration must also be taken into account.
Acknowledgements
I thank all data collectors who contributed to the SDLS, Alan Cooper and Nigel Wardell for their assistance in editing an early version of the navigation data of the SDLS, Harald Brekke for providing the data from the Norwegian Petroleum Directorate and Matthias König for his support in plotting the coastline, ice-shelves, islands and nunataks of Antarctica. The paper greatly benefited from the constructive reviews of Emma Suriñach, Rob Larter, Alan Cooper and Nigel Wardell, and the valuable comments of the editor Alan Vaughan. The maps of the Southern Ocean and Antarctica were generated with the free Generic Mapping Tool (GMT) software (Wessel & Smith Reference Wessel and Smith1991). The manuscript was written within a cooperation project between the Alfred Wegener Institute for Polar and Marine Research, Bremerhaven and the Universität Bremen.
Supplemental material
Three supplemental tables providing detailed information on the national, seasonal and regional distributions of the MCS research surveys in the whole Southern Ocean and in the eight Antarctic regions will be found at http://dx.doi.org/10.1017/S095410201300031X.