


I. INTRODUCTION
Recently live video and internet are introduced in aircrafts. The systems presently available are mechanically or hybrid mechanically/electronically steered antennas operating in Ku-band. This paper presents a full phased array antenna receiver tile including two dedicated radio frequency integrated circuits (RFICs) (RFIC1 and RFIC2, Fig. 2). A phased array calls for phase or time compensation of the signals from the antenna elements to get beamforming. The first small groups of antenna elements are compensated with delays provided by RFIC1 and RFIC2. Further beamforming is performed by an optical beam forming network (OBFN) [Reference Roeloffzen, van Dijk, Marpaung, Burla and Zhuang1].
A moving terminal calls for real-time beam direction steering. The application demands simultaneous reception of TV signals in two separate, but adjacent satellite bands. This requires a bandwidth (BW) of 2.05 GHz at 10.7–12.75 GHz radio frequency (RF). Within this BW, group delay variations over frequency must be minimized to avoid dispersion of data signals. Traditional phased array solutions suffer from limited BW [Reference Hashemi, Guan, Komijani and Hajimiri2] and/or limited processing capabilities like missing polarization discrimination [Reference Hashemi, Guan, Komijani and Hajimiri2, Reference Chu, Roderick and Hashemi3]. With RFIC1 of the receiver these items are addressed by using full post-processing at intermediate frequency (IF)-level. Due to the high instantaneous BW, traditional phase compensation for the antenna elements cannot be used because this would make the beam shape deform over frequency (beam squint). Therefore true time delays (TTDs) are used, which must be placed in either the RF path [Reference Chu, Roderick and Hashemi3, Reference Natajaran4] or the IF path [this work]. Some solutions have limited TTD resolution [Reference Hashemi, Guan, Komijani and Hajimiri2, Reference Natajaran4] and therefore limit the accuracy of highly focused beams. This work uses a novel implementation for TTD, resulting in continuous delay adjustment.
The architecture of RFIC1 is shown in Fig. 3. It has a low-IF concept to enable non-complex implementations for image rejection mixer, filter, phase correction, TTD, addition, and polarization discrimination, since the IC-process speed is a multiple of the IF-frequency.
So there is some “overkill” in speed that is used to create quasi simple and robust circuit solutions. The choice of IF frequency value was based on standard set-top boxes. The antenna elements are coupled single ended to an external GaAs low noise amplifier (LNA) with a noise figure (NF) of ~1 dB including printed circuit board (PCB) losses. The output of this LNA is fed to RFIC1, also single ended. RFIC1 was simulated to have a NF of 3 dB, which keeps the antenna tile NF below 2 dB.
Processing at IF-level offers lower power consumption because of the lower frequency (0.95…3 GHz). TTD correction at IF-level avoids multiple local oscillator (LO)-distribution paths as used in other solutions [Reference Hashemi, Guan, Komijani and Hajimiri2] which would increase power consumption. Further post-processing offers complete polarization discrimination, delivering true vertical and horizontal (V–H) outputs, while the antenna receives a random rotation angle (α) of polarization. Direction parameters F(w) (Θ, ϕ and α) are fed to the receiver in real-time, in order to keep the beam focused at the satellite at all times. These direction parameters are extracted from the vehicle's navigational instruments, the exact method exceeds the scope of this paper.
A new RF-board stackup consisting of 15 metal layers is devised, designed, and manufactured which integrates both antenna and RF electronics. The tile consists of 64 antenna elements with dual polarization. This gives 128 Ku-band inputs with GaAs LNAs combined to 8 (4 dual polarized) IF outputs by the RFICs in low temperature co-fired ceramic (LTCC) ceramic ball grid array (CBGA) packages.
With a footprint of 94 × 94 mm2 it achieves a density of 1.45 channels/cm2. To the best of our knowledge this is the first time such a highly integrated planar Ku-band receiver tile is presented and demonstrated.
II. SYSTEM OVERVIEW
(A) The antenna architecture (Fig. 1) consists of 24 receiver tiles, an OBFN, LO generator (9.75 GHz), and a controller/power supply. It features 4 × 4 sub-arrays with down conversion and local IF beamforming (TTD) before optical beamforming (OBFN). The use of time delay prevents squinting of the beam, resulting in instantaneous reception of both polarizations over the full BW and scan angle. A receiver tile (Fig. 2) consists of an array of 8 × 8 dual polarization antenna elements with GaAs LNAs which are combined by the two distinct RFICs in bespoke packages. This is all (including signal distribution and glue components) integrated on/in a single PCB measuring only 94 × 94 mm2. The total thickness is 10 mm. The antenna element concept is discussed in [Reference Hulzinga, Verpoorte, Venkatarayalu and Thain5] and updated for the PCB stackup used in this project. To achieve the required BW an antenna element uses two stacked patch resonators excited by two offset feedlines coupled through a dog-bone aperture. It receives both X and Y polarization (related to the antenna, not to the satellite).
The complete array contains 1536 antenna elements, divided into 24 tiles of 64 antennas.

A tile contains 64 antenna elements. These are sub-divided in 4 × 4 groups.

(B) The RFICs are realized in NXP's QUBIC4-Xi BiCMOS SiGe 0.25 μm process technology. RFIC1 combines the outputs of four antenna elements (i.e. 8 RF input signals). Each input has its own complete receiver channel (Fig. 2), providing low noise amplification, down conversion, IF filtering, mixer phase correction, and TTD. After summation of four channels, there is polarization discrimination and a variable gain amplifier (VGA) and an output driver. The outputs are two differential IF signals, one for each polarization (V and H). The outputs of four RFIC1s are combined by the second chip, RFIC2. RFIC2 provides an input buffer, longer TTD, summation of four RFIC1 outputs, and a variable gain output buffer. RFIC2 will not be discussed in this paper.
(C) The receiver channels in RFIC1 are designed with fully differential signal paths (except for the RF input) to minimize substrate coupling and electro magnetic interference (EMI) to adjacent channels. For the same reason, the channels are placed some physical distance (~200 μm) apart. The channels must be as identical as possible to present the same time delay and gain. Small differences are calibrated out with the adjustable TTDs and VGAs. All IC circuit blocks are designed with voltage in/outputs to avoid power loss in termination resistors. Summation is done with currents. Two I/Q generators/drivers are included for the LO distribution on-chip using 75 Ω micro strips because of the longer distribution length. Each generator drives four channels and has a considerable power consumption of 135 mW due to the need for termination resistors at the micro strips. One driver per side is used for easy routing over the chip, so LO distribution is limited to eight micro strips per side. A master LO signal of 9.75 GHz is provided externally.
III. RECEIVER CHANNEL RFIC1
The receiver front-end is set up as a low-IF system (Fig. 3). Quadrature down-mixing is used in combination with a band-pass filter (BPF) to suppress images. The low-IF system is chosen to enable power efficient IF-processing. The LNA is a basic cascode design in bipolar technology (f T = 185 GHz). To suppress the noise of all post processing, the LNA has 22 dB gain. A constant group delay within the whole IF-chain over the full BW is crucial. Therefore the LNA tank circuit's Q has to be lowered to reach a Bessel response at a wide BW (2 GHz). The mixer is a basic Gilbert type switching multiplier. By choosing the load impedance at the output as high as possible, a conversion gain of 12 dB could be realized. A continuous-time active poly-phase (APP) BPF was designed to create 2 GHz of IF BW, also with minimal group delay variations (Bessel response). Also the TTDs are designed for minimal group delay variations as discussed in Section VI.
One of four dual-polarized receiver channels in RFIC1.

IV. PHASE CORRECTION
The shift in frequency from RF to IF has consequences for the delay requirements [Reference Soer, Klumperink, Nauta and van Vliet6]. For beam-forming at IF it is required that the initial time difference τ between antenna elements also appears at IF. It can be shown that after mixing also a phase shift occurs which depends on τ and the LO frequency (ω o ) [Reference Soer, Klumperink, Nauta and van Vliet6]:
 $$\Delta \varphi = - {\omega _o} \cdot \tau + ({\varphi _1}),$$
where φ 1 is the initial phase of the two RF signals. The I/Q signals at the BPF outputs (see Fig. 3) are used to construct a vector modulator to correct this according to:
 $$S = I \cdot {\rm sin(}\Delta \varphi {\rm )} + Q \cdot {\rm cos(}\Delta \varphi {\rm )}{\rm.} $$
V. APP BPF
(A) The I/Q signals from the mixers can be utilized to add complex poles to a set of second order low-pass filters (LPFs) to achieve an APP BPF [Reference Behbahani, Kishigami, Leete and Abidi7].Two cross-coupled gyrators Gc (Fig. 4) transform the low-pass function into a band-pass function by shifting ω n of the LPF to a higher positive frequency [Reference Nauta8]. This way IF filtering can be made active and tuneable by manipulating the gyration constants with little group delay variation. The LPFs are implemented as fully differential, second order bi-quads. When ω IF is the desired center frequency of the BPF, the g m of the cross-gyrators (Gc) is given by:
 $${g_{m\_Gc}} = {\omega _{IF}} \cdot C.$$
The BW is given by:
 $$BW = 2 \cdot {\omega _n} = 2 \cdot {\rm} {g_{m\_Gm}}/C.$$
Since the IF-filter operates from 1 to 3 GHz, the current-conveyors in the gyrators must have at least 3 times more BW to not disturb the filter performance. This calls for a simple current-mode implementation to reach the highest BW at the given transistor f T (185 GHz).
Differential second order APP BPF.

(B) The gyrators are implemented as differential pairs with current-mode feedback (Fig. 5). Bias current was chosen as low as 400 μA per transistor for a f T of 43 GHz of the HBTs. An emitter resistor Rgm provides the feedback, extending the conveyor BW to over 10 GHz. Rgm also linearizes the large-signal transfer, improving IP3 and 1 dB compression point. The gyrator constant is approximated by:
 $${g_m} = \displaystyle{1 \over {[2.k.T/(q.Ie + {\rm Rgm})]}}.$$
Rgm is chosen only ~4 times higher than k.T/q.Ie, so the transfer g m can still be manipulated with the transistors bias-current Ie. Since temperature is part of the expression, g m is stabilized with a proportional to absolute temperature (PTAT) bias current (Ie). It is important to keep common-mode (CM) gain below unity in all sub-cells to prevent CM oscillations. Therefore a CM-feedback circuit is used, which also fixes the voltages at the collectors of Q1–Q4. The PMOS current sources M1–M4 have a feedback for CM only via M5/6 and R1–R4.
Gyrator implementation.

VI. TTD
(A) The antenna elements are placed on a orthogonal grid (d = 12 mm), so the largest time delay between two adjacent elements is 57 ps (90° beam angle). This delay must remain constant over the entire IF BW, target value within 2 ps to avoid dispersion of the signal. The TTD is based upon a traditional first-order all-pass filter body, extended with an adjustable gain factor in the high-pass filter (HPF) path to make it programmable, see Fig. 6. The ‘REF’ path is just a connection to transport the input signals to the adder.
Prototype programmable TTD.

Basic simulations with ideal circuitry showed that in the IF-band the group delay remains constant within 1.5 ps over frequency, at a programming range from 3 to 27 ps (Fig. 7). More of these cells cascaded can be used to reach the required range of 57 ps. However, with circuits having a BW limitation, the flatness for group delay is deteriorated. The effect of a BW limitation to 8 GHz is shown in Fig. 8, the dashed traces being the BW limited performance. This effect can be partly corrected by adding a zero in the REF path (Fig. 9). The zero frequency must be ~1.4 times higher than the pole frequency (11.4 GHz). At high gain setting the performance improves to a flatness of 2.5 ps, at low gain settings group-delay flatness gets a bit worse, but still within 2.5 ps. Overall there is improvement, see Fig. 8 (the dotted traces). The TTD is implemented in current-mode architecture for the highest wide-band performance of the paths, see Fig. 10.
Prototype programmable delay with 24 ps range and 1.5 ps flatness, at minimum and maximum of the range.

Prototype delay (solid), BW limited delay (dashed), and corrected delay (dotted).

Correction of BW limitation with a zero.

Implemented TTD.

(B) Q1/2 and Q11/22 present the REF path, Q11/22 act as voltage-to-current converter with current-mode feedback with Rgm. The zero is implemented as a small capacitor (Czero) between the emitters. Q7/8 presents the high pass (HPF) path, featuring a capacitor (C_highpass) between the emitters, thereby implementing the HPF action. The output current of Q7/8 is fed into a Gilbert multiplier (Q3–Q6) and then subtracted from the currents of the REF path. R5/6 converts the sum-currents into the output voltage. The total voltage gain can be chosen with the value of R5/6, but these resistors also determine the BW limiting pole of both paths, therefore they cannot be chosen too high. The gain was set at 1.2 V/V to overcome some losses in parasitic capacitances. The multiplier is controlled by the (linear) output currents of Q30/31 and the voltage across Q20/21. Q30/31 converts the controlling digital to analog converter (DAC) voltage into a linear current via RT1. Since temperature is part of the gain expression of the differential pairs, gm is stabilized with a PTAT bias current. All tail currents are set at 300 μA. With a supply voltage of 3 V the power consumption of one TTD cell is 5.4 mW. To reach the range for 90° beam angle, three cells are cascaded to yield 69 ps of delay range, with flat group delay (<2.5 ps).
VII. POLARIZATION DISCRIMINATION
(A) Fig. 2 shows how the satellites’ H- and V-polarizations can be received by the antenna elements. In our system we call the received signals X and Y to relate them to the board, not to the satellite. When there is an angle ‘α’ between satellite and receiver, the received signals are still two orthogonal components X/Y, but each holding a part of the V and H (beam) signal. These X/Y signals are summed. Even though these signals are not representing H and V, they are still orthogonal and therefore can be rotated back to H/V by means of a vector modulator (Fig. 11).
Vector modulator with VGAs.

The on-chip modulator uses four 4-quadrant Gilbert-cell VGAs according to:
 $$\eqalign{V & = - X \cdot {\rm sin(}\alpha {\rm )} + Y \cdot {\rm cos(}\alpha {\rm )} H \cr & = X \cdot {\rm cos(}\alpha {\rm )} + Y \cdot {\rm sin(}\alpha {\rm )}{\rm.}}$$
The performance was measured by feeding the receiver with an X- and Y-signal each containing 50% V-signal and 50% H-signal (α = 45°). In the resulting V-signal after discrimination < −30 dB X-signal was found (relative to the wanted Y-signal), and vice versa for the H-signal containing < −30 dB V-signal. Therefore the measured discrimination exceeds 30 dB.
Orbital C/I values for digital video broadcasting satellite (DVBS) in Ku-band are in the range of 10–20 dB, therefore 30 dB V–H isolation is sufficient to neglect this interference.
(B) The RFIC1 chip photograph Fig. 12 shows two rectangular channel layouts in each corner. At the mid of the left and right edges there are the LO drivers. They drive the micro strips for LO-distribution through the middle of the channels. At the top-mid the IF output drivers are placed. Below those the polarization and adder circuits are positioned. At the bottom-mid the SPI bus is placed.
RFIC1 chip photograph, die area is 3.8 × 4 mm2.

VIII. BOARD DESIGN
The following is integrated in or assembled onto the RF PCB (the tile):
-
• 64 antenna elements with two polarizations each
-
• 128 discrete GaAs LNAs with bias-Ts
-
• 32 bias controllers for the GaAs LNAs
-
• 16 RFIC1s
-
• 4 RFIC2s
-
• LO distribution
-
• RF rerouting
-
• IF routing
-
• DC and control routing
-
• LO, IF, digital, and DC connectors
The vast amount of RF, IF, and LO signals to be routed along with the requirements on isolation (30 dB) resulted in the 15-layer stack up of Fig. 13. Despite the high number of layers and use of high frequency laminates it is designed to only use mainstream PCB process steps and tolerances to keep the cost down. 64 antenna elements are integrated in the antenna part of the PCB. This is a vast cost saving, but constrains component placement to a single side.
Antenna board stackup, the actual antenna is mounted on the PCB.

The RF stripline follows where bias-Ts are placed for the gates of the GaAs LNAs and where the antenna signals are rerouted to the positions needed at the component side. All signals are kept equal in length and reflection characteristics. If these paths differ there will be an amplitude and phase ripple which is different from antenna to antenna, giving a variation in beam shape (including pointing error) over frequency.
A second stripline follows for LO distribution and IF routing (between RFICs and to the output connector). Each RFIC1 has two LO inputs (32 in total). These are distributed from two coaxial LO input connectors by means of unisolated splitters. This keeps the PCB simple, but voltage standing wave ratio (VSWR) interaction gives power and phase differences. RFIC1 is insensitive to these power variations and can correct the phase variations.
A layer is used for routing a reference voltage and a digital serial bus to the RFICs and gate and drain bias voltages for the GaAs LNAs. Below this the supply plane is realized powering all components from a single common positive supply. The bottom serves as microstrip for routing the RF signals and drain bias-Ts as well as being the component side.
IX. CBGA PACKAGE DESIGN
The package has been constructed of two main layers of LTCC. The bottom is covered by overglaze while a thin LTCC layer is used at the top to act as soldermask and to confine the electro magnetic (EM) field close to the microstrip transmission lines, aiding isolation. Routing on the package features equal length for all RF and IF signals.
The chip has been balled and flip chip mounted to the package (Fig. 14) with underfill for environmental and mechanical protection. Both packages are 9 × 9 CBGAs with 1 mm pitch and 0.7 mm non collapsible balls. Even though it is perfectly possible to use bond wires for signal transfer, the flip chip does give better isolation (no radiating bond wires) and lower inductance from the supply planes to different chip blocks. Both the positive supply and the ground are available underneath the chip which makes it possible to keep them both separated on-chip to prevent coupling. All transitions to the PCB and to the RFICs have been simulated with a three-dimensional EM simulator and designed to give < −20 dB reflection.
RFIC1 die with balls, and the CBGA (unequal scale).

X. COMPARISON OF ANTENNA SOLUTIONS
The antenna tile presented in this paper is compared with other work, see Table 1. The significance of this work is in the level of integration of both antennas and RFICs. [Reference Sanadgol, Baggen, Arias Campo, Hulzinga and Verpoorte9, Reference Baggen, Vaccaro, Llorens del Río and Padilla10] are similar in intended function and therefore the main functional parameters are comparable (Table 1). This work sets a new standard in number of channels per area (density (ch/cm2)) and DC power consumption per channel (Pdc (mW/ch)). It is worth noting that this DC power includes a high level of gain and functionality (including down conversion, polarization discrimination, phase correction, and first level beamforming.)
Comparison of antenna solutions.

* Over full scan angle and antenna loss.
The NF as listed in this work is simulated over the full antenna scan angle to give realistic performance expectations. Unfortunately these numbers were not available in the references, but based on the monolithic microwave integrated circuit (MMIC) used in [Reference Sanadgol, Baggen, Arias Campo, Hulzinga and Verpoorte9, Reference Baggen, Vaccaro, Llorens del Río and Padilla10] a minimum NF of 2 dB is found.
A picture of the complete 8 × 8 tile is given in Fig. 15.
A complete tile with 64 antennas, sub-divided into four groups of 16 antennas.

XI. RFIC1 MEASUREMENTS RESULTS
The overall channel transfer of RFIC1 was measured with a vector network analyzer, see Fig. 16. Full frequency conversion was used, with an external LO applied at 9.75 GHz. The image-suppression was measured at 17–20 dB while the simulation predicted 20 dB. The C/N demand for the total system was 10 dB.
Measured overall channel response of RFIC1.

The IF-filter response is compared with the simulation and has good agreement. The response of Fig. 17 includes the test-board containing a balun at the IF-output, which could not be de-embedded. The other seven channels give comparable results. The data are summarized in Table 2
IF-transfer (linear scale) simulation (dash) and measurement (line).

Channel measurements of RFIC1.

The compression point at the input (IP1 dB) was found at −66 dBm, see Fig. 18.
Measured 1 dB compression point of channel X3.

The simulated value was −62 dBm at the input.
The GaAs LNA adds a gain of 10 dB, so at the antenna the compression point is ~−76 dBm.
This seems quite low, but no strong terrestrial interference is expected in an airplane at 30·000 feet. The compression point is caused by clipping of the last stage, so some crude beamforming has already been achieved, enough to handle some orbital interferers.
The OIP3 value is about −20 dBm for all channels (Fig. 19, Table 2).
Measured OIP3 of channel X2.

A channel-to-channel isolation test was done by driving channel Y3 (upper solid trace in Fig. 20) and then switch off its last two stages (TT-delays) to prevent this signal to reach the summation circuit. The channel Y4's output is measured, while its input is terminated with 50 Ω. Fig. 20 shows the relative isolation between the channels.
Measured relative channel to channel isolation.
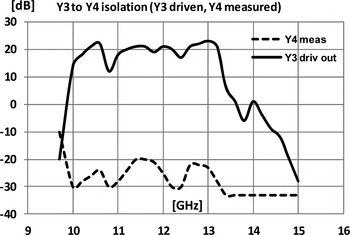
The lower (dashed) trace is the combined feed-through of the channel-layouts, test PCB, and the off-state of two TTD-cells. The difference is 40–50 dB. By switching off the LNA at the input of Y4 this value increased to 55–65 dB. Although not measured directly, the gain of the LNA was extracted to be 15 dB. Evidently most of the cross-talk between channels is caused at the inputs.
Another important parameter is the delay range of the programmable TT-delay cells. This was measured at 1 GHz IF-frequency, see Fig. 21.The total range was ~80 ps for three cascaded cells. The range could be extended from 72 to 80 ps by driving the TTD-multiplier into the next quadrant. Fig. 22 shows the group delay variation over frequency of the complete receiver channel in RFIC1, it is only 8 ps.
Measured maximum TT-delay range versus DAC value.

Measured group-delay variation over frequency.

The channel gain was predicted at 40 dB, some channels have a bit less gain due to spread, as shown in Table 2. The isolation of the last channel-cell when switched off (TTD cell) was measured and shown in the last column.
The NF of RFIC1 was simulated to be 3 dB. The measurement shows a value around 11 dB. The root cause of the deviation is not identified yet, a possible explanation lies in the electrostatic discharge (ESD) protection of the LNA input.
XII. CONCLUSIONS
A highly integrated antenna/receiver tile has been presented covering the full Ku-band instantaneously in both linear polarizations. It sets a record in integration density, made possible by two SiGe RFICs in CBGA packages on a multilayer PCB integrating the antenna.
The eight-channel receiver chip RFIC1 was created with all processing at IF-level, resulting in a power consumption of only 132 mW per channel. A low-IF concept was used to save power and simplify processing implementations. Differential-pairs with current-mode feedback are used and deliver a robust, high-speed, and interference-free design on a 3.8 × 4 mm2 die.
The radio channels have 40 dB of gain and >17 dB image rejection. OIP3 is around −20 dBm.
A continuous programmable TTD range of 80 ps is realized.
The design along with the chosen architecture and technology pave the way towards an affordable structurally integrated multi-beam phased array antenna on moving vehicles.
ACKNOWLEDGEMENT
The authors would like to thank J. W. Eikenbroek for his contribution to the system study, and NXP Nijmegen for the MPW run in QUBIC4Xi. The research described in this paper is funded by the Dutch Point One R&D Innovation Project: Broadband Satellite Communication Services on High-Speed vehicles, and the CATRENE project: ‘RF2THZ SISOC’.
 Paul Klatser was born in 1956 in Weesp, The Netherlands. He received his B.Eng degree from H.T.S of Enschede in 1980, and joined the Dutch air-force in 1981 as communications staff-engineer. In 1983 he started working for Philips I&E industries where he designed oscilloscope wide-band Asics. In 1995, at the Fluke company, he developed a galvanic separated wide-band channel for scope-meters. He joined BRUCO Integrated Circuits in 2000 where he was involved in a broad range of Asic design. Recently he is working in the field of RF-Asics.
 Marc van der Vossen was born in 1980 in Lisserbroek, The Netherlands. He received his B.Eng degree from HTS Haarlem in 2004. He then joined Thales Netherlands where he worked on, among others, X-band TR modules and Ka-band solid state transmitters. In 2010 he started at Bruco Integrated Circuits and is now working in analog IC design as well as RF application design.
 Gerard Voshaar received his M.Sc. degree in electrical engineering from the University of Twente, Enschede, The Netherlands in 1993.In 1995 he joined the Central research department of Akzo Nobel where he worked in the field of integrated optics. Since 2001 he is working at Bruco Integrated circuits located in Borne, The Netherlands. At Bruco he worked as project leader and design engineer on several IC design projects, in application area's like telecommunication, MEMs, and automotive.
 M.M. Boot received his Diploma in 2005 from the University of Twente. He became ASIC design engineer at Bruco Integrated Circuits. Currently he is active as lead engineer at Teledyne-Dalsa.
 Maikel Iven graduated in 1988 from the MTS Helmond on electronics. He has more than 25 years experience in the electronics industry, from development to manufacturing. Mainly he was manufacturing engineer in charge of developing manufacturing methods, associated CAD drawings and manuals. Now he is Manager CAD/CAM at Vermeulen PCB Service (V-PS).
 Adriaan Hulzinga was born in Wolvega, The Netherlands, in 1956. He received his B.Eng degree in electronics from the Hogeschool Windesheim, Zwolle, The Netherlands. Since 1996 he has been employed at the National Aerospace Laboratory (NLR) as a senior application engineer. He is involved in projects concerning antennas and electromagnetic compatibility.
 Chris Roeloffzen received his M.Sc. degree in physics from the University of Twente in 1998 and his Ph.D. degree in electrical engineering in 2002. In 2002 he became assistant professor in the Telecommunication Engineering Group, where he was involved with research and education on integrated microwave photonic systems. In 2009 he founded the company SATRAX, a spin-off of the University of Twente. SATRAX provides integrated optical beam forming modules for antenna systems to enable the growing need for bandwidth and capacity in telecommunication. These antenna systems meet bandwidth requirements for broadband terrestrial and satellite communications. He is now CTO within SATRAX.



