I. INTRODUCTION
Hydrogen bond, D–H···A (D = donor and A = acceptor), is one of the most important intermolecular interactions in supramolecular chemistry and crystal engineering (Desiraju, Reference Desiraju1989; Jeffrey and Saenger, Reference Jeffrey and Saenger1991). Supramolecular aggregation of molecules and/or ions is often facilitated by strong O/N–H···O/N hydrogen bonds having strength (15–50 Kcal mol−1) and directionality (<D–H···A ≥ 160°) when the extended structures are formed from the relatively small building blocks or synthons with aromatic moieties. In addition to these relatively strong hydrogen bonds, weak interactions C–H···X, such as C–H···O/N and C–H···Cl/Br wherein one or both of the participating atoms, C and X, are of moderate-to-low electronegativity can also influence significantly the molecular assembly in organic compounds (Guo et al., Reference Guo, Yu, Li, Xia, Tong and Wang2013). These interactions are individually weaker and geometrically less well defined; their combined effect, however, can be equally important as that of strong interactions (Desiraju and Steiner, Reference Desiraju and Steiner1999; Steiner, Reference Steiner2002). In recent years, the C–H···O/N interactions have been studied in great detail and it is reported that weak C–H···O/N hydrogen bonds can be utilized in the design of various supramolecular synthons (Arunan et al., Reference Arunan, Desiraju, Klein, Sadlej, Scheiner, Alkorta, Clary, Crabtree, Dannenberg, Hobza, Kjaergaard, Legon, Mennucci and Nesbitt2011; Desiraju, Reference Desiraju2011; Domagała et al., Reference Domagała, Grabowski, Urbaniak and Mloston2003; Moorthy et al., Reference Moorthy, Natarajan, Mal and Venugopalan2004). In this context, the nature of C–H···X (X = Cl, Br) interactions is, however, still debated (Desiraju, Reference Desiraju1995; Metrangolo et al., Reference Metrangolo, Pilati and Resnati2006). Based on a statistical analysis using the Cambridge Structural Database (CSD, version 5.14, October 1997 update) Aakeroy et al. (Reference Aakeroy, Evans, Seddon and Palinko1999) proposed an empirical distance/angle criteria for selecting C–H···Cl hydrogen bonds in aromatic compounds. A quantitative description about the nature and propensity of C–H···Cl interactions using the experimental charge density analysis has also been reported by our group (Hazra et al., Reference Hazra, Mukherjee, Helliwell and Mukherjee2012). Thus, we are interested in exploring different types of non-covalent interactions in various halogen-substituted phenyl derivatives, as a forerunner to explore new avenues in materials science.
Although single-crystal X-ray diffractometry is the method of choice for crystal structure determination of molecular compounds, an intrinsic limitation of this approach is the requirement for growing single crystals of an appropriate size and quality that make them amenable to structure analysis. The relative ease of obtaining microcrystalline powders for most of the materials provides a major advantage of structure elucidation from X-ray powder diffraction over single-crystal techniques. In principle, X-ray powder diffraction data contain the same information as that of single-crystal diffraction but with the three-dimensional (3D) diffraction data compressed into one dimension because the powder diffraction measurement is averaged over all possible crystal orientations. As a consequence, powder diffraction patterns contain substantial overlap of peaks making ab initio structure determination from X-ray powder diffraction, a far more difficult task than that of its single-crystal counterpart (Harris et al., Reference Harris, Tremayne and Kariuki2001; David et al., Reference David, Shankland, McCusker and Baerlocher2002). This is reflected in the CSD (version 5.34, 2012) (Allen, Reference Allen2002) search conducted among the organic compounds, which revealed that out of the total 227 898 entries only 840 (0.4%) structures have been solved using the X-ray powder diffraction method. With progress in the methodology for structure solution from X-ray powder diffraction (Harris and Cheung, Reference Harris and Cheung2004; David and Shankland, Reference David and Shankland2008), some successful structure analyses of molecular crystals from the laboratory X-ray powder diffraction data have been reported (Harris, Reference Harris2009; Fujii et al., Reference Fujii, Uekusa, Fukano and Koshima2011; Hazra et al., Reference Hazra, Mukherjee and Mukherjee2013).
This idea prompted us to undertake the synthesis and structure analysis of two halogen atom (Cl/Br)-substituted phenyl derivatives, N-(2-chlorophenyl) acetamide (1) and phenyl 2-(bromomethyl) benzoate (2) (Scheme 1) with an aim to study the acceptor potentiality of Cl/Br atoms in building the possible supramolecular framework. Since our attempt to grow suitable single crystal of (2) was not successful, the structure determination was accomplished from X-ray powder diffraction data. To assess the reliability of structure determination by the X-ray powder diffraction methodology, the crystal structure of (1) at 293(2) K was redetermined using X-ray powder data and compared with that reported earlier from the single-crystal X-ray analysis (Wan et al., Reference Wan, Ma, Li, Zhang, Cao, Zhang and Shi2006) (CSD codes: MEJPIB). The results of crystallographic analysis of (1) and (2) along with the density functional theory (DFT) calculations to study their electronic structures (supplementary material) are reported here. An investigation of close intermolecular interactions in (1), (2), MEJPIB and a few related halogen (Cl/Br)-substituted phenyl derivatives via Hirshfeld surface analysis are also presented.

II. EXPERIMENTAL METHODS
A. Materials and instrumentation
All chemicals were obtained from the commercial sources (Sigma–Aldrich). Solvents were dried using the standard methods, and chromatographic purifications were performed with silica gel (60–120 mesh). Elemental analysis was carried out using a Perkin–Elmer 240 C elemental analyzer. Fourier-transform infrared (FTIR) spectra in KBr pellet was measured on a Perkin–Elmer RX I FTIR spectrometer. Nuclear magnetic resonance (NMR) spectra were recorded on a Bruker DPX 300 NMR spectrometer at 22 °C.
B. Synthesis
N-(2-chlorophenyl) acetamide (1): A solution of 2-chloroaniline (7.2 g, 56 mmol) in water (300 ml) was heated to boiling, followed by drop wise addition of freshly distilled acetic anhydride (10–12 ml) with vigorous stirring for 2 h. The residue was filtered, washed with water (5 × 50 ml), and finally precipitated in a mixture of ether–light petroleum (40–60 °C) to afford white microcrystalline powder of N-(2-chlorophenyl) acetamide (1). Yield (52%). Elemental analysis calculated for C8H8NOCl: C 56.65, H 4.75, N 8.26 %; found C 56.75, H 4.90, N 8.15 %. Almost identical FTIR and NMR spectra of (1) and N-(2-chlorophenyl) acetamide (Wan et al., Reference Wan, Ma, Li, Zhang, Cao, Zhang and Shi2006) confirmed the identity of the product.
Phenyl 2-(bromomethyl) benzoate (2): A mixture of 2-methyl phenyl benzoate (3.18 g, 15 mmol), N-bromosuccinimide (2.67 g, 15 mmol) in dry CCl4 (60 ml) was irradiated with a 150 W tungsten lamp for 1 h. The reaction mixture was cooled to room temperature (24 °C) and filtered. The solvent was evaporated in vacuo and the residue was eluted through a silica gel column with ethyl acetate/petroleum ether (60–80 °C) (9:1) to produce a colorless solid, which on recrystallization from a mixture of diethyl ether/petroleum ether (60–80 °C) afforded microcrystalline powder of phenyl 2-(bromomethyl) benzoate (2). Yield: 67%. m.p. 78(1) °C. Elemental analysis calculated for C14H11O2Br: C 57.76, H 3.81%; found C 57.60, H 3.95%. 1H NMR (300 MHz, CDCl3, δ ppm) 8.28 (dd, 2H), 7.68 (t, 2H), 7.56 (t, 2H), 7.48 (d, 1H), 7.42 (dt, 1H), 7.27 (m, 1H), 4.49 (s, 2H). 13C NMR (75 MHz, CDCl3, δ ppm) 164.6, 149.3, 133.9, 131.0, 130.3, 130.0, 129.9, 129.2, 128.7, 126.4, 123.1, 27.6.
C. X-ray data collection and structure analysis
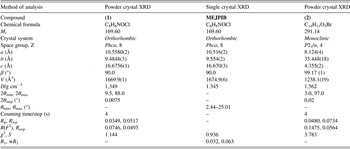
X-ray powder diffraction data of (1) and (2) were recorded at 293(2) K with a Bruker D8 Advance diffractometer using graphite monochromated CuKα1 radiation (λ = 1.54 056 Å) operating in the Bragg–Brentano geometry. The peak positions (2θ) were identified using a derivative-based algorithm as implemented in the peak search utility of the TOPAS 3.0 software package (Coelho, Reference Coelho2003). The indexing was carried out using the DICVOL04 program (Boultif and Louer, Reference Boultif and Louer1991). The best solution of indexing for (1) [M(20) = 48, F(20) = 73.(0.003 291, 80)] yielded an orthorhombic unit cell with a = 16.667(2) Å, b = 10.549(2) Å, c = 9.476(2) Å, and V = 1665.9 Å3, whereas for (2), indexing indicated a monoclinic unit cell with a = 8.158(2) Å, b = 35.634(4) Å, c = 4.374(3) Å, β = 99.14(2), and V = 1255.4 Å3 [M(20) = 32, F(20) = 47(0.005 914, 54)]. The full pattern decomposition was performed with EXPO2004 (Altomare et al., Reference Altomare, Caliandro, Camalli, Cuocci, Giacovazzo, Moliterni and Rizzi2004) following the Le Bail algorithm (Le Bail et al., Reference Le Bail, Duroy and Fourquet1988), and using a split-type pseudo-Voigt peak profile function (Toraya, Reference Toraya1986). Statistical analysis of powder patterns using the FINDSPACE module of EXPO2004 indicated Pbca and P21/n as the most probable space groups for (1) and (2), respectively, which were used for structure solution. The structures were solved by global optimization of structural models in direct-space based on a Monte Carlo search using the simulated annealing technique (in parallel tempering mode), as implemented in the program FOX (Favre-Nicolin and Cerny, Reference Favre-Nicolin and Cerny2002). The initial molecular geometry input in FOX was determined by the MOPAC 9.0 program (Stewart, Reference Stewart2007).
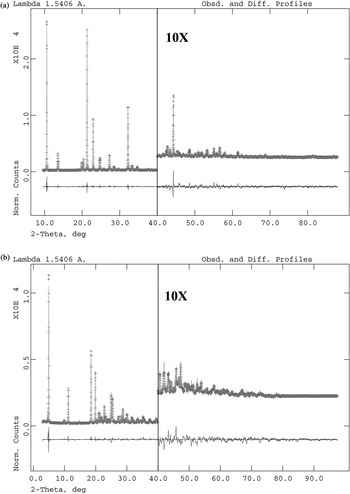
Solutions with a chemically reasonable packing arrangement and no significant misfit between the observed and calculated powder patterns were used as the starting models for the Rietveld refinement (Rietveld, Reference Rietveld1967), which was carried out using the program GSAS (Larson and Von Dreele, Reference Larson and Von Dreele2000) with an EXPGUI (Toby, Reference Toby2001) interface. The background was described by the shifted Chebyshev function of the first kind with 15 points regularly distributed over the entire 2θ range for both compounds. The lattice parameters, background coefficients, and profile parameters were refined initially followed by the refinement of positional coordinates of non-hydrogen atoms with soft constraints on bond lengths and bond angles, and a planar restraint for the phenyl rings. A fixed isotropic displacement parameter of 0.04 Å2 for all non-hydrogen atoms was maintained. Hydrogen atoms were placed in the calculated positions with a common U iso value of 0.07 Å2. In the final stages of refinement, a preferred orientation correction using the generalized spherical harmonic model was applied. Final Rietveld refinement with a good agreement between the observed and the calculated powder patterns (Figures 1(a) and 1(b)) converged to low residual parameters R p, R wp, and χ 2 (Table I).
Final Rietveld plot of (a) C8H8NOCl (1) (b) C14H11O2Br (2). Red crosses: observed pattern, green curve: calculated pattern, magenta curve: difference curve. The intensity in the high-angle region has been multiplied by a factor of 10.

Crystal data and structure refinement parameters for C8H8NOCl (1), MEJPIB and C14H11O2Br (2).

D. Hirshfeld surface analysis
The Hirshfeld surfaces (McKinnon et al., Reference McKinnon, Mitchell and Spackman1998) and the associated 2D-fingerprint plots (Spackman and McKinnon, Reference Spackman and McKinnon2002) were calculated using Crystal Explorer (Wolff et al., Reference Wolff, Grimwood, McKinnon, Jayatilaka and Spackman2007), which accepts a structure input file in the CIF format. Bond lengths to hydrogen atoms were set to typical neutron values (C–H = 1.083 Å and N–H = 1.009 Å). For each point on the Hirshfeld isosurface, two distances d e, the distance from the point to the nearest nucleus external to the surface, and d i, the distance to the nearest nucleus internal to the surface, are defined. The normalized contact distance (d norm) based on d e and d i is given by
 $$d_{^{{\rm norm}} }=\displaystyle{{\lpar d_{\rm i} - r_{\rm i}^{{\rm vdw}} \rpar } \over {r_{\rm i}^{{\rm vdw}} }}+\displaystyle{{\lpar d_{\rm e} - r_{\rm e}^{{\rm vdw}} \rpar } \over {r_{\rm e}^{{\rm vdw}} }}$$
where r i vdW and r e vdW being the van der Waals radii of the atoms. The value of d norm is negative or positive depending on the intermolecular contacts being shorter or longer than the van der Waals separations. The parameter d norm displays a surface with a red–white–blue color scheme, where the bright red spots highlight shorter contacts, the white areas represent contacts around the van der Waals separation, and the blue regions are devoid of close contacts.
III. RESULTS AND DISCUSSION
A. Crystal and molecular Structure
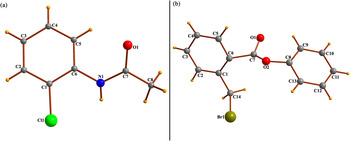
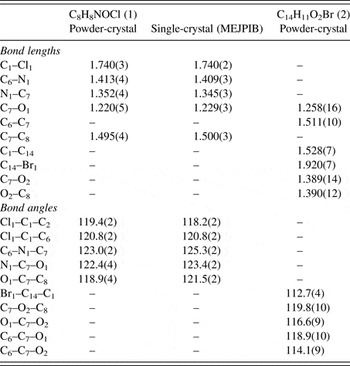
The molecular views of (1) and (2) with atom numbering scheme are shown in Figure 2. The molecule (1) adopts a fully extended acetamide side chain in a trans configuration with the torsion angle C6–N1–C7–C8 of −170.1(3)°. The C1–Cl1 bond length [1.740(3) Å] in (1) (Table II) agrees well with the mean value [1.732(6) Å] of 100 00 corresponding bond distances obtained with MOGUL (Bruno et al., Reference Bruno, Cole, Kessler, Luo, Motherwell, Purkis, Smith, Taylor, Cooper, Harris and Orpen2004) from the CSD search on the related molecular fragment. The extended conformation of molecule (2) consisting of two phenyl rings bridged via a methylacetate group is established by C6–C7–O2–C8 torsion angle of 167.3(8)°; the dihedral angle between the planar benzene rings is 72.4(3)°. Although C14–Br1 bond length [1.920(7) Å] in (2) (Table II) is a little shorter than the average H2C–Br bond distance [1.967(3) Å] calculated using 317 related organic structures (excluding disorder structures), it lies well within the range of 1.883(5)–2.036(13) Å found in the CSD.
(Color online) Molecular views of (a) C8H8NOCl (1), (b) C14H11O2Br (2) with atom numbering scheme.

Selected bond lengths (Å) and angles (°) for C8H8NOCl (1) and C14H11O2Br (2).

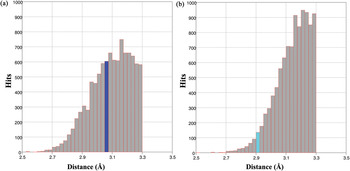
The hydrogen-bonding interactions in (1) having an NH proton donating bond in addition to few CH groups are significantly different from that of (2) with only CH donor functionalities. The histograms (Figure 3) of C–H···X–C (X = Cl/Br) in the range 2.0 < H···X (d/Å) < 3.3 and 110 < C–H···X (θ/°) <180 based on 15 225 hits for chloro- and 8446 hits for bromo- compounds in the CSD (version 5.34, November 2012) indicate that the observed H···Cl distances (Figure 3(a)) lies in the bin frequently encountered in organic structures. The frequency distribution of H···Br distances (Figure 3(b)) shows an onset at about 2.7 Å with a steady increase in the number of contacts to ca. 3.15 Å where the curve levels off, and the observed H···Br distance in (2) is located on the positive slope of the histogram. Considering the distance/angle criteria commonly used for identifying hydrogen bonds [Aakeroy et al., Reference Aakeroy, Evans, Seddon and Palinko1999; Desiraju and Steiner, Reference Desiraju and Steiner1999; Metrangolo et al., Reference Metrangolo, Pilati and Resnati2006; Shimpi et al., Reference Shimpi, SeethaLekshmi and Pedireddi2007; Zhang et al., Reference Zhang, Tang, Ma, Sun and Janiak2008), the C–H···X (X = Cl/Br) interactions in (1) and (2) can be classified as weak hydrogen bond.
(Color online) Histogram of (a) C–H···Cl–C, (b) C–H···Br–C distances in organic compounds in the CSD.

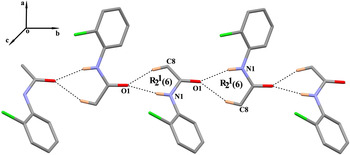
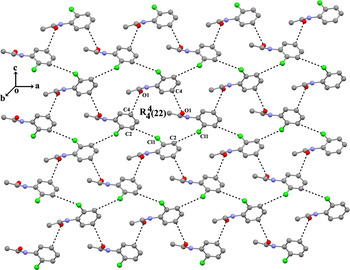
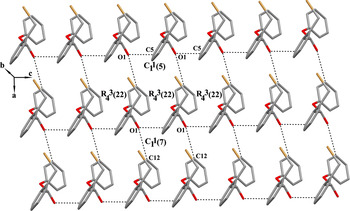
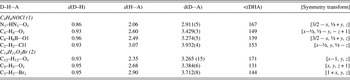
In addition to van der Waal's interactions, the crystal packing in (1) exhibits an interplay of intermolecular N–H···O, C–H···O, and C–H···Cl hydrogen bonds (Table III). The carbonyl O1 atom in (1) acts as a triple acceptor in which N1 and C8 atoms in the molecule at (x, y, z) donate protons to O1 atom in the molecule at (3/2 − x, ½ + y, z), thus forming an R 2 1(6) graph-set motif (Bernstein et al., Reference Bernstein, Davis, Shimoni and Chang1995). The propagation of R 2 1(6) rings generates C 1 1(4) chains running along the [010] direction (Figure 4). Intermolecular C4–H4···O1 (x − ½, ½ − y, − z + 1) and C2–H2···Cl1 (x–½, y, ½ − z) hydrogen bonds link the molecules of (1) into a two-dimensional (2D) herringbone network (Figure 5) built with fused R 4 4(22) rings in the (101) plane. Finally the combination of [010] chain and 2D molecular sheet generates a 3D supramolecular architecture in (1). The molecular chains in (2) are, however, formed by intermolecular C–H···O hydrogen bonds (Table III). The C12 and C5 atoms of two different phenyl rings in the molecule at (x, y, z) are hydrogen bonded to carbonyl O1 atoms of molecule at (x − 1, y, z) and (x, y, z + 1), respectively, thus generating two C1 1(7) and C1 1(5) chains along the [100] and [001] directions. The combination of polymeric chains forms a 2D molecular framework in (2) built with fused R 4 3(22) rings in the (101) plane (Figure 6). The linking of molecules via intermolecular C3–H3–Br1 hydrogen bond generates a 3D columnar stacking in (2) (Figure S1 of supplementary material).
(Color online) A view of R 2 1(6) synthon running along the [010] direction in C8H8NOCl (1). H atoms not participating in the synthon formation have been omitted for clarity.

(Color online) Two-dimensional herringbone network in C8H8NOCl (1). H atoms have been omitted for clarity.

(Color online) A view of 2D molecular framework in C14H11O2Br (2). H atoms have been omitted for clarity.

Intermolecular interactions for C8H8NOCl (1) and C14H11O2Br (2) (Å, °).

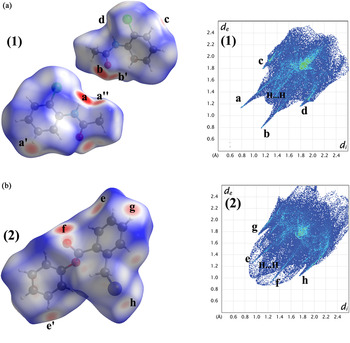
The Hirshfeld surfaces (Spackman and Jayatilaka, Reference Spackman and Jayatilaka2009) provide a relatively new tool for analyzing the packing modes as well as intermolecular interactions in molecular crystals while maintaining a whole-of-molecule approach. They are constructed by partitioning the space in a crystal into regions where the electron density from the sum of spherical atoms of the molecule is greater than the corresponding sum over the crystal (McKinnon et al., Reference McKinnon, Spackman and Mitchell2004). Two-dimensional fingerprint plots (Spackman and McKinnon, Reference Spackman and McKinnon2002) complement the Hirshfeld surfaces, quantitatively summarizing the nature and type of intermolecular interactions experienced by the molecules in a crystal. This analysis can be very valuable in the identification and quantitative comparison of similarities and subtle differences among the intermolecular interactions in polymorphs and related compounds (McKinnon et al., Reference McKinnon, Fabbiani and Spackman2007; Braun et al., Reference Braun, Gelbrich, Kahlenberg, Laus, Wieser and Griesser2008). The Hirshfeld surfaces of compounds (1) and (2) are illustrated in Figures 7(a) and 7(b), showing surfaces that have been mapped over a d norm range of −0.5 to 1.0 Å. The color codes from red for short d norm ranges to blue for long d norm ranges were employed. The dominant interaction between the acetamide NH group and carbonyl O atom in (1) can be seen in the Hirshfeld surface as bright red spots marked as “a” and “b” in Figure 7(a). The light red areas labeled as “a′”, “a″”, “b′” in Figure 7(a), and “e”, “e′”, “f” in Figure 7(b) are due to C–H···O interactions in (1) and (2). Other red patches such as “c”, “d” in Figure 7(a) and “g”, “h” in Figure 7(b) correspond to H···Cl and H···Br interactions in compounds (1) and (2). The corresponding 2D fingerprint plot of (1) (Figure 7(a)) exhibits characteristic spikes in the region 2.2 < d e + d i < 3.1 Å (labeled as “a” and “b”) resulting from N–H···O and C–H···O interactions. The upper spike “a” in Figure 7(a) represents the donor spike (acetamide NH group and methyl/phenyl H atom interacting with the carbonyl O atom), and the lower spike “b” being the acceptor spike (carbonyl O atom interacting with the acetamide NH group and methyl/phenyl H atom). The wings (Figure 7(a), marked as “c” and “d”) in the (d i, d e) regions of (1.8 Å, 1.1 Å), and (1.1 Å, 1.8 Å) are attributable to C–H···Cl interaction in (1). In compound (2), the spikes in the region 2.1 < d e + d i < 3.3 Å (labeled as “e” and “f”) are due to C–H···O hydrogen bonds. The wings (Figure 7(b), marked as “g” and “h”) in the (d i, d e) regions of (1.8 Å, 1.1 Å) and (1.1 Å, 1.8 Å) correspond to C–H···Br interaction in (2). The central spike extending up to (d i, d e) region of (1.2 Å, 1.2 Å) in (1) and (1.0 Å, 1.0 Å) in (2) reflects a relatively high percentage of H···H contacts in both structures (Figures 7(a) and 7(b)).
(Color online) Hirshfeld surface and 2D fingerprint plot of (a) C8H8NOCl (1) (b) C14H11O2Br (2).

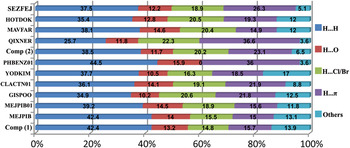
The relative contributions of different interactions to the Hirshfeld surface calculated for (1), (2), MEJPIB as well as a few related chlorophenyl and bromophenyl derivatives (Shibakami and Sekiya, Reference Shibakami and Sekiya1995; Ronaldson et al., Reference Ronaldson, Storey and Harrison2005; Xu et al., Reference Xu, Zang, Wu, Su and Qiu2007; Gowda et al., Reference Gowda, Foro, Terao and Fuess2009) retrieved from the CSD are shown in Figure 8. It should be noted that the contribution of H···Cl contacts (14.8%) to the Hirshfeld surface area in (1) is comparable to that of H···O contacts (13.2%), which include both N–H···O and C–H···O interactions. The corresponding contribution of H···Br contacts (20.2%) to the Hirshfeld surface area in (2) is, however, almost double to that of H···O contacts (11.7%). Among the different chlorophenylacetamides, (1), MEJPIB, MEJPIB01, GISPOO, and CLACTN01, which differ only in respect to the position of chlorophenyl group, the contribution of H···O contacts to the Hirshfeld surface area is lowest (10.2%) in GISPOO containing a chlorine atom at the three-position of the phenyl ring, whereas that of H···Cl contacts in GISPOO is maximum (20.6%). It is evident from Figure 8 that H···H contacts are the major contributor (~40%) to the Hirshfeld surface area in chlorophenylacetamides and bromophenylbenzoates; the remaining 60% contribution was mostly because of H···π, H···O, and H···X (X = Cl/Br) interactions, which can account for 83–97% of the Hirshfeld surface area.
(Color online) The relative contributions of different intermolecular contacts to the Hirshfeld surface area in C8H8NOCl (1), C14H11O2Br (2) and a few related compounds retrieved from the CSD.

IV. CONCLUSION
The structure analysis of N-(2-chlorophenyl) acetamide (1) and phenyl-(2-bromomethyl) benzoate (2) clearly demonstrates the potential of X-ray powder diffraction methodology in solving crystal structures of molecular compounds. A comparison of close intermolecular interactions in (1), (2) and a few related chloroacetamide and bromophenylbenzoates using the Hirshfeld surface analysis revealed that H···.H, H….π, H···.O, and H···.Cl/Br contacts can account for 83–97% of the Hirshfeld surface area in this class of compounds. The present study allows us to understand how a delicate interplay of weak hydrogen bonds involving halogen atom (Cl/Br) as acceptor leads to supramolecular framework in halogen substituted phenyl derivatives.
ACKNOWLEDGEMENT
Financial support from the University Grants Commission, New Delhi, through the DRS (SAP-II) program for purchasing the X-ray powder diffractometer in the Department of Physics, Jadavpur University, is gratefully acknowledged.
Appendix A. Supplementary material
CIF files pertaining to the compounds described have been deposited with ICDD®. For information please contact info@icdd.com.
Crystallographic data for the structures C8H8NOCl (1) and (b) C14H11O2Br (2) reported in this article have been deposited with the Cambridge Crystallographic Data Centre as supplementary publication numbers CCDC 937399 and 937400, respectively. Copies of the data can be obtained free of charge on application to CCDC, 12 Union Road, Cambridge CB2 1EZ, UK (fax: +44 1223 336033; email: (deposit@ccdc.cam.ac.uk).
The supplementary material for this article can be found at http://www.journals.cambridge.org/PDJ