1 Introduction
Wavelet-based numerical methodologies have long been developed and successfully used in computational fluid dynamics (Schneider & Vasilyev Reference Schneider and Vasilyev2010), demonstrating the convenience of spatio-temporal mesh adaptation for numerical simulations of turbulent flows. These methods take advantage of the multiscale character, the self-organization into coherent structures and the spatio-temporal intermittency that are fundamental properties of turbulence (De Stefano, Goldstein & Vasilyev Reference De Stefano, Goldstein and Vasilyev2005). Based on the ability of wavelet multi-resolution analysis to identify and track dynamically dominant flow structures, a hierarchical framework for simulating turbulent flows has been constructed, which can be referred to as an eddy-capturing approach, e.g. De Stefano & Vasilyev Reference De Stefano and Vasilyev2012. Wavelet-based direct numerical simulation, coherent vortex simulation (Farge, Schneider & Kevlahan Reference Farge, Schneider and Kevlahan1999) and wavelet-based adaptive large-eddy simulation (Goldstein & Vasilyev Reference Goldstein and Vasilyev2004) represent the different fidelity methods in this hierarchy, where numerics and physics-based modelling are tightly integrated.
For turbulent external flows, the wavelet-based eddy-capturing approach has been successfully used in conjunction with the volume-penalization method (Angot, Bruneau & Fabrie Reference Angot, Bruneau and Fabrie1999; Vasilyev & Kevlahan Reference Vasilyev and Kevlahan2002). The hybrid computational modelling combines the adaptive wavelet-collocation (AWC) procedure with the Brinkman penalization technique, with the former guaranteeing the efficient resolution of the flow on a dynamically adaptive computational grid and the latter being responsible for imposing the flow geometry, e.g. Brown-Dymkoski, Kasimov & Vasilyev (Reference Brown-Dymkoski, Kasimov and Vasilyev2014). However, the use of a penalization approach has some major drawbacks. Particularly, the existence of a thin boundary layer inside the obstacle region, which has to be accurately resolved, represents a strong constraint on realizability. The fact that the non-dimensional thickness of this layer decreases with increasing Reynolds number, combined with the isotropic refinement strategy required by wavelet-based adaptation, results in substantially augmenting the computational cost of the simulation.
The recent development of the adaptive-anisotropic wavelet-collocation method (A-AWCM) (Brown-Dymkoski & Vasilyev Reference Brown-Dymkoski and Vasilyev2017), which incorporates the use of coordinate transforms for the solution of partial differential equations, opens new horizons for wavelet-based numerical simulation of wall-bounded turbulent flows. First, the constraint of using rectangular domains is totally removed and body-fitted curvilinear meshes can be suitably constructed, thus avoiding the reliance on penalization techniques. Furthermore, by addressing the major shortcoming of existing methods based on isotropic mesh refinement, namely, the dramatic overresolution of sheet- and filament-like structures in the flow field, the newly developed approach allows for a more efficient use of the available computational resources. It is important to note that the A-AWCM retains both the essential features of the traditional wavelet-based adaptation procedure, that is, error control of the numerical solution and fully automated mesh refinement.
In this study, a new wavelet-based adaptive unsteady Reynolds-averaged Navier–Stokes (URANS) modelling approach for the simulation of wall-bounded turbulent flows is proposed. The present computational modelling based on the integration of compressible URANS equations and A-AWCM is referred to as W-URANS. The approach is general and can be used in combination with the majority of existing URANS models. Here, the W-URANS framework is demonstrated using a two-equation eddy-viscosity turbulence model, namely, the
 $k$
–
 $\unicode[STIX]{x1D714}$
model of Wilcox (Reference Wilcox1988), which relies on transport equations for the turbulence kinetic energy and the specific dissipation rate to close the governing equations. This model has the significant advantage that it does not require the use of damping functions in the viscous sublayer and Dirichlet boundary conditions can be imposed for the turbulence variables at the fluid–body interface. The adoption of the anisotropic refinement strategy proposed in this work allows for the exploitation of adaptive numerical meshes with mesh elements that are properly stretched in both the wall and the wake regions. This way, a much better scaling with the flow Reynolds number is achieved, as necessitated by the need to resolve high gradients in these flow regions. In fact, the resolution requirement of wall-resolved URANS simulations for external flows, where the small eddies need to be resolved, is satisfied by using numerical meshes that are much finer than those required to resolve mean flow in steady RANS. The use of a wavelet-based spatio-temporally adaptive computational model makes it possible to construct an efficient URANS method by taking full advantage of the characteristic turbulent flow intermittency.
In order to present and demonstrate the new wavelet-based adaptive URANS modelling approach, some numerical experiments are conducted for the turbulent flow over a circular cylinder. Despite the very simple geometry, the latter represents a physically complex model for turbulent external flows. Depending on the flow Reynolds number, very different flow regimes occur, which makes URANS simulations of this flow a challenging task. A comprehensive review of the vortex dynamics in the circular cylinder wake can be found in Williamson (Reference Williamson1996). In this work, the subcritical flow regime, where the boundary layer exhibits laminar separation and the transition to turbulence occurs in the shear layers developing on the cylinder side, is considered. Specifically, the numerical simulation of vortex shedding flow past a circular cylinder at
 $Re=3900$
is conducted, because this configuration is very well documented in the scientific literature, both experimentally and numerically.
The remainder of this paper is organized as follows. In § 2, the two-equation eddy-viscosity modelling approach for compressible turbulence is described, with a particular focus on external flows. The new wavelet-based adaptive URANS method with anisotropic mesh refinement for wall-bounded turbulence is introduced in § 3. The settings of the wavelet-based simulation of circular cylinder flow are given in § 4, while the results of the numerical experiments are presented and critically discussed in § 5. Finally, some concluding remarks are made in § 6.
2 Wavelet-based URANS modelling
In this study, as is common practice for simulating compressible turbulent flows, the governing equations are written in terms of Favre mass-averaged quantities. For a generic flow quantity
 $f$
, noted with a bar for the Reynolds-averaging (mean) operation, the associated Favre-averaged variable is defined as
 $\tilde{f}=\overline{\unicode[STIX]{x1D70C}f}/\bar{\unicode[STIX]{x1D70C}}$
, where
 $\bar{\unicode[STIX]{x1D70C}}$
is the mean mass density. For instance,
 $\tilde{u} _{i}=\overline{\unicode[STIX]{x1D70C}u_{i}}/\bar{\unicode[STIX]{x1D70C}}$
stands for the Favre-averaged velocity vector.
2.1 Mean flow governing equations
The general W-URANS equations governing the evolution of the resolved mean flow quantities are represented by the following Favre-averaged mass, momentum and energy equations (Wilcox Reference Wilcox2008):
 $$\begin{eqnarray}\displaystyle & \displaystyle \frac{\unicode[STIX]{x2202}\bar{\unicode[STIX]{x1D70C}}}{\unicode[STIX]{x2202}t}+\frac{\unicode[STIX]{x2202}}{\unicode[STIX]{x2202}x_{i}}(\bar{\unicode[STIX]{x1D70C}}\tilde{u} _{i})=0, & \displaystyle\end{eqnarray}$$
 $$\begin{eqnarray}\displaystyle & \displaystyle \frac{\unicode[STIX]{x2202}}{\unicode[STIX]{x2202}t}(\bar{\unicode[STIX]{x1D70C}}\tilde{u} _{i})+\frac{\unicode[STIX]{x2202}}{\unicode[STIX]{x2202}x_{j}}(\bar{\unicode[STIX]{x1D70C}}\tilde{u} _{i}\tilde{u} _{j})=-\frac{\unicode[STIX]{x2202}\bar{p}}{\unicode[STIX]{x2202}x_{i}}+\frac{\unicode[STIX]{x2202}}{\unicode[STIX]{x2202}x_{j}}(\bar{t}_{ij}+\bar{\unicode[STIX]{x1D70C}}\unicode[STIX]{x1D70F}_{ij}), & \displaystyle\end{eqnarray}$$
 $$\begin{eqnarray}\displaystyle & & \displaystyle \frac{\unicode[STIX]{x2202}}{\unicode[STIX]{x2202}t}\left[\bar{\unicode[STIX]{x1D70C}}\left(\tilde{e}+\frac{\tilde{u} _{i}\tilde{u} _{i}}{2}+k\right)\right]+\frac{\unicode[STIX]{x2202}}{\unicode[STIX]{x2202}x_{j}}\left[\bar{\unicode[STIX]{x1D70C}}\tilde{u} _{j}\left(\tilde{h}+\frac{\tilde{u} _{i}\tilde{u} _{i}}{2}+k\right)\right]\nonumber\\ \displaystyle & & \displaystyle \quad =\frac{\unicode[STIX]{x2202}}{\unicode[STIX]{x2202}x_{j}}\left[\tilde{u} _{i}(\bar{t}_{ij}+\bar{\unicode[STIX]{x1D70C}}\unicode[STIX]{x1D70F}_{ij})-q_{j}+(\unicode[STIX]{x1D707}+\unicode[STIX]{x1D70E}^{\ast }\unicode[STIX]{x1D707}_{t})\frac{\unicode[STIX]{x2202}k}{\unicode[STIX]{x2202}x_{j}}\right],\end{eqnarray}$$
where mean viscous stresses are represented by
 $\bar{t}_{ij}=2\unicode[STIX]{x1D707}(\tilde{\unicode[STIX]{x1D61A}}_{ij}-(1/3)\tilde{\unicode[STIX]{x1D61A}}_{kk}\unicode[STIX]{x1D6FF}_{ij})$
, with
 $\tilde{\unicode[STIX]{x1D61A}}_{ij}=(1/2)((\unicode[STIX]{x2202}\tilde{u} _{i}/\unicode[STIX]{x2202}x_{j})+(\unicode[STIX]{x2202}\tilde{u} _{j}/\unicode[STIX]{x2202}x_{i}))$
being the resolved strain-rate tensor. The unknown Reynolds stresses
 $\bar{\unicode[STIX]{x1D70C}}\unicode[STIX]{x1D70F}_{ij}=\bar{\unicode[STIX]{x1D70C}}(\widetilde{u_{i}u_{j}}-\tilde{u} _{i}\tilde{u} _{j})$
need to be modelled to close the equations. In this work, the W-URANS framework is illustrated using the Boussinesq eddy-viscosity assumption
 $$\begin{eqnarray}\bar{\unicode[STIX]{x1D70C}}\unicode[STIX]{x1D70F}_{ij}=2\unicode[STIX]{x1D707}_{t}\left(\tilde{\unicode[STIX]{x1D61A}}_{ij}-{\textstyle \frac{1}{3}}\tilde{\unicode[STIX]{x1D61A}}_{kk}\unicode[STIX]{x1D6FF}_{ij}\right)-{\textstyle \frac{2}{3}}\bar{\unicode[STIX]{x1D70C}}k\unicode[STIX]{x1D6FF}_{ij},\end{eqnarray}$$
where
 $\unicode[STIX]{x1D707}_{t}$
stands for the turbulent eddy viscosity and
 $k=-\unicode[STIX]{x1D70F}_{ii}/2$
represents the kinetic energy (per unit mass) associated with the turbulent fluctuations, which is the primary turbulence variable to be modelled. Note that in this work the turbulence kinetic energy
 $k$
is included in the definition of the total energy, namely,
 $\tilde{E}=\tilde{e}+\tilde{u} _{i}\tilde{u} _{i}/2+k$
, where
 $\tilde{e}$
stands for the specific internal energy of the fluid. The term
 $q_{j}=-((\unicode[STIX]{x1D707}/Pr)+(\unicode[STIX]{x1D707}_{t}/Pr_{t}))(\unicode[STIX]{x2202}\tilde{h}/\unicode[STIX]{x2202}x_{j})$
represents the heat flux vector, with
 $\tilde{h}=\tilde{e}+\bar{p}/\bar{\unicode[STIX]{x1D70C}}$
the specific enthalpy of the fluid. It is worth noting that both molecular and turbulent diffusion of
 $k$
are properly considered in the energy equation (2.3). In this study, the following thermodynamic relationships for a calorically perfect gas are assumed:
 $$\begin{eqnarray}\displaystyle & \bar{p}=\bar{\unicode[STIX]{x1D70C}}R\tilde{T}, & \displaystyle\end{eqnarray}$$
 $$\begin{eqnarray}\displaystyle & \displaystyle \tilde{e}=c_{v}\tilde{T}=\frac{1}{\unicode[STIX]{x1D6FE}-1}\frac{\bar{p}}{\bar{\unicode[STIX]{x1D70C}}}, & \displaystyle\end{eqnarray}$$
 $$\begin{eqnarray}\displaystyle & \displaystyle \tilde{h}=c_{p}\tilde{T}=\frac{\unicode[STIX]{x1D6FE}}{\unicode[STIX]{x1D6FE}-1}\frac{\bar{p}}{\bar{\unicode[STIX]{x1D70C}}}, & \displaystyle\end{eqnarray}$$
where
 $R$
is the gas constant, while
 $c_{v}$
and
 $c_{p}$
are the specific heats at constant volume and pressure, respectively. As to the specific heat ratio
 $\unicode[STIX]{x1D6FE}=c_{p}/c_{v}$
, the value of 1.4 for diatomic gases is prescribed. Also, the Sutherland’s law is used to compute the dynamic viscosity
 $\unicode[STIX]{x1D707}$
as a function of the absolute temperature
 $\tilde{T}$
. Finally, for the numerical experiments presented in the following, the molecular and the turbulent Prandtl numbers appearing in the heat flux definition are assumed as
 $Pr=0.72$
and
 $Pr_{t}=0.9$
, respectively.
2.2
 $k$
–
$\unicode[STIX]{x1D714}$
model equations


Following a two-equation modelling approach, the unknown turbulent eddy viscosity
 $\unicode[STIX]{x1D707}_{t}$
can be modelled as a function of the turbulence kinetic energy
 $k$
and the specific dissipation rate
 $\unicode[STIX]{x1D714}$
(also referred to as the turbulence frequency) as follows:
 $$\begin{eqnarray}\unicode[STIX]{x1D707}_{t}=\frac{\bar{\unicode[STIX]{x1D70C}}k}{\unicode[STIX]{x1D714}}.\end{eqnarray}$$
Since its inception, due to Kolmogorov (Reference Kolmogorov1942) and Saffman (Reference Saffman1970), independently, the
 $k$
–
 $\unicode[STIX]{x1D714}$
model has been constantly revised and improved, becoming one of the most commonly used RANS modelling procedures for separated flows. In this work, the
 $k$
–
 $\unicode[STIX]{x1D714}$
model version proposed by Wilcox (Reference Wilcox1988) is employed. The modelled evolution equations for the turbulence kinetic energy and the specific turbulence dissipation rate can be written as
 $$\begin{eqnarray}\frac{\unicode[STIX]{x2202}}{\unicode[STIX]{x2202}t}(\bar{\unicode[STIX]{x1D70C}}k)+\frac{\unicode[STIX]{x2202}}{\unicode[STIX]{x2202}x_{j}}(\bar{\unicode[STIX]{x1D70C}}k\tilde{u} _{j})=\unicode[STIX]{x1D6F1}-\unicode[STIX]{x1D6FD}^{\ast }\bar{\unicode[STIX]{x1D70C}}k\unicode[STIX]{x1D714}+\frac{\unicode[STIX]{x2202}}{\unicode[STIX]{x2202}x_{j}}\left[(\unicode[STIX]{x1D707}+\unicode[STIX]{x1D70E}^{\ast }\unicode[STIX]{x1D707}_{t})\frac{\unicode[STIX]{x2202}k}{\unicode[STIX]{x2202}x_{j}}\right]\end{eqnarray}$$
and
 $$\begin{eqnarray}\frac{\unicode[STIX]{x2202}}{\unicode[STIX]{x2202}t}(\bar{\unicode[STIX]{x1D70C}}\unicode[STIX]{x1D714})+\frac{\unicode[STIX]{x2202}}{\unicode[STIX]{x2202}x_{j}}(\bar{\unicode[STIX]{x1D70C}}\unicode[STIX]{x1D714}\tilde{u} _{j})=\unicode[STIX]{x1D6FC}\frac{\unicode[STIX]{x1D714}}{k}\unicode[STIX]{x1D6F1}-\unicode[STIX]{x1D6FD}\bar{\unicode[STIX]{x1D70C}}\unicode[STIX]{x1D714}^{2}+\frac{\unicode[STIX]{x2202}}{\unicode[STIX]{x2202}x_{j}}\left[(\unicode[STIX]{x1D707}+\unicode[STIX]{x1D70E}\unicode[STIX]{x1D707}_{t})\frac{\unicode[STIX]{x2202}\unicode[STIX]{x1D714}}{\unicode[STIX]{x2202}x_{j}}\right],\end{eqnarray}$$
respectively. The term
 $\unicode[STIX]{x1D6F1}=\bar{\unicode[STIX]{x1D70C}}\unicode[STIX]{x1D70F}_{ij}(\unicode[STIX]{x2202}\tilde{u} _{i}/\unicode[STIX]{x2202}x_{j})$
represents the production of turbulence kinetic energy, that is, the rate at which kinetic energy is transferred from resolved mean flow to unresolved turbulence. Due to the eddy-viscosity model (2.4), the turbulence production is approximated as
 $\unicode[STIX]{x1D6F1}\cong \unicode[STIX]{x1D707}_{t}\tilde{S}^{2}$
, where
 $\tilde{S}$
stands for the resolved strain-rate magnitude, that is,
 $\tilde{S}=(2\tilde{\unicode[STIX]{x1D61A}}_{ij}\tilde{\unicode[STIX]{x1D61A}}_{ij})^{1/2}$
.
The present turbulence model has a major shortcoming as the simulation results strongly depend on the free-stream value of the turbulence frequency that is specified outside the shear layer, e.g. Wilcox (Reference Wilcox2008). In order to reduce the sensitivity of the model to free-stream boundary conditions, a number of different variants of the original formulation have been proposed. Here, following a well established procedure, the so-called cross-diffusion term is added to the right-hand side of (2.10), specifically,
 ${\mathcal{C}}=\unicode[STIX]{x1D70E}_{d}(\bar{\unicode[STIX]{x1D70C}}/\unicode[STIX]{x1D714})(\unicode[STIX]{x2202}k/\unicode[STIX]{x2202}x_{j})(\unicode[STIX]{x2202}\unicode[STIX]{x1D714}/\unicode[STIX]{x2202}x_{j})$
, where
 $\unicode[STIX]{x1D70E}_{d}$
is a coefficient of order unity (Wilcox Reference Wilcox1993). Because this additional term must be suppressed close to solid boundaries as it undermines the viscous sublayer prediction, practically, it is included only where it is positive, which leads to the following practical definition:
 $$\begin{eqnarray}{\mathcal{C}}=\unicode[STIX]{x1D70E}_{d_{0}}\frac{\bar{\unicode[STIX]{x1D70C}}}{\unicode[STIX]{x1D714}}\max \left(0,\frac{\unicode[STIX]{x2202}k}{\unicode[STIX]{x2202}x_{j}}\frac{\unicode[STIX]{x2202}\unicode[STIX]{x1D714}}{\unicode[STIX]{x2202}x_{j}}\right).\end{eqnarray}$$
This way, cross-diffusion does not affect the solution close to the wall, where
 $k$
and
 $\unicode[STIX]{x1D714}$
have gradients of opposite sign, since the turbulence kinetic energy vanishes while the turbulence frequency theoretically tends to infinity. The coefficient
 $\unicode[STIX]{x1D70E}_{d_{0}}$
has to be prescribed along with the turbulent diffusion coefficients
 $\unicode[STIX]{x1D70E}^{\ast }$
and
 $\unicode[STIX]{x1D70E}$
(Kok Reference Kok2000).
Furthermore, for external aerodynamic flows, the model equations (2.9) and (2.10) would actually lead to a non-physical decay of turbulence in the free-stream flow region (Spalart & Rumsey Reference Spalart and Rumsey2007). Therefore, in order to sustain the turbulence level away from the body, additional source terms on the right-hand side of the above equations are suitably considered. By also including the cross-diffusion term (2.11), the coupled evolution equations for
 $k$
and
 $\unicode[STIX]{x1D714}$
being actually solved are
 $$\begin{eqnarray}\frac{\unicode[STIX]{x2202}}{\unicode[STIX]{x2202}t}(\bar{\unicode[STIX]{x1D70C}}k)+\frac{\unicode[STIX]{x2202}}{\unicode[STIX]{x2202}x_{j}}(\bar{\unicode[STIX]{x1D70C}}k\tilde{u} _{j})=\unicode[STIX]{x1D6F1}-\unicode[STIX]{x1D6FD}^{\ast }\bar{\unicode[STIX]{x1D70C}}k\unicode[STIX]{x1D714}+\frac{\unicode[STIX]{x2202}}{\unicode[STIX]{x2202}x_{j}}\left[(\unicode[STIX]{x1D707}+\unicode[STIX]{x1D70E}^{\ast }\unicode[STIX]{x1D707}_{t})\frac{\unicode[STIX]{x2202}k}{\unicode[STIX]{x2202}x_{j}}\right]+\unicode[STIX]{x1D6FD}^{\ast }\bar{\unicode[STIX]{x1D70C}}k_{o}\unicode[STIX]{x1D714}_{o}\end{eqnarray}$$
and
 $$\begin{eqnarray}\frac{\unicode[STIX]{x2202}}{\unicode[STIX]{x2202}t}(\bar{\unicode[STIX]{x1D70C}}\unicode[STIX]{x1D714})+\frac{\unicode[STIX]{x2202}}{\unicode[STIX]{x2202}x_{j}}(\bar{\unicode[STIX]{x1D70C}}\unicode[STIX]{x1D714}\tilde{u} _{j})=\unicode[STIX]{x1D6FC}\frac{\unicode[STIX]{x1D714}}{k}\unicode[STIX]{x1D6F1}-\unicode[STIX]{x1D6FD}\bar{\unicode[STIX]{x1D70C}}\unicode[STIX]{x1D714}^{2}+\frac{\unicode[STIX]{x2202}}{\unicode[STIX]{x2202}x_{j}}\left[(\unicode[STIX]{x1D707}+\unicode[STIX]{x1D70E}\unicode[STIX]{x1D707}_{t})\frac{\unicode[STIX]{x2202}\unicode[STIX]{x1D714}}{\unicode[STIX]{x2202}x_{j}}\right]+\unicode[STIX]{x1D6FD}\bar{\unicode[STIX]{x1D70C}}\unicode[STIX]{x1D714}_{\text{o}}^{2}+{\mathcal{C}},\end{eqnarray}$$
where the ambient values
 $k_{o}$
and
 $\unicode[STIX]{x1D714}_{o}$
are assumed to be known.
The six closure coefficients appearing in the above model equations are prescribed as follows. For the turbulence kinetic energy equation (2.12),
 $\unicode[STIX]{x1D6FD}^{\ast }=9/100$
, while for the specific dissipation rate (2.13),
 $\unicode[STIX]{x1D6FC}=1/2$
and
 $\unicode[STIX]{x1D6FD}=3/40$
are assumed (Wilcox Reference Wilcox2008). As to the diffusion coefficients, the set of values suggested by Kok (Reference Kok2000) for turbulent/non-turbulent interfaces is used, namely,
 $\unicode[STIX]{x1D70E}^{\ast }=2/3$
,
 $\unicode[STIX]{x1D70E}=1/2$
and
 $\unicode[STIX]{x1D70E}_{d_{0}}=1/2$
. This set of constants was demonstrated to resolve the free-stream dependency, being valid throughout the boundary layer region.
3 Wavelet-based computational modelling
The two-equation eddy-viscosity model described in the previous section is implemented in the parallel adaptive wavelet-collocation solver (Nejadmalayeri et al.
Reference Nejadmalayeri, Vezolainen, Brown-Dymkoski and Vasilyev2015). The mean flow equations (2.1), (2.2) and (2.3), and the
 $k$
–
 $\unicode[STIX]{x1D714}$
model equations, (2.12) and (2.13), are considered as one set of equations in the flow variables
 $\bar{\unicode[STIX]{x1D70C}}$
,
 $\bar{\unicode[STIX]{x1D70C}}\tilde{u} _{i}$
,
 $\bar{\unicode[STIX]{x1D70C}}\tilde{E}$
,
 $\bar{\unicode[STIX]{x1D70C}}k$
and
 $\bar{\unicode[STIX]{x1D70C}}\unicode[STIX]{x1D714}$
. The URANS governing equations are evaluated at collocation points, which are adapted in space and time to dynamically resolve all the features of the numerical solution.
3.1 Adaptive wavelet collocation
The proposed computational modelling employs the AWC method that uses wavelet multi-resolution analysis to dynamically adapt the local numerical resolution, e.g. Vasilyev & Bowman (Reference Vasilyev and Bowman2000), Vasilyev (Reference Vasilyev2003). By constructing time-dependent spatial grids that are suitable for the time-accurate solution of the governing equations, the efficient resolution of the flow variables on an adaptive optimal mesh is guaranteed. The wavelet decomposition of a spatially dependent field, say
 $u(\boldsymbol{x})$
, using a set of dyadic nested wavelet-collocation grids, can be formally written as
 $$\begin{eqnarray}u(\boldsymbol{x})=\mathop{\sum }_{\boldsymbol{l}\in {\mathcal{L}}^{1}}c_{\boldsymbol{l}}^{1}\unicode[STIX]{x1D719}_{\boldsymbol{l}}^{1}(\boldsymbol{x})+\mathop{\sum }_{j=1}^{J}\mathop{\sum }_{\unicode[STIX]{x1D707}=1}^{2^{n}-1}\mathop{\sum }_{\boldsymbol{k}\in {\mathcal{K}}^{\unicode[STIX]{x1D707},j}}d_{\boldsymbol{k}}^{\unicode[STIX]{x1D707},j}\unicode[STIX]{x1D713}_{\boldsymbol{k}}^{\unicode[STIX]{x1D707},j}(\boldsymbol{x}),\end{eqnarray}$$
where bold subscripts denote
 $n$
-dimensional indexes, while
 ${\mathcal{L}}^{1}$
and
 ${\mathcal{K}}^{\unicode[STIX]{x1D707},j}$
are
 $n$
-dimensional index sets associated with scaling functions
 $\unicode[STIX]{x1D719}_{\boldsymbol{l}}^{1}$
and wavelets
 $\unicode[STIX]{x1D713}_{\boldsymbol{k}}^{\unicode[STIX]{x1D707},j}$
, respectively, with
 $n$
the number of spatial dimensions. Each level of resolution
 $1\leqslant j\leqslant J$
, with
 $J$
being the maximum level present in the approximation (associated with the finest grid), consists of multi-dimensional second generation wavelets belonging to a given family (indexed by
 $\unicode[STIX]{x1D707}$
) and characterized by the same scale. The families are directly specified by the discrete location on the grid, being aligned with the rectilinear axes in the computational space.
In the framework of the eddy-capturing approach, the separation between resolved flow structures and unresolved residual motions is obtained through a nonlinear wavelet thresholding filter. Namely, the filtering operation is performed by applying the wavelet transform to the original field
 $u(\boldsymbol{x})$
, zeroing the wavelet coefficients below a given threshold, and transforming back to the physical space. The resulting approximated field, say
 $u_{{>}}(\boldsymbol{x})$
, which corresponds to a subset of the original wavelets consisting of the dominant modes, can be written as
 $$\begin{eqnarray}u_{{>}}(\boldsymbol{x})=\mathop{\sum }_{\boldsymbol{l}\in {\mathcal{L}}^{1}}c_{\boldsymbol{l}}^{1}\unicode[STIX]{x1D719}_{\boldsymbol{l}}^{1}(\boldsymbol{x})+\mathop{\sum }_{j=1}^{J}\mathop{\sum }_{\unicode[STIX]{x1D707}=1}^{2^{n}-1}\mathop{\sum }_{\substack{ \boldsymbol{k}\in {\mathcal{K}}^{\unicode[STIX]{x1D707},j} \\ |d_{\boldsymbol{k}}^{\unicode[STIX]{x1D707},j}|>\unicode[STIX]{x1D716}\Vert u(\boldsymbol{x})\Vert }}d_{\boldsymbol{k}}^{\unicode[STIX]{x1D707},j}\unicode[STIX]{x1D713}_{\boldsymbol{k}}^{\unicode[STIX]{x1D707},j}(\boldsymbol{x}),\end{eqnarray}$$
where
 $\unicode[STIX]{x1D716}$
stands for the non-dimensional thresholding level.
The above wavelet decomposition is used for both grid adaptation and interpolation, while a hierarchical finite difference scheme, which takes advantage of the wavelet multilevel decomposition, is used for numerical differentiation. The multilevel structure of the wavelet approximation provides a natural way to obtain the solution on a near optimal grid. Due to the one-to-one correspondence between wavelets and grid points, the latter are omitted from the computational mesh if the associated wavelets are omitted from the representation (3.2), which occurs when the corresponding coefficients are below the thresholding level that is prescribed. This way, the method allows the numerical mesh to be dynamically adapted to the evolution of the main flow structures, both in location and scale, while higher resolution computations are carried out where (and only where) steep gradients in the resolved flow field occur.
Depending on the choice of the non-dimensional parameter
 $\unicode[STIX]{x1D716}$
, only a small fraction of the available wavelets is actually used in evolving the solution, which results in the characteristic high grid compression of the AWC method, e.g. Schneider & Vasilyev (Reference Schneider and Vasilyev2010). The wavelet thresholding level can be either kept constant or dynamically adjusted following a Lagrangian spatio-temporally varying thresholding strategy (Nejadmalayeri et al.
Reference Nejadmalayeri, Vezolainen, De Stefano and Vasilyev2014). It should be mentioned that, during the grid adaptation process, once the wavelet mask is created for the collocation points associated with wavelets with significant coefficients, the mask is extended by adding the adjacent wavelets, in both location and scale, whose coefficients can potentially become significant at the next iteration or time step. This operation is performed in each spatial direction, and is unable to take into account the possible local anisotropy in the flow. The use of the additional collocation points associated with adjacent wavelets causes a partial loss of grid compression. Nevertheless, the latter remains very high and the number of degrees-of-freedom is strongly reduced compared to non-adaptive computations.
The AWC approach is particularly effective in the simulation of turbulent external flows that are inherently intermittent, because it has the ability to unambiguously identify and isolate localized dynamically dominant flow structures and to track them. Differently from the classical zonal approach, where the numerical mesh is a priori designed to resolve the wall and the wake regions, regardless of the instantaneous vorticity distribution, the wavelet-based adaptation allows the computational grid to be continuously modified in time in order to automatically follow the local flow intermittency, e.g. De Stefano & Vasilyev (Reference De Stefano and Vasilyev2014). Also, one of the main strengths of the present method lies in the rigorous control of the accuracy of the numerical solution through the choice of the thresholding level
 $\unicode[STIX]{x1D716}$
in the wavelet decomposition (3.2). Fundamentally, this parameter determines the relative dominance of the eddies that are resolved and, therefore, controls the significance of the residual field associated with the wavelets that are discarded. For accurate solution of the W-URANS governing equations, a very low value for the parameter
 $\unicode[STIX]{x1D716}$
has to be prescribed so that all the important features of the numerical solution are resolved accurately.
It is worth stressing that the mechanism used by the AWC methodology to analyse and refine the mesh is inherently isotropic. The existence of high gradients in a single direction automatically leads to a local refinement that however involves all the spatial directions. In practice, the method is unable to distinguish highly correlated directions in the flow field, where the solution is changing less rapidly, and the existence of well-oriented structures cannot be exploited in the grid adaptation process. Therefore, filament- and sheet-like structures in the flow field are indeed overresolved, which undermines the benefits of the dynamic adaptivity. This represents an issue for external turbulent flows where, on the contrary, the use of an anisotropic mesh refinement strategy would permit the efficient simulation of the boundary layer and the shear layer regions, by using a coarser discretization in some suitable directions.
In addition, the AWC approach is based on second generation tensorial wavelets, which require the use of a rectilinear computational grid. To overcome the resultant difficulty in dealing with complex flows, volume-penalization methods have been employed, where additional forcing terms are considered in the governing equations in order to mimic the presence of solid bodies (Angot et al. Reference Angot, Bruneau and Fabrie1999; Kevlahan & Vasilyev Reference Kevlahan and Vasilyev2005). For example, the shedding flow past a square cylinder has been successfully simulated with the coupled wavelet-collocation/volume-penalization approach in (De Stefano, Nejadmalayeri & Vasilyev Reference De Stefano, Nejadmalayeri and Vasilyev2016). However, the hybrid method has some drawbacks such as the approximation with which the wall boundary conditions are imposed and the need for higher spatial resolution in the direction normal to the boundary. As a consequence, the numerical resolution that is appropriate in the wall-normal direction results in very excessive refinement in the tangential directions, ultimately leading to inefficient use of computational resources.
3.2 Adaptive-anisotropic curvilinear mesh refinement
Despite the above mentioned shortcomings, tensorial lifted-interpolated wavelets remain highly valuable for the numerical solution of fluid dynamics equations, owing to their simplicity and computational efficiency, e.g. Schneider & Vasilyev (Reference Schneider and Vasilyev2010). With the recent development of the adaptive-anisotropic wavelet-collocation method (Brown-Dymkoski & Vasilyev Reference Brown-Dymkoski and Vasilyev2017), the issue has been addressed by keeping the computational space separate from the physical one, while introducing a mapping between them. This way, a suitable numerical mesh can be utilized in the physical space, somewhat independently from the rectilinear grid that exists in the computational space. The introduction of a function that maps the physical domain, say
 $\boldsymbol{x}\in \unicode[STIX]{x1D6FA}_{p}$
, to the computational domain, say
 $\unicode[STIX]{x1D743}\in \unicode[STIX]{x1D6FA}_{c}$
, allows for the necessary flexibility of the mesh geometry when dealing with flows around obstacles. In physical space, a more optimal spatial distribution of mesh points can be realized, based on the particular flow being simulated, where both the aspect ratio and the orientation of the cells can be properly varied. Furthermore, body-fitted meshes can be constructed, which enables the accurate resolution of the boundary layer and wake regions. At the same time, the structured rectilinear assembly of collocation points defining the discrete topology in the computational space stands unaltered, which permits efficient discrete wavelet transform and derivative approximations.
Practically, local anisotropic refinement and stretching of the numerical mesh can be introduced by adjusting the location and distribution of points by means of the definition of the appropriate coordinate mapping
 $\boldsymbol{x}(\unicode[STIX]{x1D743})$
. Given the rule of correspondence between the two domains, the key role is played by the Jacobian matrix
 $$\begin{eqnarray}\unicode[STIX]{x1D611}_{ij}=\frac{\unicode[STIX]{x2202}x_{i}}{\unicode[STIX]{x2202}\unicode[STIX]{x1D709}_{j}},\end{eqnarray}$$
which is readily computed using the integrated finite difference framework of the AWC solver. For the calculation of the different terms in the W-URANS governing equations, which are naturally evaluated in the physical space, computational derivative approximations are computed by means of
 $$\begin{eqnarray}\frac{\unicode[STIX]{x2202}}{\unicode[STIX]{x2202}x_{j}}=\unicode[STIX]{x1D611}_{ji}^{-1}\frac{\unicode[STIX]{x2202}}{\unicode[STIX]{x2202}\unicode[STIX]{x1D709}_{i}},\end{eqnarray}$$
where
 $\unicode[STIX]{x1D611}_{ij}^{-1}$
is the inverse Jacobian matrix. Particular care must be taken to avoid cells with high skewness, degenerate Jacobian matrix (
 $\det (\unicode[STIX]{x1D645})\rightarrow 0$
) and non-smooth mesh lines, which would cause a degradation of the transform operations that cannot be compensated for by the automated wavelet grid refinement.
For simple geometry flows, like the one presented in the next section, with an a priori knowledge of the flow behaviour, explicit algebraic mapping functions can be imposed in order to achieve increased mesh resolution in particular flow regions. In addition, the adoption of body-fitting meshes prevents the use of penalty terms. Curvilinear structured meshes based on analytical continuous curvilinear mapping can be resorted to with great advantage. The wavelet-based adaptation implemented in
 $\unicode[STIX]{x1D6FA}_{c}$
leads to the adjustment of the local mesh density in
 $\unicode[STIX]{x1D6FA}_{p}$
, while preserving the geometry and the local aspect ratio of the mesh elements. Also, by properly constructing the curvilinear mapping, highly correlated gradients in physical space can become normalized once transformed to computational space, which results in more efficient grid refining or coarsening, while optimally using the available computational resources. To maintain the accuracy of the transform operations, the wavelet-based adaptation can also occur upon the mapping fields themselves, which guarantees the desired high quality of the mesh.
It is worth noting that the use of curvilinear meshes, which adds flexibility and robustness to classical wavelet-based methods, would also enhance the efficiency of hybrid volume-penalization/wavelet-collocation methods, which have been successfully used for external turbulent flows (De Stefano & Vasilyev Reference De Stefano and Vasilyev2014; De Stefano et al. Reference De Stefano, Nejadmalayeri and Vasilyev2016). In fact, the integration of the volume-penalization technique with adaptive mesh refinement with isotropic mesh elements, typical of traditional approaches, still does not allow us to perform high Reynolds number flow simulations. This is due to the high computational overhead related to the use of isotropic mesh elements that results from the overresolution in the directions tangential to the obstacle surface. The coupling of volume penalization and anisotropic adaptive mesh refinement would definitely improve the computational performance of the hybrid approach. This further development, being out of the scope of the present study, which is devoted to body-fitted meshes, is the subject of our future research.
4 Circular cylinder flow simulation
In order to demonstrate the wavelet-based adaptive unsteady Reynolds-averaged Navier–Stokes approach, the W-URANS method, supplied with the
 $k$
–
 $\unicode[STIX]{x1D714}$
model described in § 2, is applied to the simulation of the turbulent flow around a stationary circular cylinder immersed in a uniform fluid stream. An analytic curvilinear mapping is introduced between the computational space and the physical one, where a curvilinear structured body-fitted mesh is defined. The continuous mapping function is suitably defined so to have an O-type mesh in the cross-section plane of the cylinder.
In this work, the azimuthal and the radial distributions of points proposed by Beaudan & Moin (Reference Beaudan and Moin1994), based on the so-called wake envelope, are utilized in the physical space. This way, a more detailed estimation of the wake region becomes possible, which ensures more efficient resolution of the shedding vortex street and numerical mesh elements with better anisotropy in the boundary layer.
4.1 Case settings
For the present experiments, the free-stream Mach number is set at a low subsonic value, that is
 $Ma=U/c_{o}=0.2$
, where
 $U$
stands for the velocity of the oncoming flow and
 $c_{o}=\sqrt{\unicode[STIX]{x1D6FE}p_{o}/\unicode[STIX]{x1D70C}_{o}}$
is the ambient (far-field) speed of sound. The mean flow Reynolds number is fixed as
 $Re=\unicode[STIX]{x1D70C}_{o}UD/\unicode[STIX]{x1D707}_{o}=3900$
, where
 $D$
corresponds to the cylinder diameter and
 $\unicode[STIX]{x1D707}_{o}$
stands for the far-field dynamic viscosity. As expected for this subcritical Reynolds number, the separating shear layers on the side of the cylinder are observed to become unstable and the complete transition to turbulent flow occurs (Williamson Reference Williamson1996).
The flow around the two-dimensional section of the obstacle is described in a Cartesian coordinate system
 $(x,y)$
, where the
 $x$
-axis corresponds to the inlet flow direction. In polar coordinates
 $(r,\unicode[STIX]{x1D703})$
the corresponding annular physical domain is defined by
 $0.5<r/D<20$
,
 $0\leqslant \unicode[STIX]{x1D703}<2\unicode[STIX]{x03C0}$
. In terms of spatial resolution, on the finest grid (
 $j=J$
), the first point is placed at a radial distance
 $\unicode[STIX]{x0394}r\approx 0.0032D$
from the surface. Also, the cells adjacent to the body surface have an aspect ratio of approximately 5 : 2.
The W-URANS solution is attained by employing the fourth-order AWC method, supplied with the linearized Crank–Nicolson split-step time integration method with adaptive time stepping, and the parallel version of the AWC solver (Nejadmalayeri et al.
Reference Nejadmalayeri, Vezolainen, Brown-Dymkoski and Vasilyev2015). The discretization of the computational domain is accomplished by making use of eight nested wavelet-collocation grids for the wavelet decomposition (3.2), where
 $J=8$
. In order to achieve an accurate solution of the W-URANS governing equations a constant wavelet threshold of
 $\unicode[STIX]{x1D716}=10^{-4}$
is used. Naturally, the numerical mesh is adapted based on the momentum and the total energy fields. In addition, for the present case of wall-bounded flow, the mesh is also adapted on the velocity gradient represented by the vorticity and the magnitude of the strain-rate tensor.
In order to demonstrate the convergence of the solution of the W-URANS equations, in terms of both the level of resolution
 $J$
and the wavelet threshold
 $\unicode[STIX]{x1D716}$
, starting from a given initial fully developed field, a number of different calculations with different values of
 $J$
and
 $\unicode[STIX]{x1D716}$
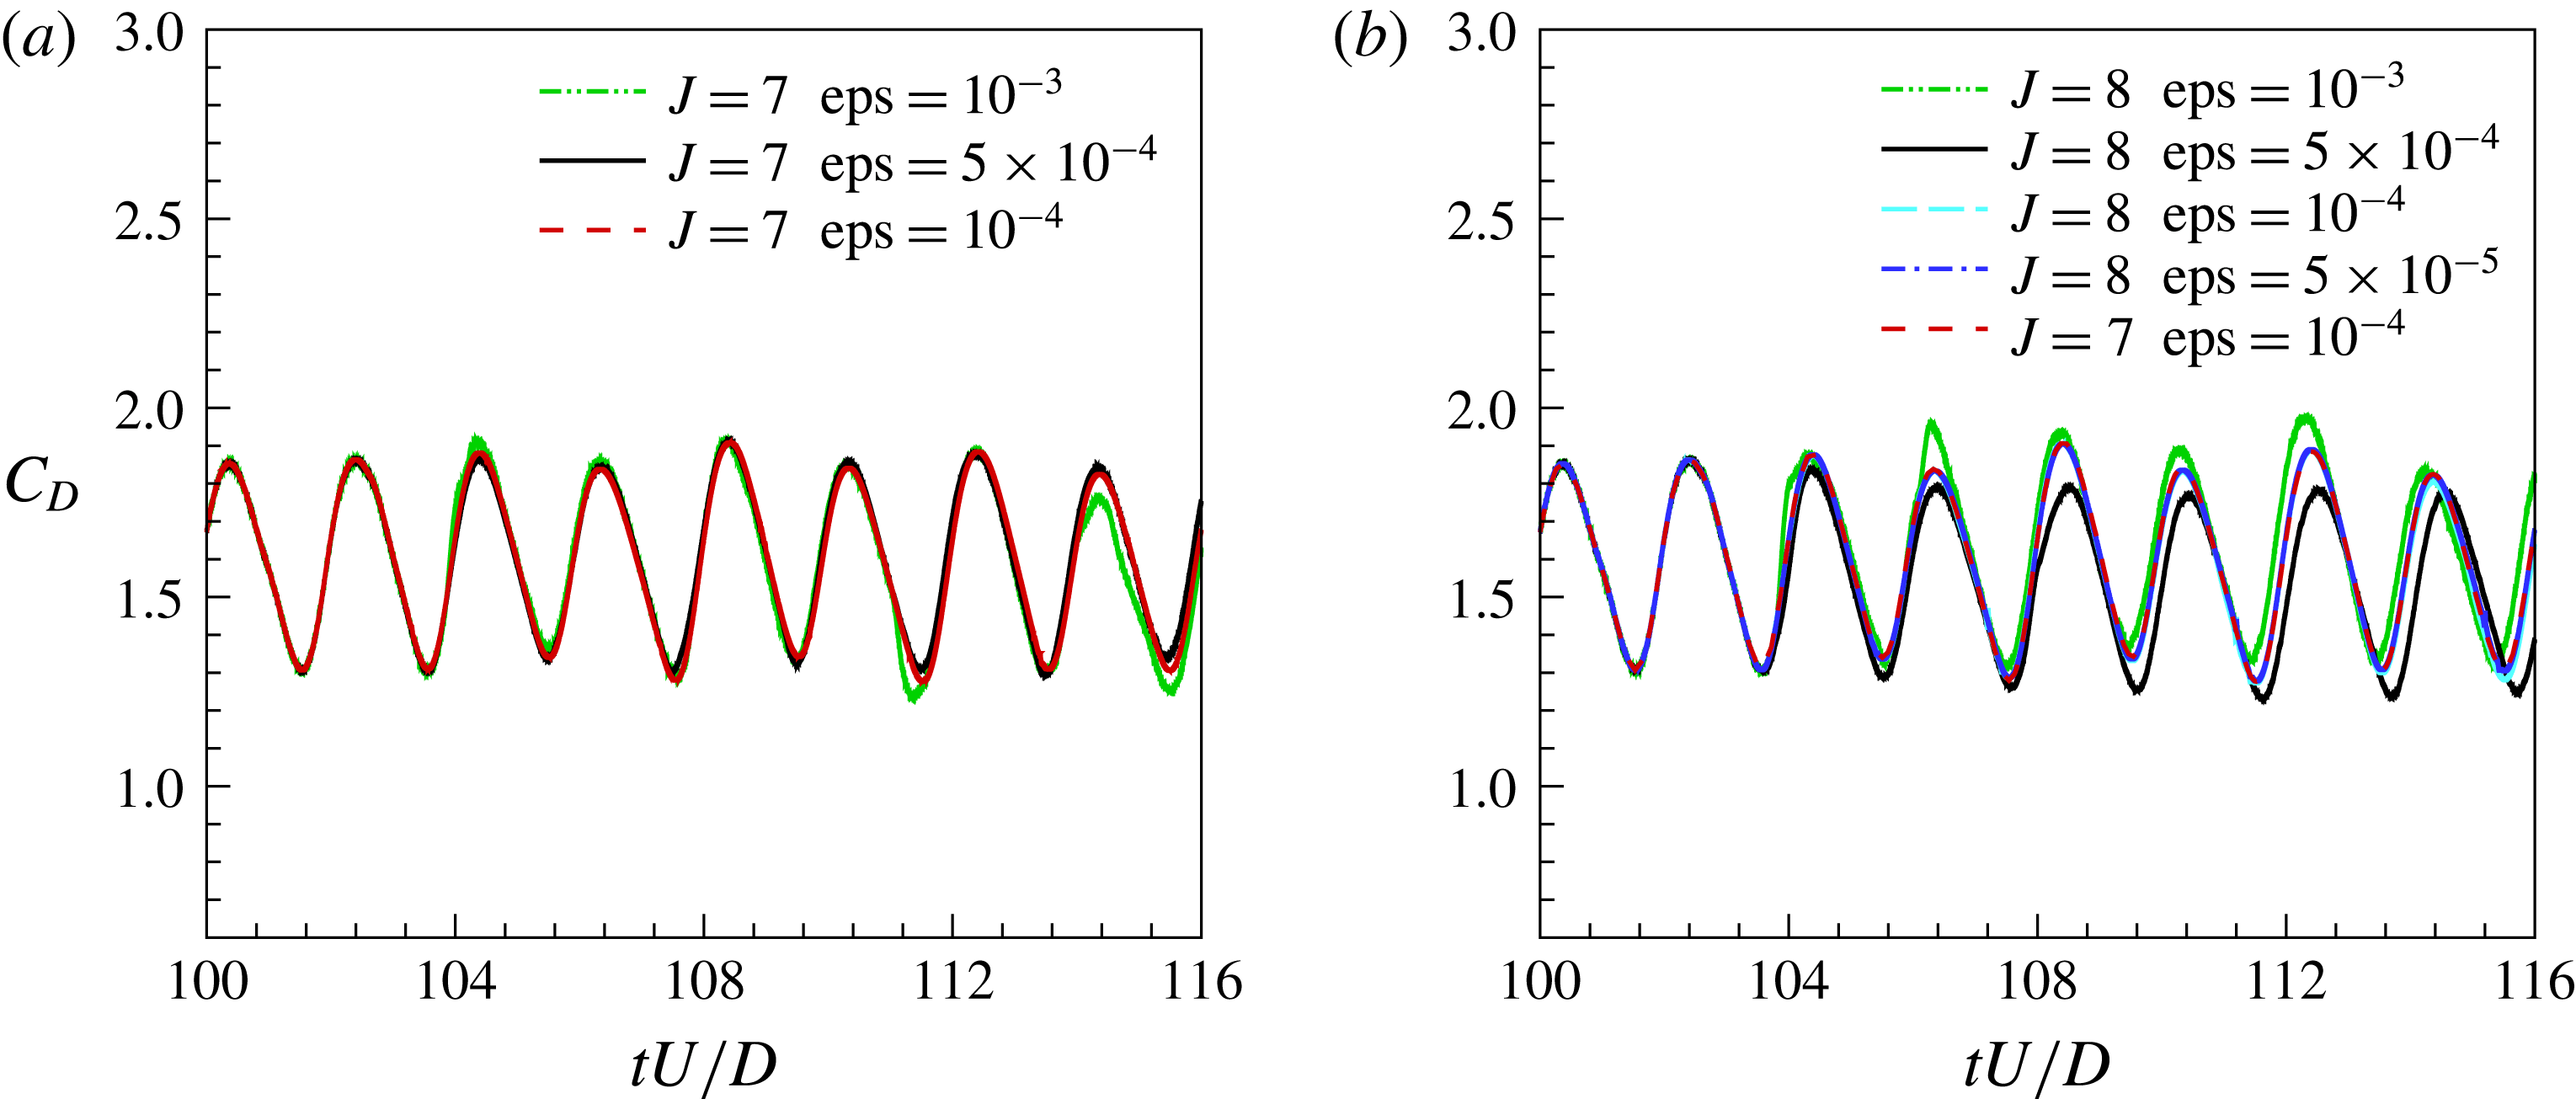
have been conducted. The additional computations have been carried out for a time interval corresponding to about four vortex shedding periods. From inspection of figure 1, where the different time histories of the drag coefficient are reported, the convergence of the W-URANS solution for decreasing wavelet thresholds is apparent. The thresholding level that is practically needed for an accurate solution depends on the choice of the maximum level of resolution. Namely, the higher is
 $J$
, and thus the finer is the spatial resolution, the lower must be the threshold
 $\unicode[STIX]{x1D716}$
that is employed. This is mainly due to the required accuracy with which the approximate boundary condition for the specific dissipation rate must be imposed at the obstacle surface, as discussed in detail in the following section. It is worth noting that for very low threshold values, say,
 $\unicode[STIX]{x1D716}=10^{-4}$
, adding a further level of resolution (by increasing
 $J$
) does not substantially improve the solution.
Time history of the drag coefficient for different wavelet resolutions.

The above qualitative discussion is provided for illustration purposes only. For a quantitative analysis of the convergence of the A-AWCM solution the interested reader is referred to the work by Brown-Dymkoski & Vasilyev (Reference Brown-Dymkoski and Vasilyev2017), where the convergence of the integral flow parameters with the wavelet threshold was demonstrated for the wavelet-based direct numerical simulation of the circular cylinder flow at low Reynolds number.
4.2 Initial and boundary conditions
As to the mean flow variables, the far-field conditions that correspond to the known thermo-fluid dynamic state of the oncoming flow are assumed as initial conditions, throughout the physical domain. No-slip wall boundary conditions are imposed at the body surface, where the temperature is assumed constant.
The far-field boundary conditions for the turbulence model variables
 $k$
and
 $\unicode[STIX]{x1D714}$
are set as follows. The ambient value for the turbulence kinetic energy
 $k_{0}$
is derived from imposing a certain turbulence intensity for the oncoming flow, namely,
 ${\mathcal{I}}=4\,\%$
, which leads us to prescribe
 $k_{o}=2.4\times 10^{-3}~U^{2}$
. As regards the turbulence frequency, the ambient value
 $\unicode[STIX]{x1D714}_{o}$
is assumed to depend on the characteristic length scale that is associated with the aerodynamic body under consideration, which is the cylinder diameter in the present case. In practice,
 $\unicode[STIX]{x1D714}_{o}=10~U/D$
is assumed, which approximately corresponds to a unitary value for the turbulent eddy viscosity to molecular viscosity ratio in the free stream. The above far-field values are used as initial conditions for the evolution equations (2.12) and (2.13), throughout the physical domain. As to boundary conditions at the inner boundary (
 $r/D=0.5$
), the turbulence kinetic energy and the specific dissipation rate are assumed to take known values at the body surface, say
 $k_{wall}$
and
 $\unicode[STIX]{x1D714}_{wall}$
. Differently from
 $k_{wall}$
, which is zero by definition, the determination of
 $\unicode[STIX]{x1D714}_{wall}$
is not trivial. Indeed, the turbulence frequency theoretically tends to infinity, scaling as
 $\unicode[STIX]{x1D714}=6\unicode[STIX]{x1D708}/(\unicode[STIX]{x1D6FD}y^{2})$
, for vanishing distance
 $y$
from the wall (Wilcox Reference Wilcox1988), with
 $\unicode[STIX]{x1D708}$
being the fluid kinematic viscosity. In practice, turbulence models based on the solution of equation (2.13) provide accurate results when sufficiently large values for
 $\unicode[STIX]{x1D714}_{wall}$
are prescribed. In this study, following a common practice in the
 $k$
–
 $\unicode[STIX]{x1D714}$
model research, the following approximate condition is imposed, namely,
 $\unicode[STIX]{x1D714}_{wall}=6\unicode[STIX]{x1D708}/(\unicode[STIX]{x1D6FD}\unicode[STIX]{x1D6FF}^{2})=80\unicode[STIX]{x1D708}/\unicode[STIX]{x1D6FF}^{2}$
, where
 $\unicode[STIX]{x1D6FF}$
represents the normal distance to the next resolved point away from the wall.
Finally, for all the resolved variables, non-reflective boundary conditions in the far field are simulated by considering a characteristic-based buffer region (Freund Reference Freund1997), where the convective forcing is aligned with the radial direction for computational efficiency.
5 Results and discussion
In order to calculate the mean flow statistics, the resolved variables for the developed flow around the cylinder are averaged in time over a suitable number of shedding periods. In this study, a novel time averaging approach for adaptive W-URANS computations is developed. Briefly, in addition to wavelet adaptation on instantaneous solution variables, the numerical mesh is also adapted on time-averaged quantities, which allows for the accumulation of statistics on the time-varying adaptive computational mesh. This way, statistical variables are evaluated on the fly, during the simulation, without needing to interpolate the instantaneous solution onto the non-adaptive computational mesh and then averaging it. In the following, mean quantities are indicated by angular brackets.
5.1 Two-dimensional simulation
The contour maps of the mean streamwise velocity
 $\langle u\rangle /U$
and the mean pressure coefficient, defined as
 $C_{P}=(\langle p\rangle -p_{o})/(\unicode[STIX]{x1D70C}_{o}U^{2}/2)$
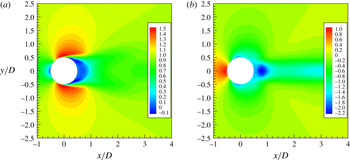
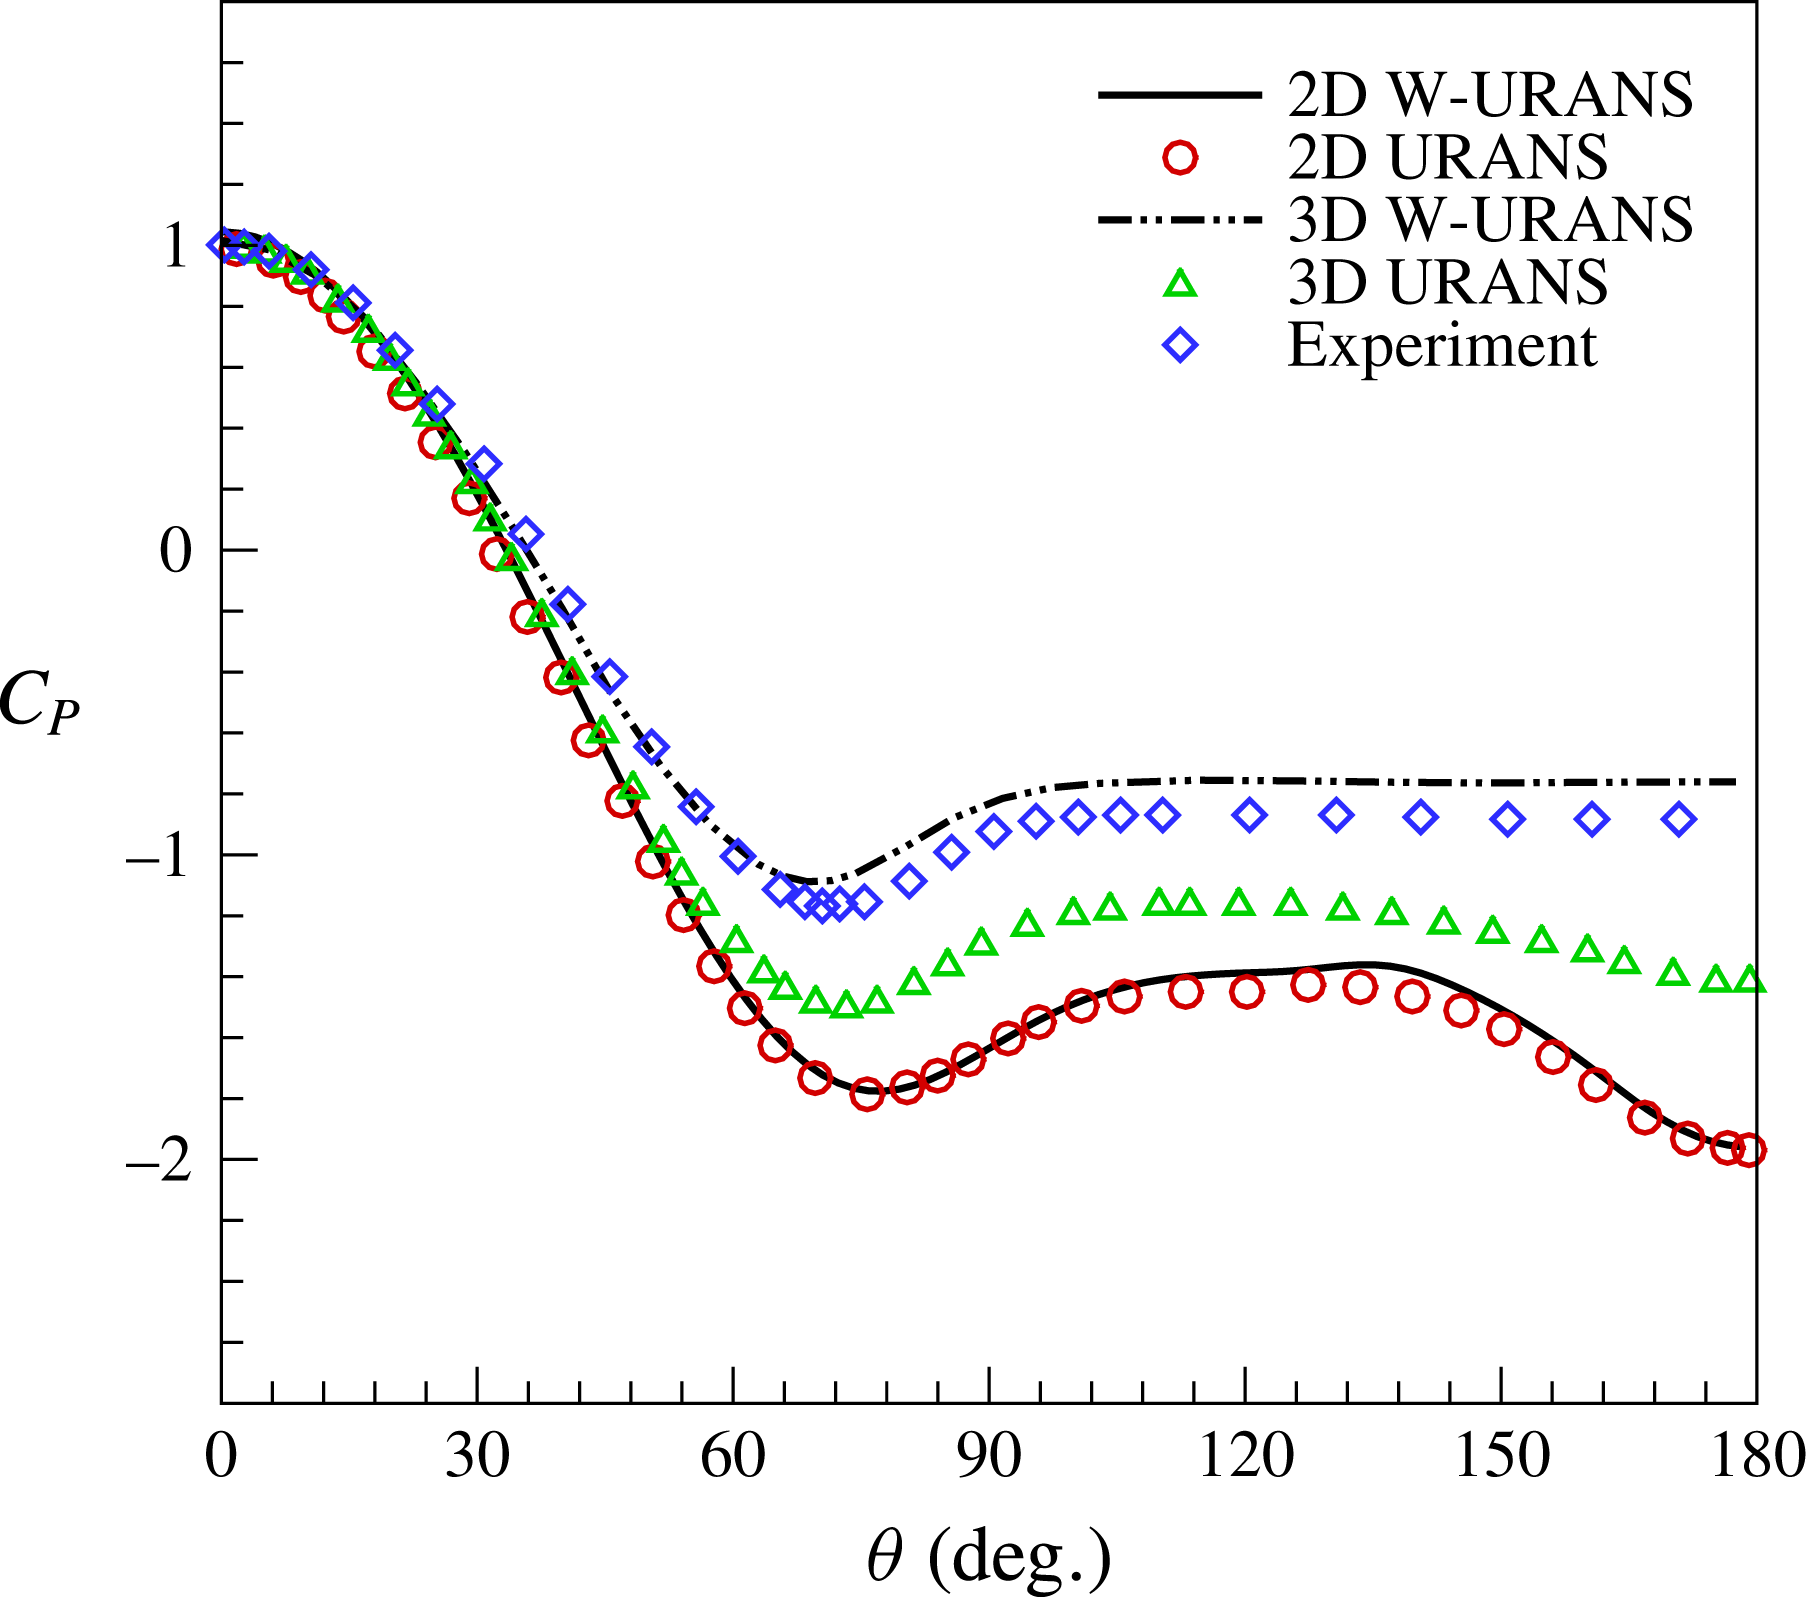
, for two-dimensional (2D) W-URANS simulations are drawn in figure 2. The pressure coefficient tends to take a unitary value in the stagnation region, which bears out the correct lateral extension of the present physical domain. The accelerating flow region at the frontward side is well reproduced, whereas the 2D approach fails in predicting the mean flow at the rearward side of the cylinder, where the pressure recovery is underestimated. This is confirmed by inspection of figure 3, where the pressure distribution on the body surface is shown. The present adaptive solution is reported together with the non-adaptive 2D URANS results in Young & Ooi (Reference Young and Ooi2007) (circle symbols), at the same Reynolds number, compared to the experimental data of Norberg at
 $Re=4020$
, as reported in Kravchenko & Moin (Reference Kravchenko and Moin2000) (diamond symbols). The current 2D W-URANS solution is in very good agreement with the reference numerical simulation, while a severe discrepancy exists with experimental findings. Evidently, the suction peak and the base pressure coefficient are overestimated, which leads to excessive values for the unsteady aerodynamic loads on the cylinder.
Contour maps of mean streamwise velocity (a) and mean pressure coefficient (b) in the near wake of the cylinder for 2D W-URANS simulations.

Pressure coefficient on the circular cylinder: W-URANS solutions (solid and dash-dot-dot lines) compared to URANS results in Young & Ooi (Reference Young and Ooi2007) (circles and triangles) and experiment (diamonds).

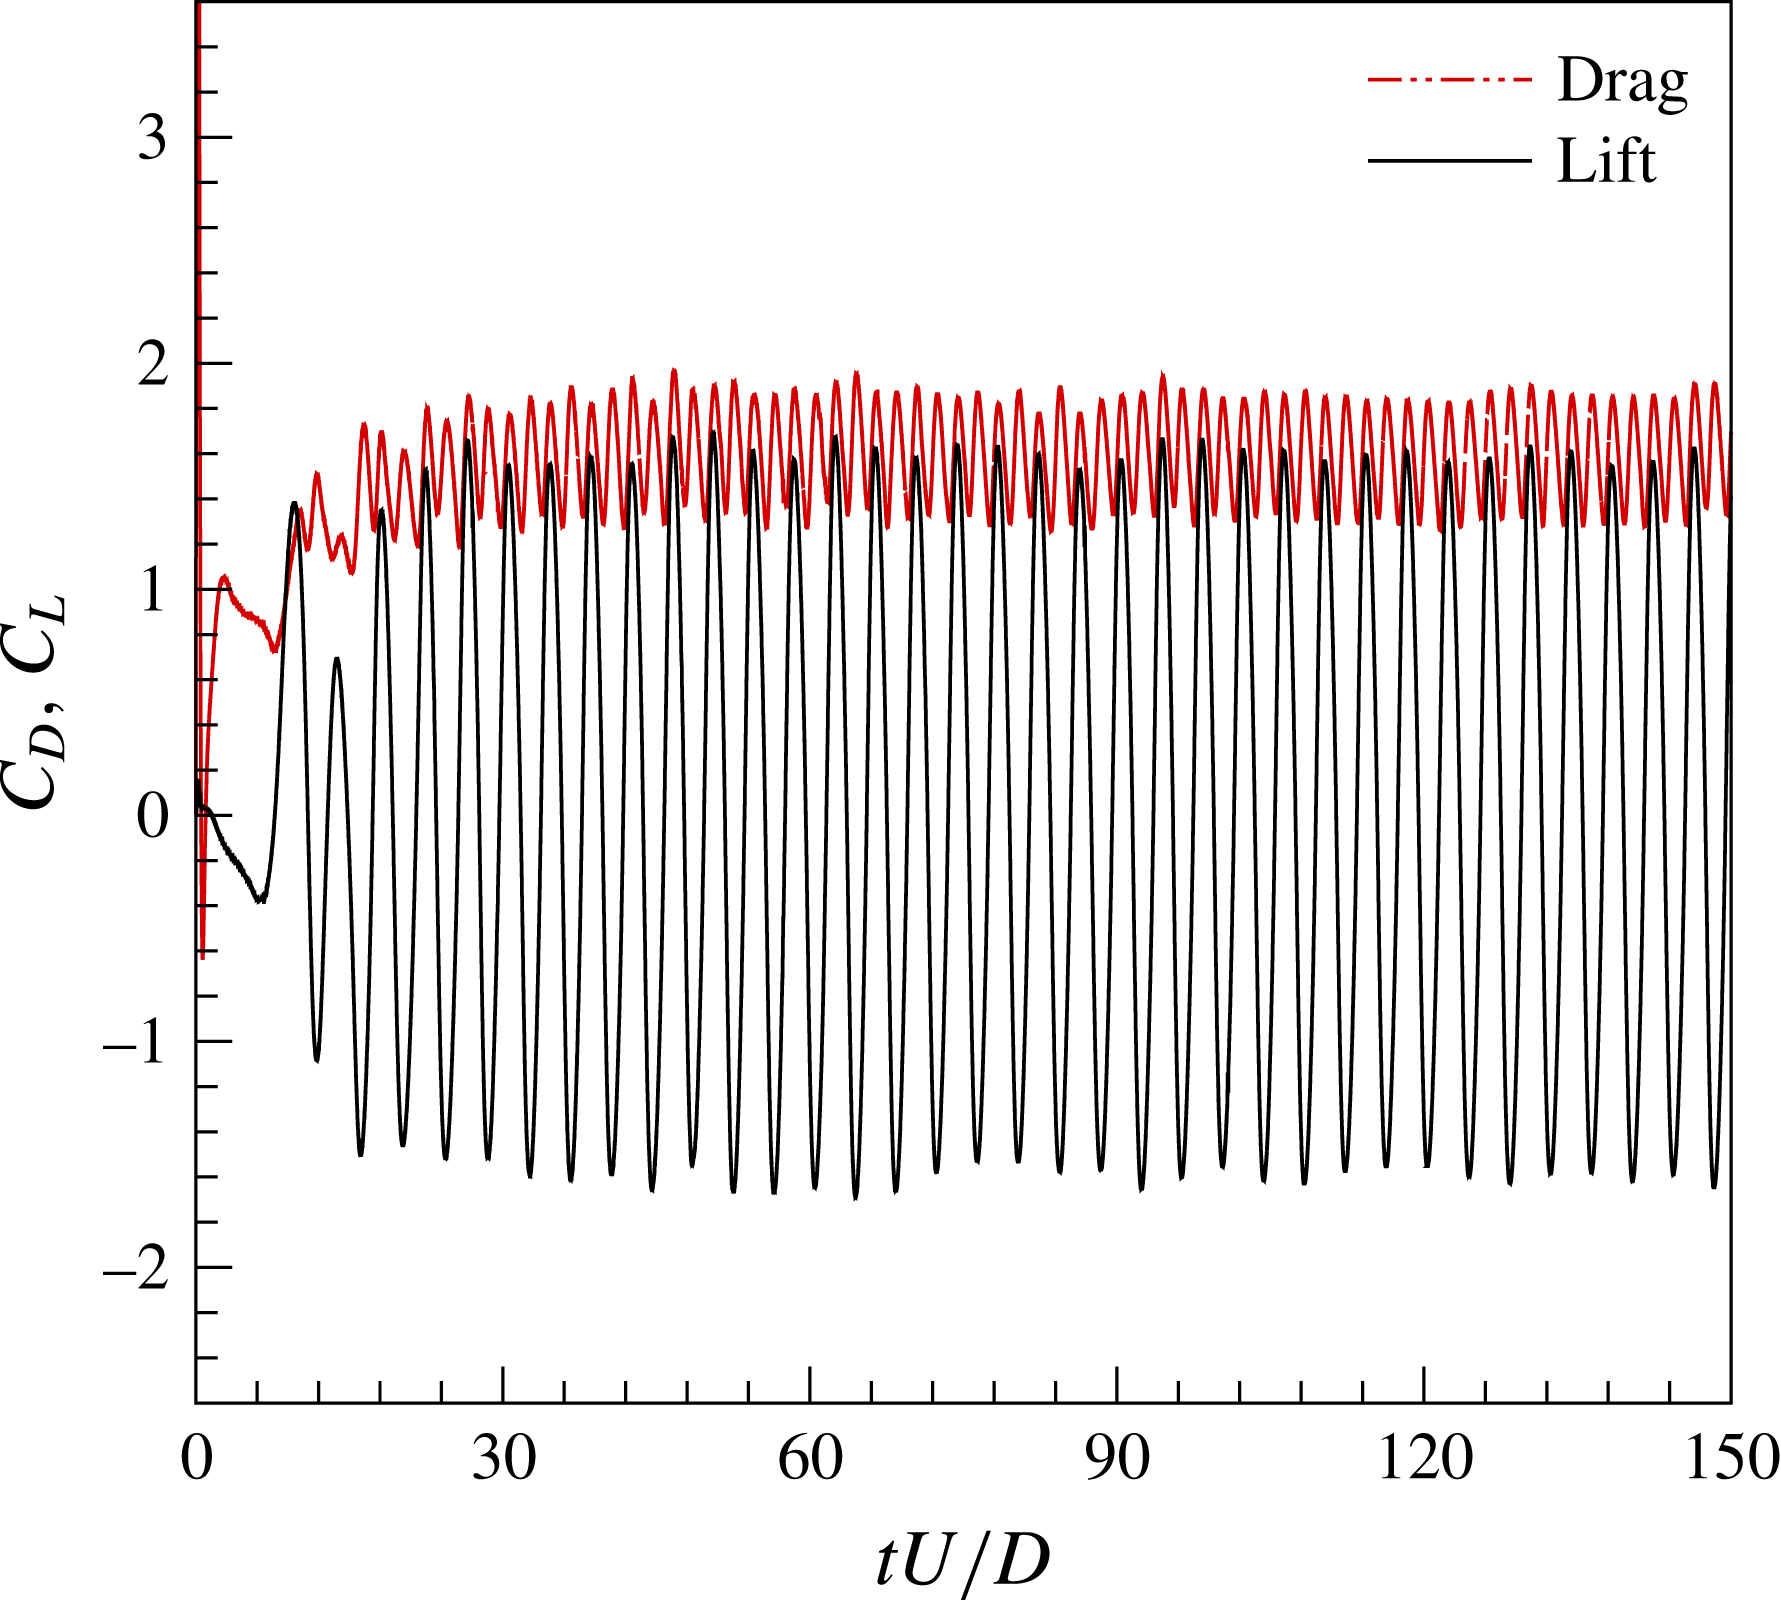
Time histories of drag (dash-dot-dot line) and lift (solid line) force coefficients.

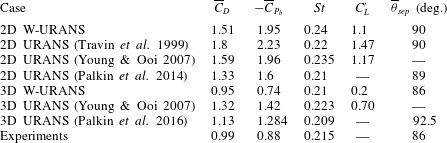
The time histories of the lift and drag force coefficients are reported in figure 4. After the initial transient phase of flow development, these parameters show the typical oscillating behaviour of vortex shedding flows. In table 1, the global flow parameters provided by the present simulation are compared with reference data from both URANS calculations and experiments. The mean drag coefficient
 $\overline{C}_{D}$
, the mean base pressure coefficient
 $-\overline{C}_{P_{b}}$
, the Strouhal number
 $St=fD/U$
(with
 $f$
the vortex shedding frequency), the root-mean-square value of the lift coefficient
 $C_{L}^{\prime }$
and the mean separation angle
 $\overline{\unicode[STIX]{x1D703}}_{sep}$
are presented. The additional reference numerical data at the same Reynolds number of 3900 are given in Palkin, Mullyadzhanov & Hanjalić (Reference Palkin, Mullyadzhanov and Hanjalić2014) and Palkin et al. (Reference Palkin, Mullyadzhanov, Hadziabdić and Hanjalić2016). The experimental findings are those reported in Kravchenko & Moin (Reference Kravchenko and Moin2000), as provided by a number of experimental studies at the same or slightly different Reynolds number. The 2D W-URANS results are in good agreement with reference 2D URANS data. On the contrary, when making a comparison with experimental data, two-dimensional simulations appear poor, while overestimating all the above flow parameters. As expected, three-dimensional effects are indeed important at this subcritical Reynolds number and 3D simulations are needed for a better prediction of the mean flow statistics, e.g. Mittal & Balachandar (Reference Mittal and Balachandar1995). The inadequate representation of the very near wake of the cylinder is also apparent in figure 5, where the profile of mean streamwise velocity
 $\langle u\rangle /U$
along the centreline (
 $y/D=0$
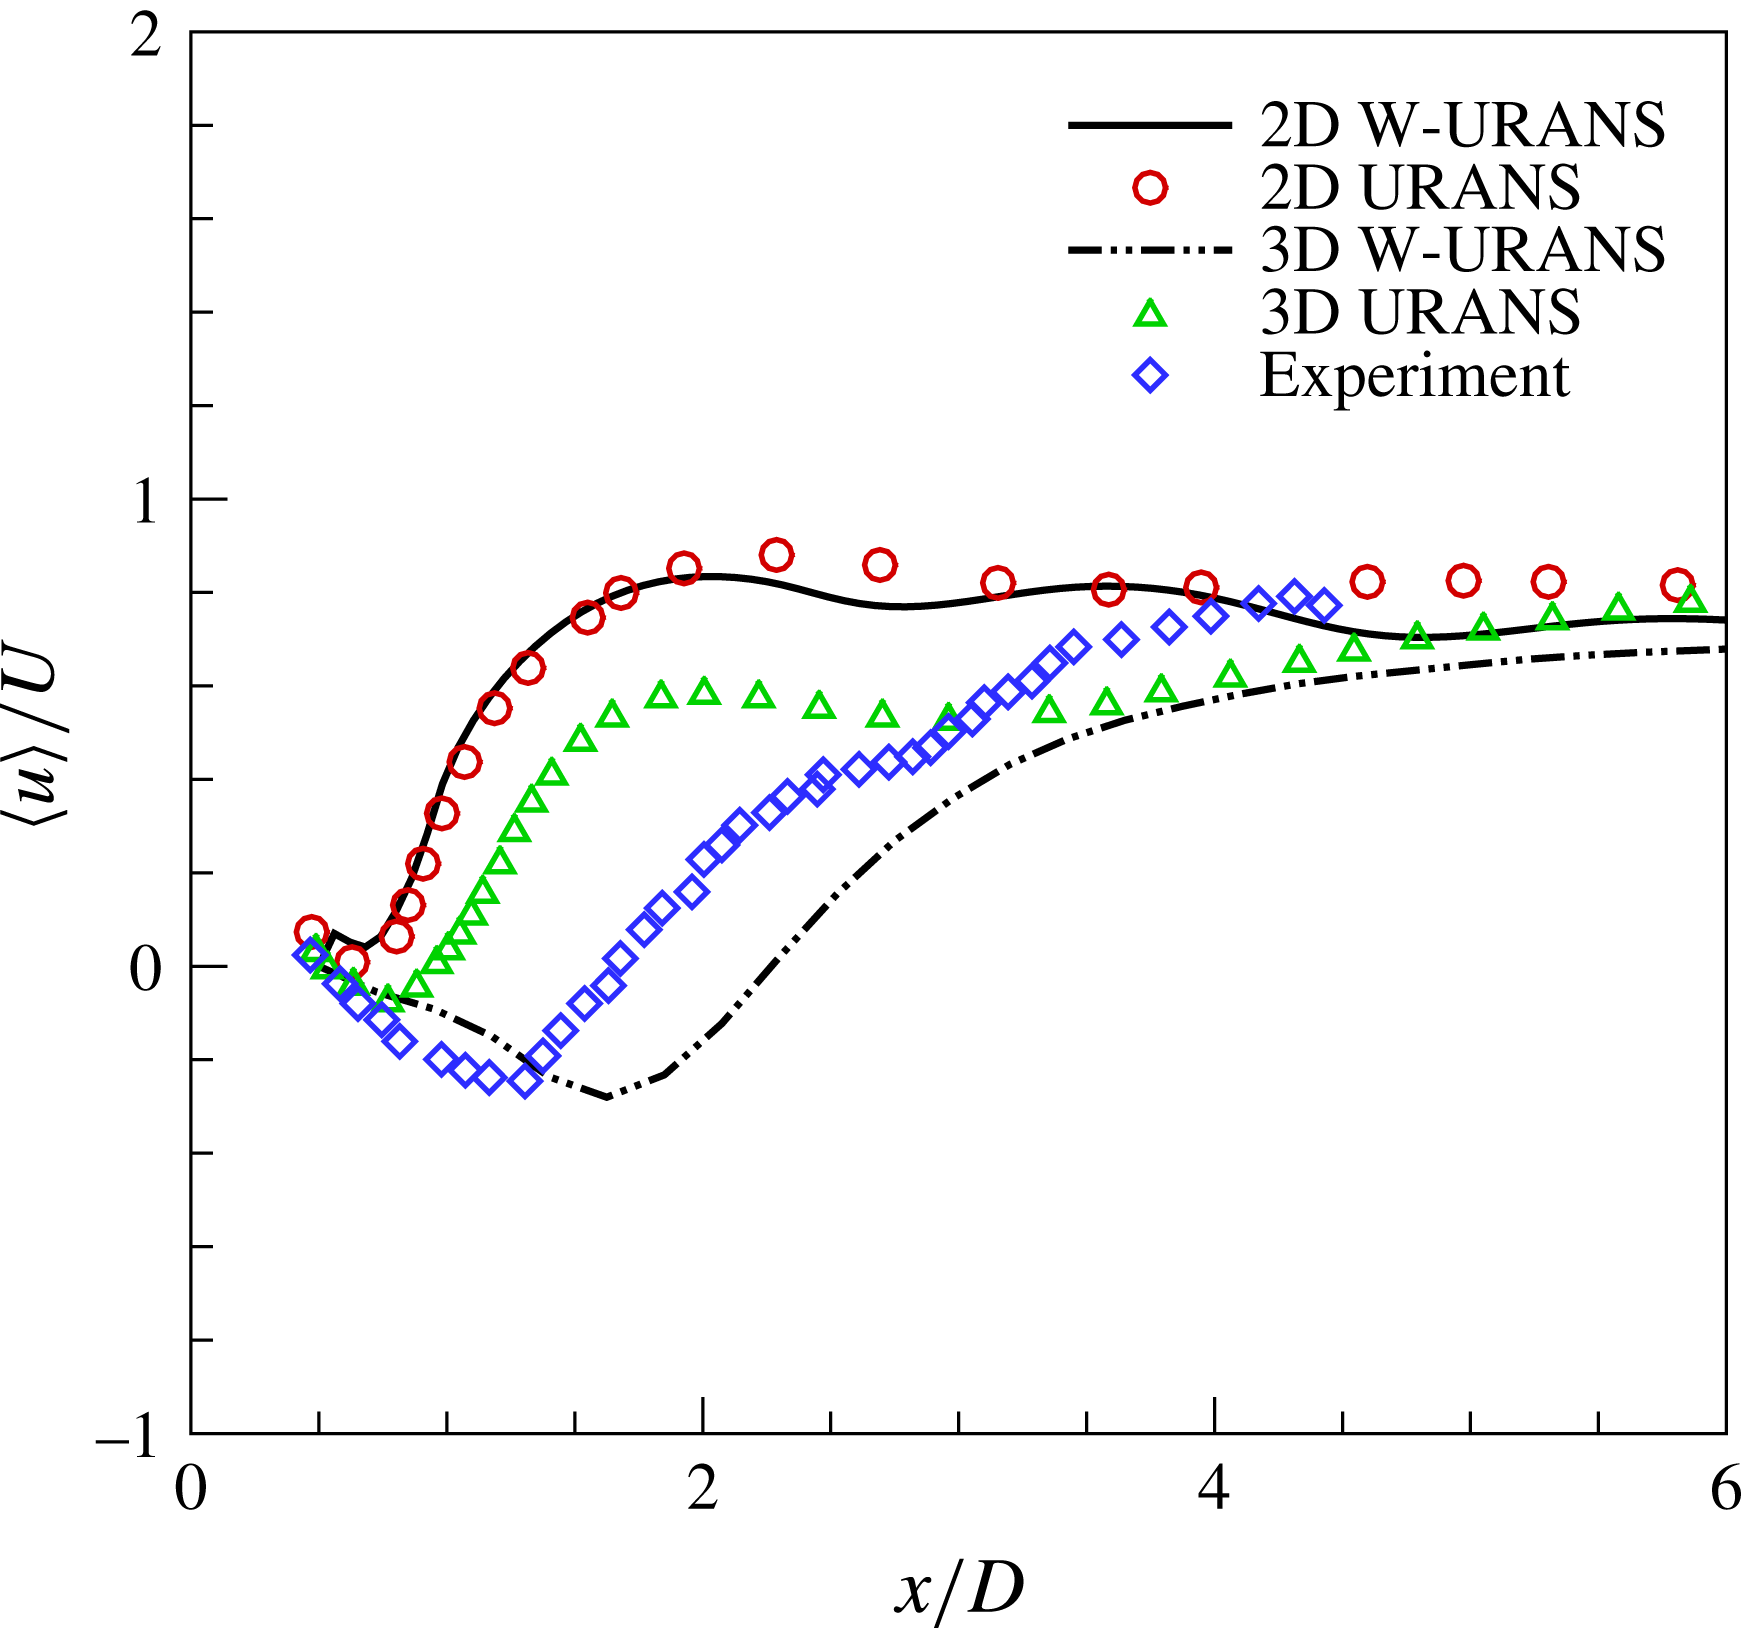
) is drawn, compared to the non-adaptive 2D URANS of Young & Ooi (Reference Young and Ooi2007) and experimental findings of Lourenco and Shih reported in Kravchenko & Moin (Reference Kravchenko and Moin2000). Again, the 2D W-URANS solution matches with the reference 2D numerical data, while the experimental value is captured only farther from the obstacle.
Profile of mean streamwise velocity along the centreline (
 $y/D=0$
) in the near wake of the cylinder: W-URANS solutions (solid and dash-dot-dot lines) compared to URANS results in Young & Ooi (Reference Young and Ooi2007) (circles and triangles) and experiment of Lourenco and Shih reported in Kravchenko & Moin (Reference Kravchenko and Moin2000) (diamonds).

Integral flow parameters: present W-URANS compared to URANS results and experimental findings reported in Kravchenko & Moin (Reference Kravchenko and Moin2000).

As to turbulence model variables, the contour maps of the mean turbulence kinetic energy
 $\langle k\rangle /U^{2}$
and the specific dissipation rate
 $\langle \unicode[STIX]{x1D714}\rangle /(U/D)$
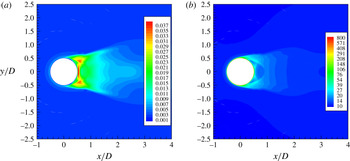
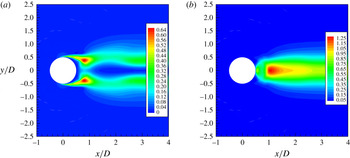
for 2D W-URANS simulations are reported in figure 6. For the sake of clarity, given the almost singular behaviour of the turbulence frequency in the wall region, an exponential distribution of contour levels is adopted for this variable. The turbulence, which is generated from the separated shear layers on the side of the cylinder, due to time averaging, appear concentrated in the very near wake of the obstacle. The underlying tessellation that is apparent in the above pictures corresponds to the instantaneous numerical mesh at a the final time instant of averaging.
Contour maps of mean turbulence kinetic energy (a) and mean specific dissipation rate (b) in the near wake of the cylinder for 2D W-URANS simulations.

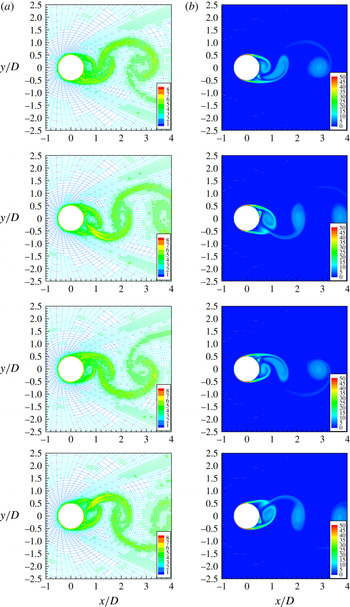
Instantaneous numerical mesh coloured by the level of resolution (a) and contour map of vorticity magnitude (b) in the near wake of the cylinder for 2D W-URANS simulations at four time instants equispaced within a shedding cycle.

In order to illustrate the high adaptivity of the proposed W-URANS method, in figure 7, the instantaneous numerical mesh (a) for 2D W-URANS simulations is reported together with the contour map of the corresponding vorticity field (b) at four time instants, which are equispaced throughout the period of one shedding cycle. The particular arrangement of grid points obeying the wake envelope approach of Beaudan & Moin (Reference Beaudan and Moin1994) is apparent. The mesh lines are coloured by the resolution level that is indexed by
 $1\leqslant j\leqslant 8$
. At a given time instant, the distribution of collocation points in the physical domain closely resembles the position of the main flow structures. Differently from other non-adaptive numerical studies, where the non-uniform mesh spacing is given a priori by means of a zonal approach, in the present work, the actual mesh is dynamically determined following the flow evolution in the spatio-temporal domain. It is worth noting that the dissipation of the shedding vortex street causes the decrease of grid density farther from the cylinder.
When looking at the wall region, the advantage of using a body-fitted mesh with anisotropic refinement is demonstrated. The spatial resolution is not uniform along the surface, but rather tracks unsteadiness within the boundary layer. The number of points used to resolve the stagnation and the separation regions, as well as the near-wake recirculation region, is effectively optimized. In practice, the use of anisotropically stretched mesh elements on the body surface reduces the number of refinement levels that are needed to resolve the boundary layer. There are only very limited flow regions where the highest resolution level is involved, which indicates that the numerical solution is indeed captured at the highest possible accuracy. Furthermore, the adaptive method is able to follow the intermittency of the oscillating shear layer resulting from the boundary layer separation. As vortical structures are convected into the far wake, the presence of higher resolution levels compensate for the larger cells inherent to the O-mesh, while maintaining the highly accurate spatial resolution. In fact, while the smallest physical length scales are typically found at the body surface and in the turbulent wake, the curvilinear transformation effectively regularizes the local scales, in addition to providing the correct anisotropy for the boundary layer region. This allows the present method to compensate for the underlying stretching and coarsening that occurs in the far field of O-type meshes without the compounding costs of overresolving the near region.
Contour maps of streamwise (a) and cross-flow (b) velocity fluctuations in the near wake of the cylinder for 2D W-URANS simulations.

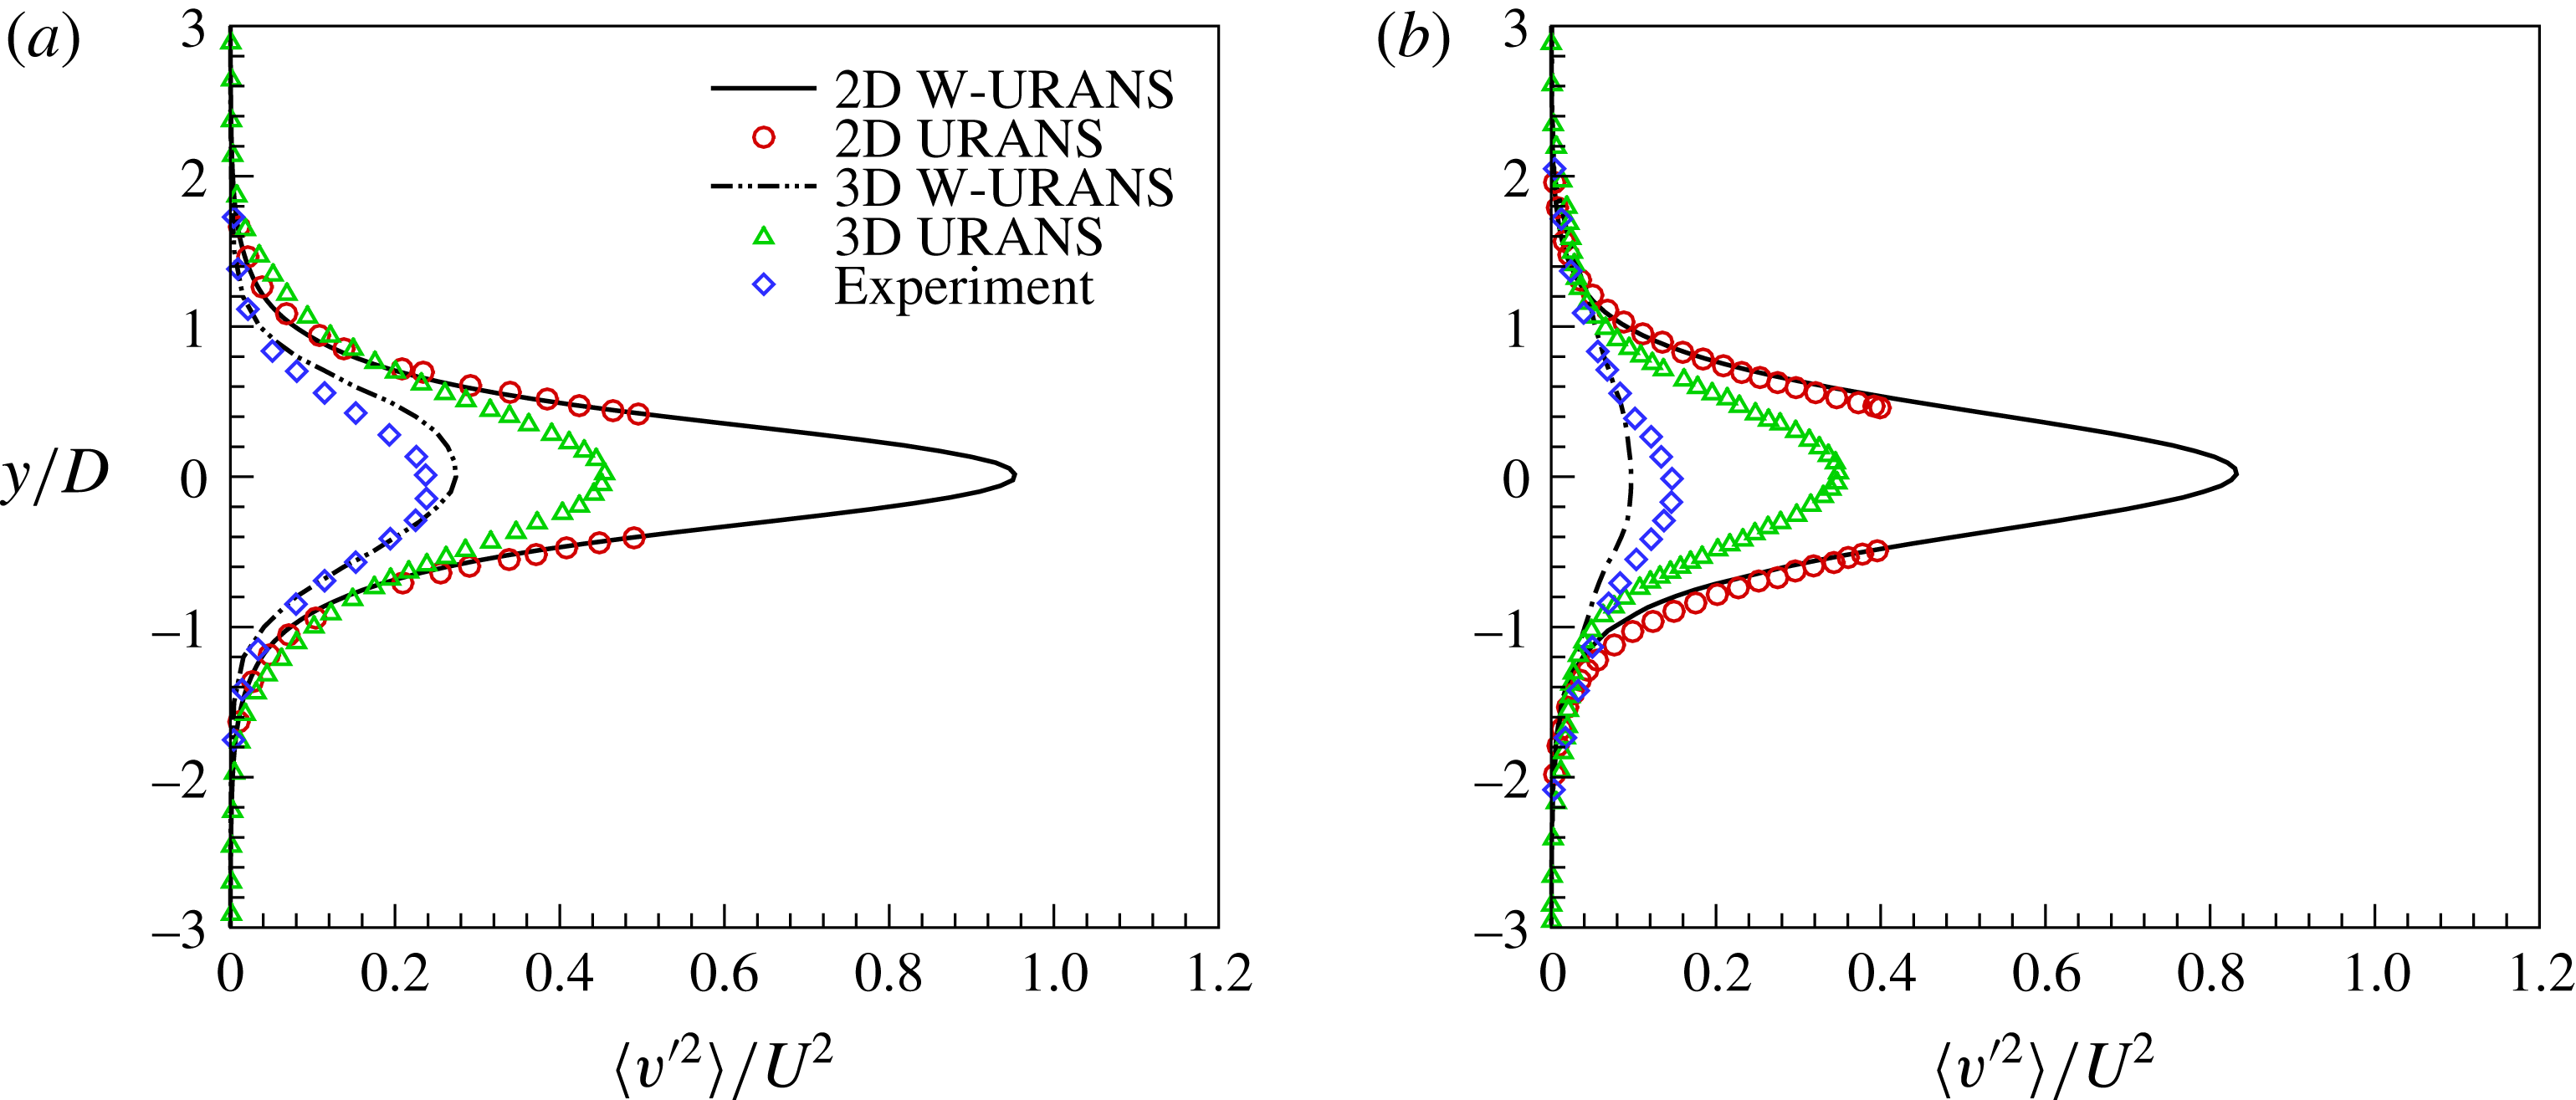
The contour maps of streamwise and cross-flow velocity fluctuations in the near wake of the cylinder for 2D W-URANS simulations are depicted in figure 8, with
 $\langle u^{\prime 2}\rangle /U^{2}$
and
 $\langle v^{\prime 2}\rangle /U^{2}$
being reported on the left and the right side, respectively. Owing to the subcritical nature of the present circular cylinder flow, the turbulence production is not due to the fluid–wall interaction as happens for turbulent boundary layers. Instead, the most important contribution to turbulence production is due to the flapping shear layers separating from the side of the cylinder and is associated with scales whose size is of the order of the shear layer thickness. Therefore, the spatial resolution constraint for wall-bounded turbulent flows can be partially relaxed and the present approach can be referred to as wall-resolved W-URANS.
The computational grid actually involves approximately 2 % of the total amount of available wavelets, including the wavelets belonging to the adjacent zone, and the grid compression remains very high, as typically happens for wavelet-based methods. It is worth noting that the computational cost of adaptive wavelet-collocation methods (either AWCM or A-AWCM) is the same, whether they are used to solve Navier–Stokes or RANS equations, because the underlying wavelet-based computational framework is the same. Typically, per point cost of adaptive simulations is 3–5 times more expensive with respect to non-adaptive simulations, which makes the adaptive method practically outperform the corresponding non-adaptive one when less than 20 % of grid points are retained in the calculation, e.g. De Stefano & Vasilyev (Reference De Stefano and Vasilyev2014).
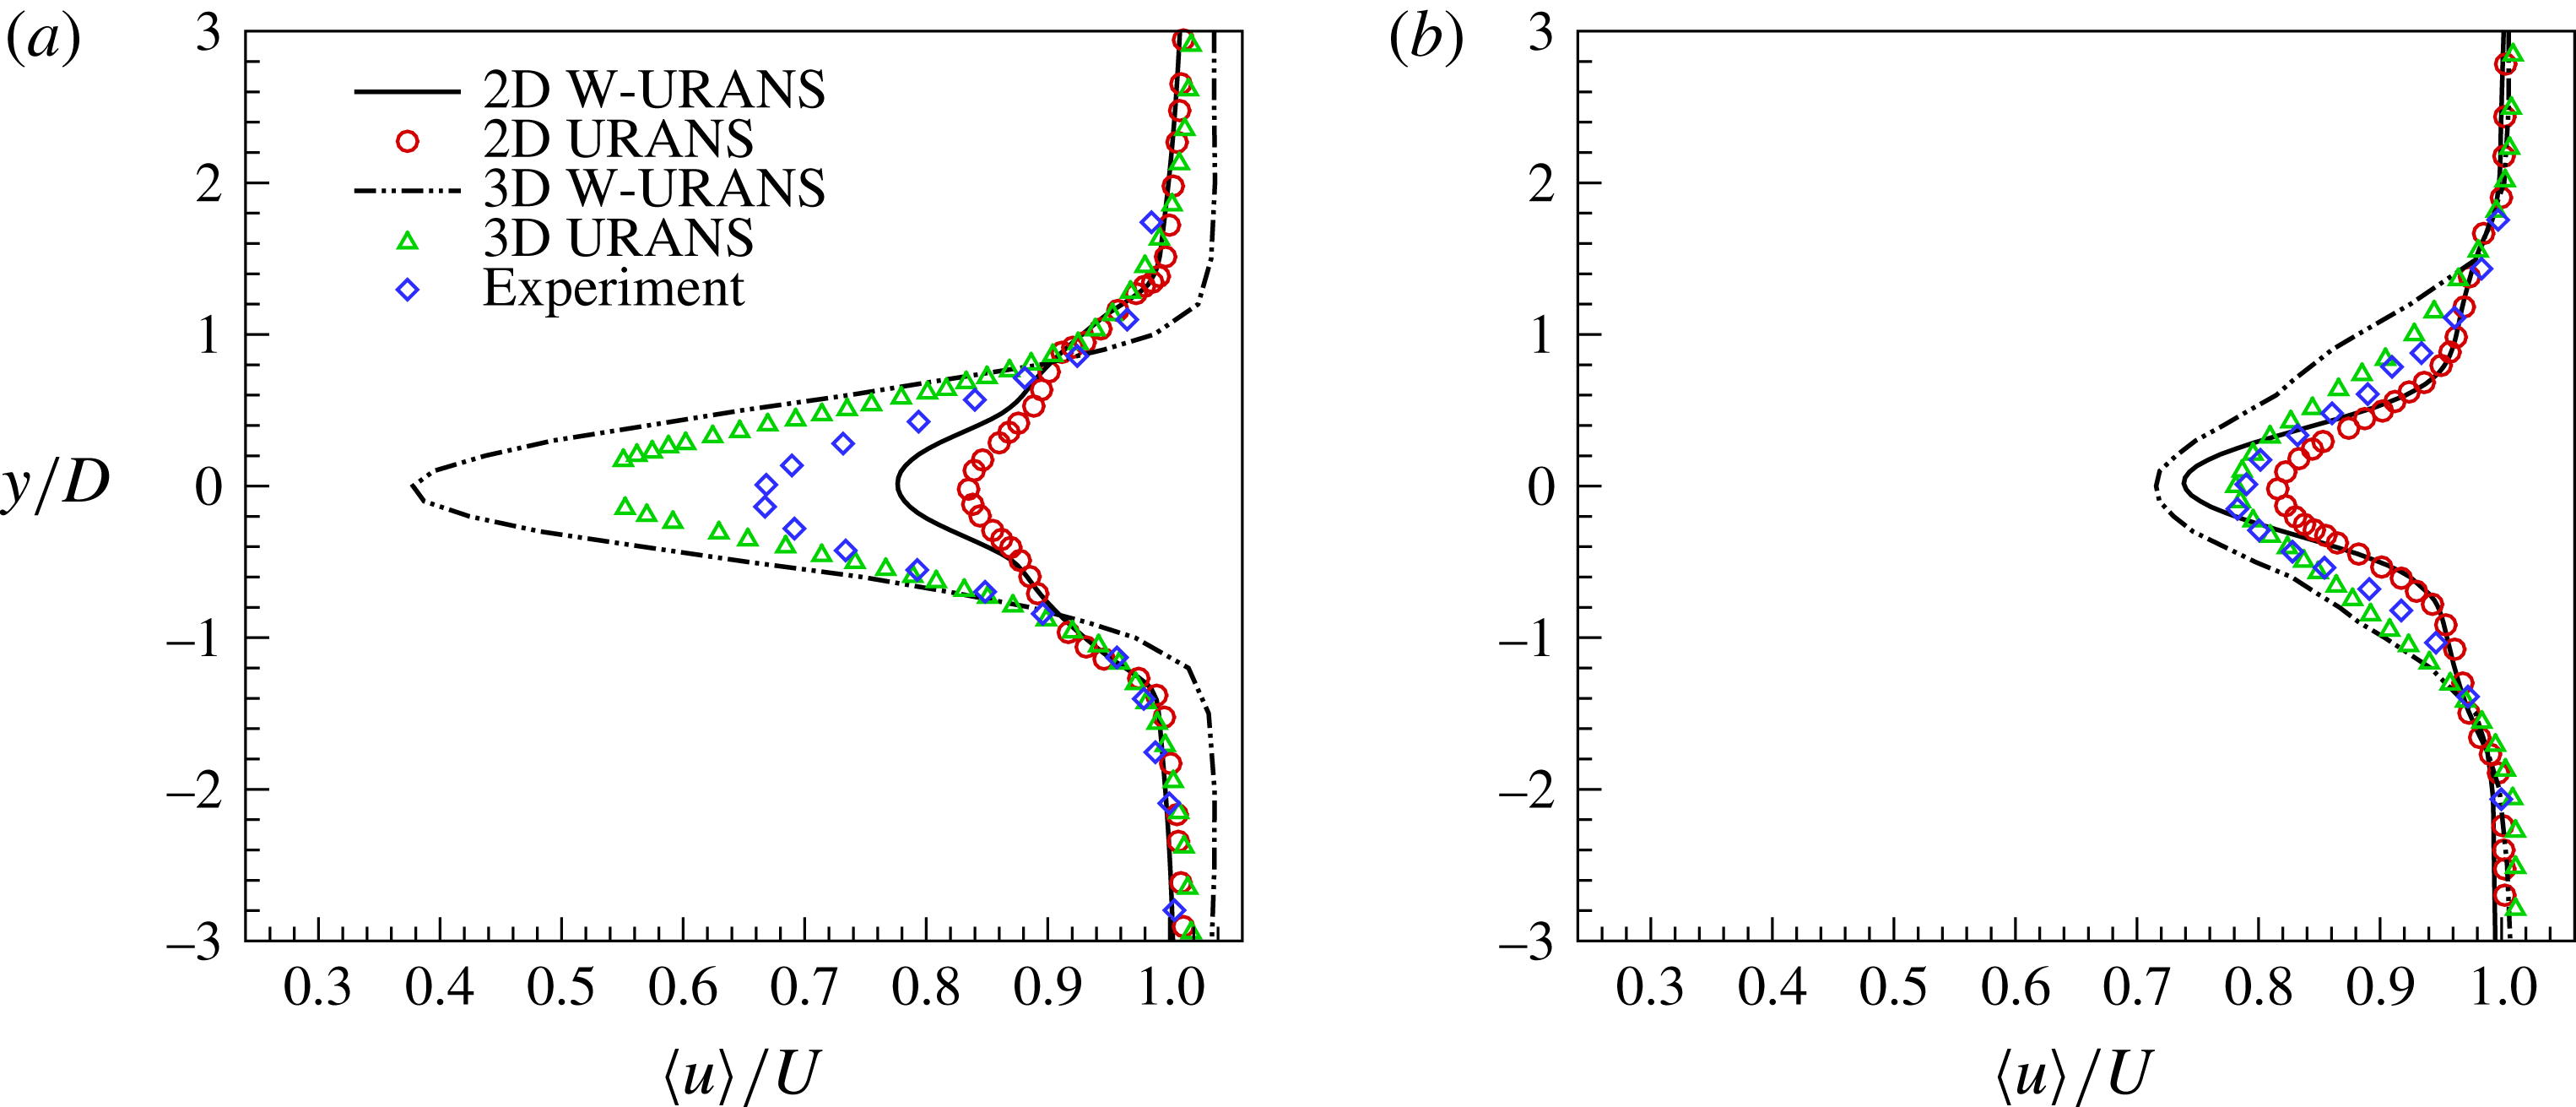
Profiles of mean streamwise velocity
 $\langle u\rangle /U$
at two different locations, which are
 $x/D=3$
(a) and 6 (b), in the near wake of the cylinder: W-URANS solutions (solid and dash-dot-dot lines) compared to URANS results in Young & Ooi (Reference Young and Ooi2007) (circles and triangles) and experiment of Ong & Wallace (Reference Ong and Wallace1996) (diamonds).

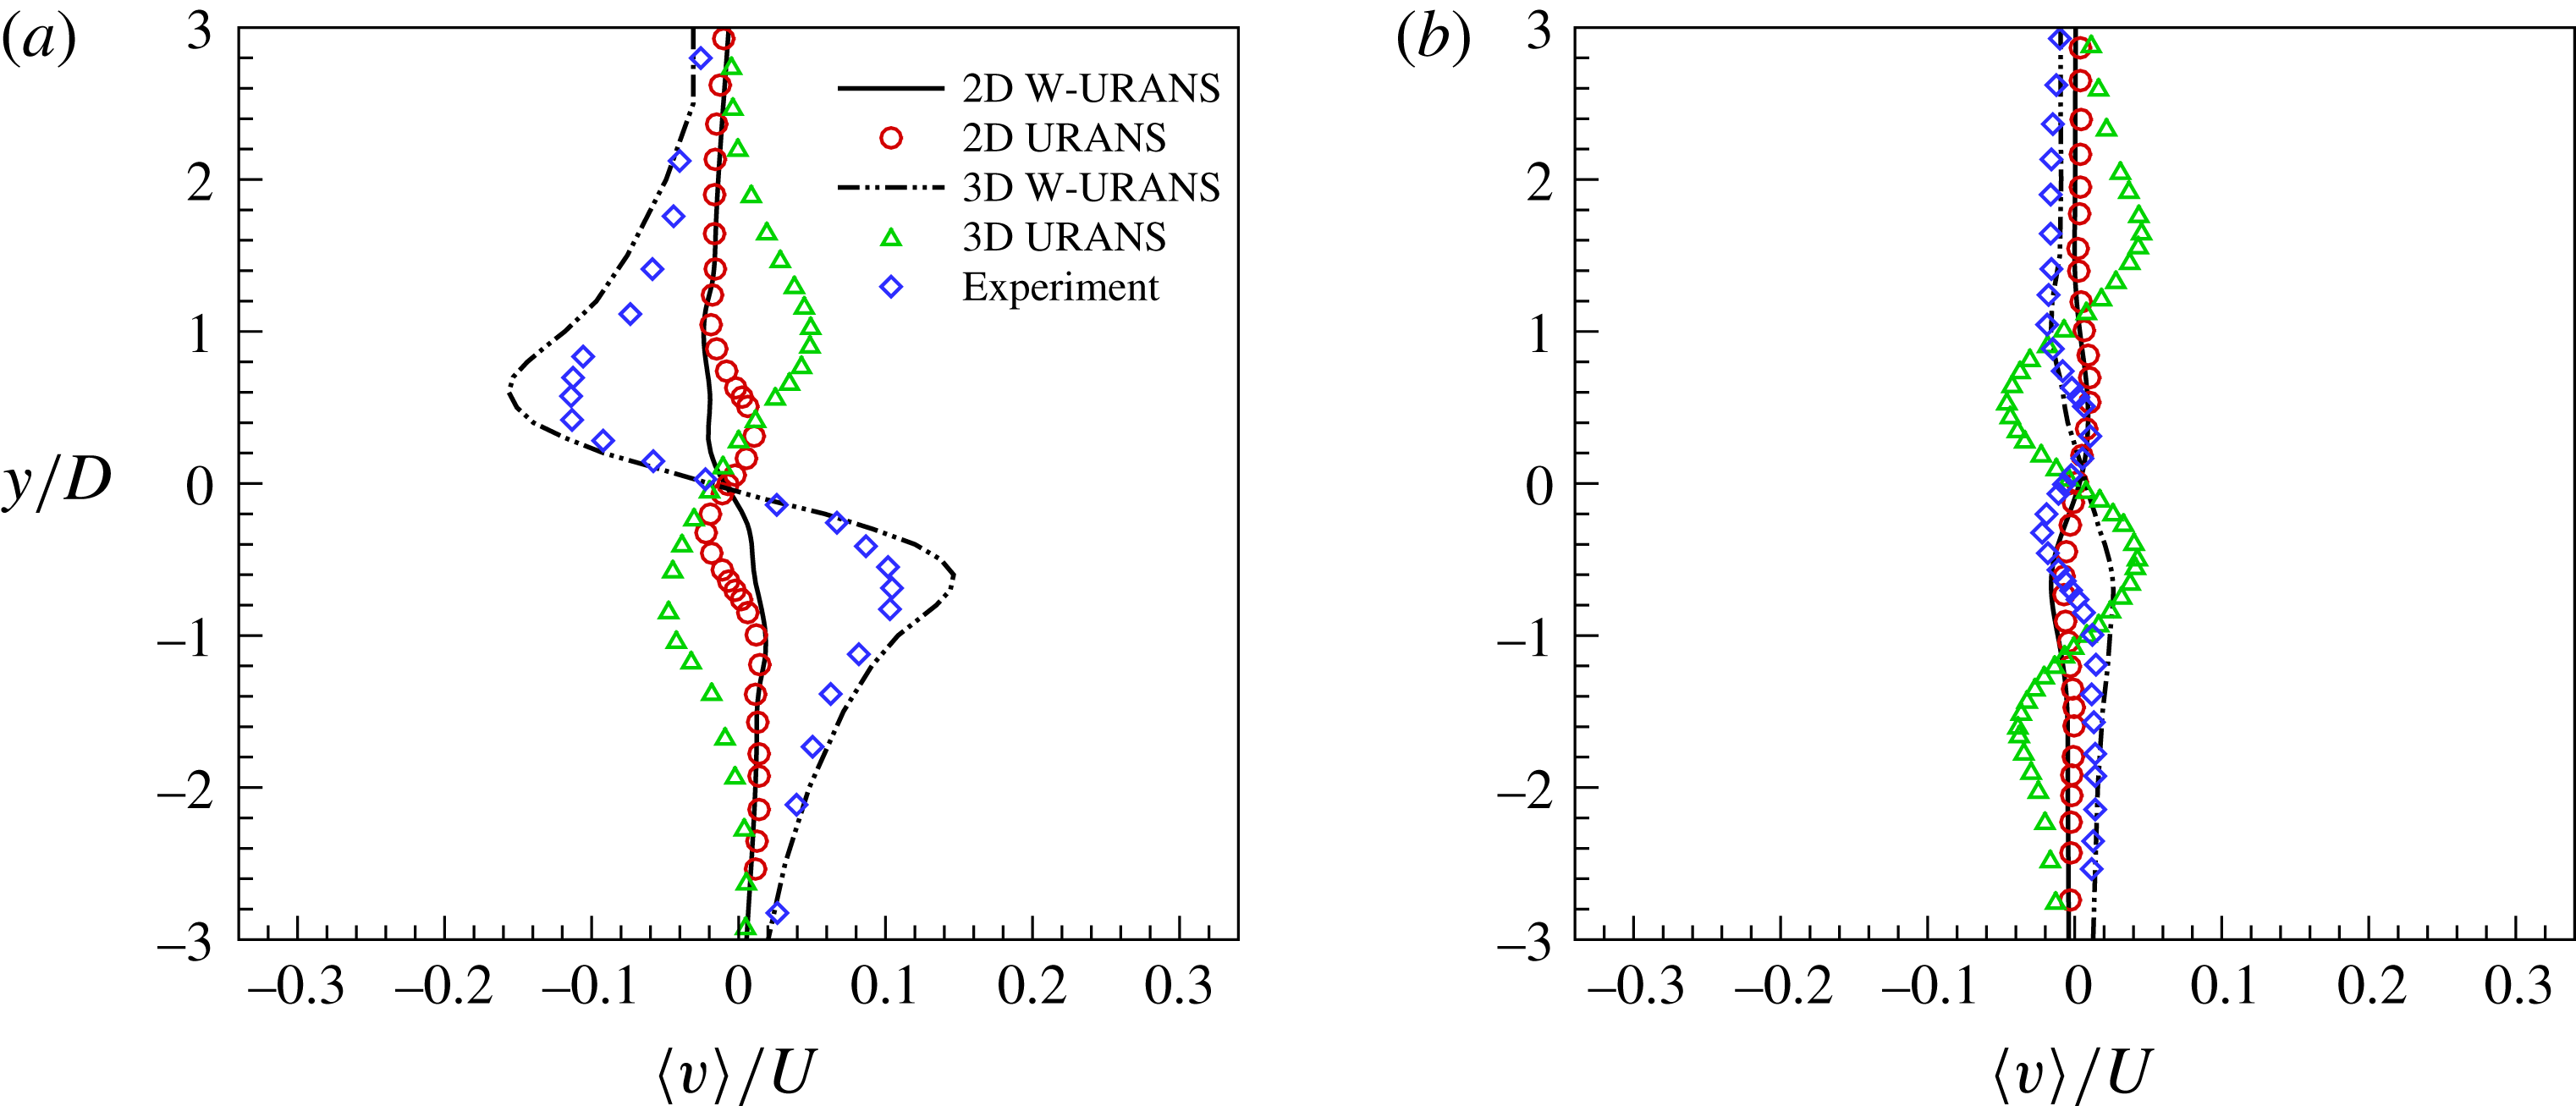
Profiles of mean cross-flow velocity
 $\langle v\rangle /U$
at two different locations, which are
 $x/D=3$
(a) and 6 (b), in the near wake of the cylinder: W-URANS solutions (solid and dash-dot-dot lines) compared to URANS results in Young & Ooi (Reference Young and Ooi2007) (circles and triangles) and experiment of Ong & Wallace (Reference Ong and Wallace1996) (diamonds).

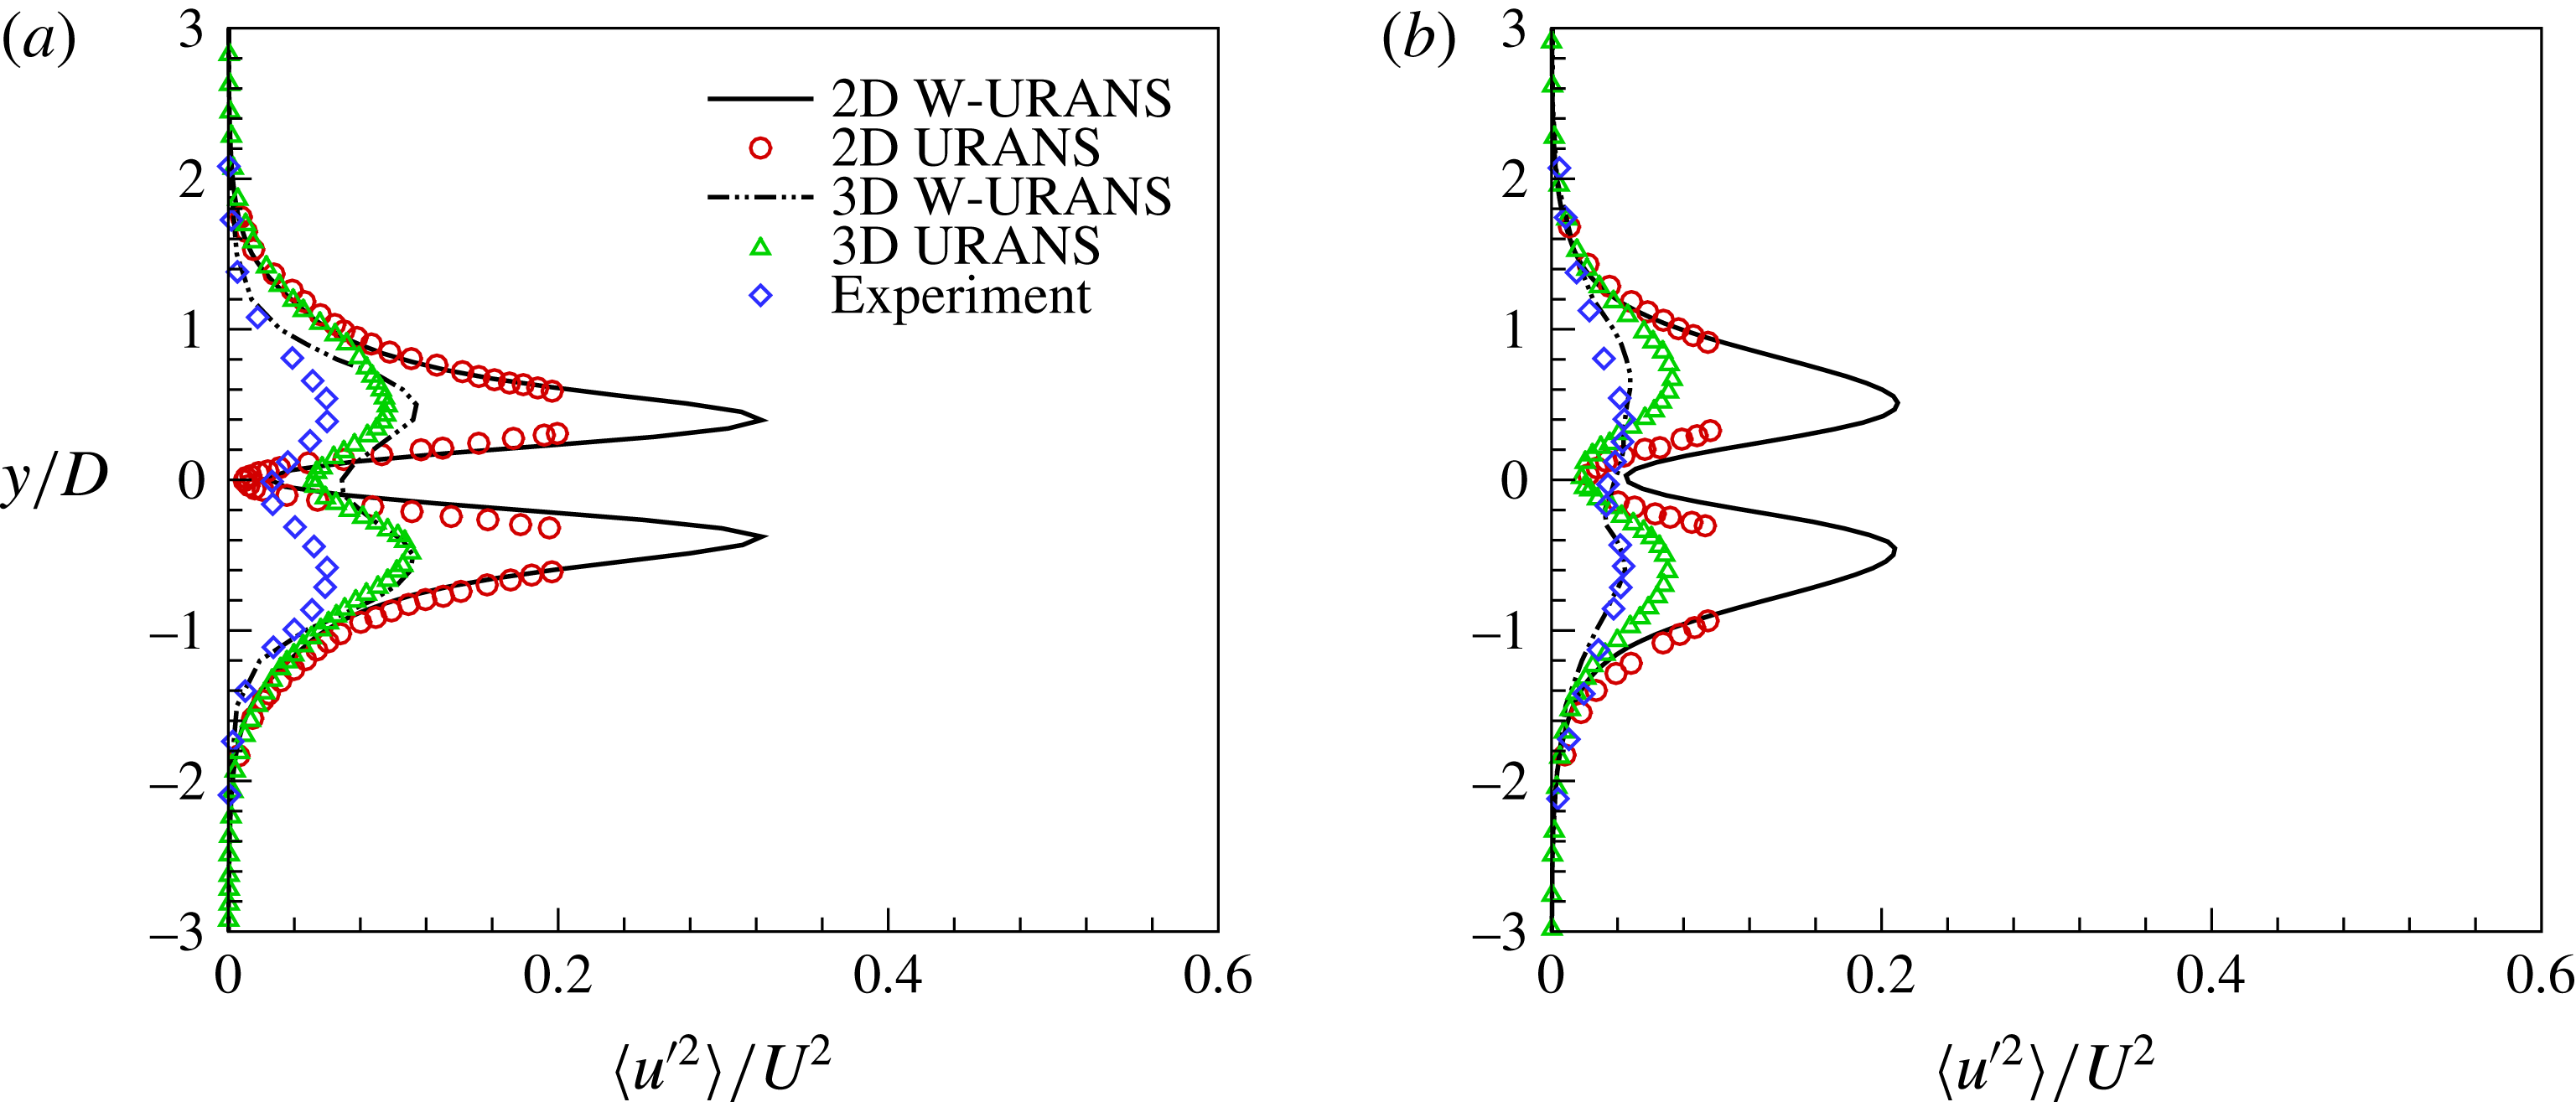
Profiles of streamwise velocity fluctuations
 $\langle u^{\prime 2}\rangle /U^{2}$
at two different locations, which are
 $x/D=3$
(a) and 6 (b), in the near wake of the cylinder: W-URANS solutions (solid and dash-dot-dot lines) compared to URANS results in Young & Ooi (Reference Young and Ooi2007) (circles and triangles) and experiment of Ong & Wallace (Reference Ong and Wallace1996) (diamonds).

Profiles of cross-flow velocity fluctuations
 $\langle v^{\prime 2}\rangle /U^{2}$
at two different locations, which are
 $x/D=3$
(a) and 6 (b), in the near wake of the cylinder: W-URANS solutions (solid and dash-dot-dot lines) compared to URANS results in Young & Ooi (Reference Young and Ooi2007) (circles and triangles) and experiment of Ong & Wallace (Reference Ong and Wallace1996) (diamonds).

Finally, in order to examine the turbulent wake mean flow statistics, the profiles of mean velocity and velocity fluctuations at two different positions in the near wake, which are
 $x/D=3$
and 6, are presented. The profiles of mean streamwise and cross-flow velocity components are shown in figures 9 and 10, respectively, while the profiles of corresponding fluctuations are reported in figures 11 and 12, respectively. The reference numerical data are provided by the URANS solutions in Young & Ooi (Reference Young and Ooi2007), whereas the experimental findings are those in Ong & Wallace (Reference Ong and Wallace1996). When looking at 2D results, the comparison with reference numerical data is quite successful. The W-URANS solution appears closer to the experimental data due to the adaptive nature of the wavelet-based approach. The turbulent fluctuations are however overestimated with respect to the experiments, which confirms the previous discussion about the inadequacy of two-dimensional simulations.
5.2 Three-dimensional simulation
In order to further assess the W-URANS method performance, a three-dimensional simulation of the circular cylinder flow at
 $Re=3900$
is carried out, where the third spatial direction is aligned with the cylinder axis. The curvilinear mapping discussed above is maintained in the cross-section plane (
 $x,y$
), while the identity map is prescribed in the spanwise direction (
 $z$
). The width of the physical domain, which plays an important role for cross-flow around a circular cylinder (Norberg Reference Norberg1994), is here prescribed so that
 $0\leqslant z/D<\unicode[STIX]{x03C0}$
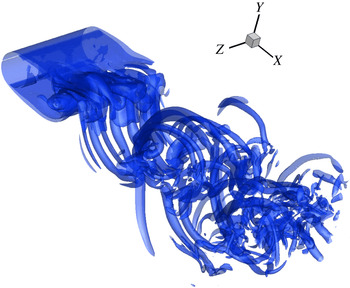
, following similar computational studies, e.g. Kravchenko & Moin (Reference Kravchenko and Moin2000), Young & Ooi (Reference Young and Ooi2007). Periodic boundary conditions are imposed in the homogeneous spanwise direction for all the resolved variables. To visualize the resolved three-dimensional turbulent wake, the isosurfaces of the instantaneous vorticity magnitude field at
 $5U/D$
are illustrated in figure 13, for
 $x/D<10$
.
Isosurfaces of the instantaneous vorticity magnitude field at
 $5U/D$
in the near wake (
 $x/D<10$
) of the cylinder.

When looking at the 3D results, the prediction of the average pressure distribution on the cylinder surface is highly improved with respect to the 2D simulations, as illustrated in figure 3. The proposed wavelet-based adaptive method appears to perform better than the reference non-adaptive approaches (Young & Ooi Reference Young and Ooi2007; Palkin et al.
Reference Palkin, Mullyadzhanov, Hadziabdić and Hanjalić2016). All the global flow parameters, reported in table 1, are indeed better estimated. As it results from the mean streamwise velocity profiles shown in figure 5, by making a comparison with the experiment of Lourenco and Shih reported in Kravchenko & Moin (Reference Kravchenko and Moin2000), differently from 3D URANS, the present 3D W-URANS is able to capture the minimum velocity in the near wake. The extension of the recirculation region is however not very well reproduced. Regarding the near-wake mean flow statistics, the difference in the mean streamwise velocity profiles, which are shown in figure 9, with respect to the experimental measurements is due to not fully converged statistics. The present results could also be affected by the length of the physical domain aft of the cylinder, which appears reduced when considering the wake region simulated in Young & Ooi (Reference Young and Ooi2007) that extended up to
 $x/D=25$
. Apparently, the mean cross-flow velocity profile is well predicted, as illustrated in figure 10. Even examining the profiles of streamwise and cross-flow velocity fluctuations reported in figures 11 and 12, respectively, differently from the classical non-adaptive URANS approach, where only minor improvement is achieved by considering 3D over 2D calculations, as also concluded by Young & Ooi (Reference Young and Ooi2007), the 3D W-URANS results show better agreement with experimental findings. However, the real meaning of the comparison of the present W-URANS solution with the non-adaptive URANS data deserves some clarification, as discussed in the following.
5.3 Discussion
It should be emphasized that, in contrast to steady RANS models that simulate the mean flow, URANS models not only reproduce large scale motions, typically associated with flow geometry variations and/or unsteady boundary conditions, but can also resolve relatively small scale structures. Indeed, intermittent three-dimensional small scale eddies can be captured by the URANS solution, similarly to what happens in the large-eddy simulation (LES) approach, e.g. Fröhlich & von Terzi (Reference Fröhlich and von Terzi2008), Menter & Egorov (Reference Menter and Egorov2010). Even though the resolution requirements for URANS are less severe than for LES, because the governing equations are more dissipative in nature, they remain considerably higher than for steady RANS. Therefore, practical computations benefit from the use of adaptive mesh refinement methods, if one truly wants to resolve all the scales theoretically present in the URANS solution in a computationally affordable way. This is exactly the essence of the adaptive W-URANS approach proposed in this work, where the important three-dimensional small scale vortical structures are effectively represented, as illustrated in figure 13.
In practical applications, the URANS equations are often solved using the same methods adopted for conventional steady RANS simulations that often rely on the use of highly dissipative numerical algorithms, which are implicitly embedded into the numerical solvers, enabling us to find stabilized solutions even on coarse meshes, e.g. Reina & De Stefano (Reference Reina and De Stefano2017). This way, the small scale eddies are completely filtered out and the URANS solution is dominated by numerical errors. For turbulent flow past bluff bodies, dissipative URANS models would typically reproduce only the main vortex shedding frequency. In contrast, in the present study, the governing equations are solved using the non-dissipative A-AWCM approach that is able to reproduce relatively small-eddy dynamics but requires considerably higher resolution than for classical non-adaptive URANS. This fact must be properly taken into account when making a fair comparison between the present results and the reference data.
Finally, the efficient resolution of the three-dimensional intermittent small scale structures on adaptive computational meshes not only improves the reliability of URANS simulations, but also paves the path towards a different turbulence modelling paradigm, where fully integrated computational methods and turbulence models complement and strengthen each other. With this perspective in mind, the proposed W-URANS approach can be viewed as a proof of concept that lays the foundation for the construction of mathematically consistent wavelet-based adaptive hybrid LES/URANS methods with adaptive mesh/anisotropy/model-form refinement and active communication between W-URANS and adaptive LES regions.
6 Concluding remarks
This paper introduces a new wavelet-based adaptive unsteady Reynolds-averaged Navier–Stokes approach for the simulation of wall-bounded turbulent flows. The proposed W-URANS modelling framework is demonstrated for a two-equation eddy-viscosity turbulence model. The computational modelling is integrated with the adaptive-anisotropic wavelet-collocation method for the more efficient numerical solution of the governing equations. In order to reveal the capabilities of the novel modelling approach, the present numerical experiments comprise baseline simulations of the compressible flow over a circular cylinder at a subcritical Reynolds number, where the physical geometry is enforced by means of an analytic curvilinear mapping.
The new approach is validated by comparison with reference non-adaptive URANS solutions as well as experiments. The existing difference between 2D simulations and experimental data is imputable to the inherent deficiency of two-dimensional calculations. When considering 3D simulations, the improvement in the numerical results is more evident for adaptive W-URANS with respect to classical URANS. This is due to the adaptive non-dissipative nature of the present method that makes it possible to reproduce relatively small scale structures. Following the work by Fröhlich & von Terzi (Reference Fröhlich and von Terzi2008), the proposed wavelet-based adaptive method can be referred to as a second generation URANS model.
It should be noted that the present study is intended to be the proof of concept of the proposed W-URANS approach. Prior to this work, the use of the AWCM for the simulation of high Reynolds number turbulent wall-bounded flows was quite questionable, since the number of required degrees of freedom did not satisfactorily scale with the flow Reynolds number. The new approach overcomes that difficulty and paves the path to W-URANS simulations of engineering turbulent flows at affordable costs. Even though the present W-URANS modelling procedure has its own range of applicability, in addition, it should be considered as the first step towards the construction of wavelet-based adaptive hybrid LES/URANS methods with adaptive mesh/anisotropy/model-form refinement, which is the ultimate goal of our ongoing research.
Acknowledgements
This work was supported by the Russian Science Foundation (Project 16-11-10350). This support is gratefully acknowledged. Authors are also thankful for the computing time on the Janus supercomputer, which was supported by the US National Science Foundation (award number CNS-0821794) and the University of Colorado Boulder. The Janus supercomputer was a joint effort of the University of Colorado Boulder, the University of Colorado Denver and the US National Center for Atmospheric Research.