1. Introduction
A dusty or complex plasma is a system consisting of electrons, ions, neutrals and charged microparticles (dust). When added to the plasma, the dust particles, which can range from tens of nanometres to a few micrometres in diameter, collect charge from the surrounding plasma. Once charged, the dust grains become a third charged component coupled to the background plasma. The presence of the dust alters existing plasma behaviour and creates new features unique to dusty plasmas; dust-driven wave modes like the dust acoustic wave (Barkan, Merlino & D'Angelo Reference Barkan, Merlino and D'Angelo1995), strongly coupled states like plasma crystals (Thomas et al. Reference Thomas, Morfill, Demmel, Goree, Feuerbacher and Möhlmann1994) and the appearance of dust voids (Goree et al. Reference Goree, Morfill, Tsytovich and Vladimirov1999). While the size and mass of the particles play a major role in determining the equilibrium properties of the dusty plasma, the dynamics of the particles are generally independent of the material properties of the dust. This means that dusty plasmas can be found in almost every regime of plasma physics – ice crystals in space plasmas (Horányi Reference Horányi2004; Morooka et al. Reference Morooka, Wahlund, Eriksson, Farrell, Gurnett, Kurth, Persoon, Shafiq, André and Holmberg2011; Shafiq et al. Reference Shafiq, Wahlund, Morooka, Kurth and Farrell2011), pieces of ablated chamber material in fusion devices (Winter Reference Winter2000; Brochard et al. Reference Brochard, Shalpegin, Bardin, Lunt, Rohde, Briançon, Pautasso, Vorpahl and Neu2016; Rubel et al. Reference Rubel, Widdowson, Grzonka, Fortuna-Zalesna, Moon, Petersson, Ashikawa, Asakura, Hamaguchi and Hatano2018), contaminants in industrial processing plasmas (Watanabe Reference Watanabe1997; Kersten et al. Reference Kersten, Wiese, Thieme, Hlich, Kopitov, Bojic, Scholze, Neumann, Quaas and Wulff2003; Shumova et al. Reference Shumova, Polyakov, Mataybaeva and Vasilyak2019), as well as a variety of other phenomena.
What sets dusty plasmas apart from other branches of plasma physics is the opportunity they provide for highly resolved, simultaneous and direct measurements of both particle and collective behaviour. Because of the extremely low charge-to-mass ratio of the dust, the dynamics in dusty plasmas occur on macroscopic time ($\sim$ s, ms) and length ($\sim$
 cm, mm) scales. When illuminated by a laser, dust behaviour can be observed using cameras with even a moderately high speed performance ($\sim$
 100 frames per second). Analysis techniques such as particle tracking velocimetry (known as PTV) or particle image velocimetry (known as PIV) (which are described in Lynch, Konopka & Thomas (Reference Lynch, Konopka and Thomas2016) and Thomas (Reference Thomas1999), respectively) allow for distribution functions of particle ensembles, density wave dispersions, and even kinematics of individual charged particles in the system to be reconstructed from direct observation instead of being inferred from instrument measurements (Fisher & Thomas Reference Fisher and Thomas2010). As a result, dusty plasmas have been used for studying statistical mechanics and soft-body dynamics on a macroscopic scale (Liu & Goree Reference Liu and Goree2008). Carefully designed experiments have utilized dust suspended in low-temperature plasmas (LTPs) to investigate phenomena ranging from phase transitions (Thomas & Morfill Reference Thomas and Morfill1996), to entropy fluctuation (Wong et al. Reference Wong, Goree, Haralson and Liu2017) to imposed ordered structures (Hall et al. Reference Hall, Thomas, Avinash, Merlino and Rosenberg2018).
However, despite the progress that has been made in improving our control over the equilibrium, dynamics and coupling behaviour of dusty plasmas, direct and independent control of the dust charge itself has remained a challenge. In order to expand our ability to study and control dust behaviour, we must not only develop models to estimate the equilibrium properties of the dust and the forces acting on the particles, but also techniques which can alter those properties independently of the plasma parameters. We believe that the key to developing such techniques lies in the exploitation of the charging behaviour of the dust; modulating existing charging currents from the plasma or introducing new current sources to the system in a way which mitigates the impact on the background plasma. This paper will review the charging process and discuss modifications to it as a preface for presenting the use of using photocurrents as a possible means for altering the dust charge in a controlled manner.
1.1. Charging
Understanding and accurately modelling the charge and charging process of dust grains in plasmas is critical to understanding the physics of dusty plasmas. The orbital motion-limited model (OML) is often the first approach used for estimating the dust charge from measurable quantities in the plasma. For dust suspended in an LTP we can assume, due to the higher mobility of electrons compared with ions, that the dust will have a net negative charge, $Q_d = - Z_d e$ where $Z_d$
 is the dust charge number. For spherical dust particles with a radius, $r_d$
 , and capacitance, $C_d = 4 {\rm \pi} \epsilon _o r_d$
 , the electrostatic potential at the surface of the dust particle is $\phi _d = Q_d/C_d$
 . We define a thermal speed for each species in the plasma, $v_{ts} = \sqrt {k_B T_s/m_s}$
 , and a thermal Mach number for each, $M_s = v_s / v_{ts}$
 . We also define a normalized charge, $z_s = |(q_s \phi _d) / (k_B T_s )|$
 . Under these definitions, we can derive simple expressions for the velocity-dependent collisional cross-sections of the ions and electrons with the dust particles using conservation of energy and angular momentum (Shukla & Mamun Reference Shukla and Mamun2002, pp. 38–39) as follows:


Assuming a Maxwellian velocity distribution for both the ions and electrons,

gives analytic expressions for the incident ion and electron currents


Applying a quasi-neutrality condition and defining the Havnes parameter, $P_H = Z_d n_d / n_i$ , the floating potential condition, $I_{ed} + I_{id} = 0$
 , is used to derive (Shukla & Mamun Reference Shukla and Mamun2002, pp. 50–51) the following equation:

Since $z_e$ , $z_i$
 and $P_H$
 , are all functions of $Z_d$
 , this expression can be solved numerically to obtain the dust charge number.
While recognizing that there are limitations to the OML charging model, it provides a useful means of estimating the dust charge, provided that knowledge of the basic plasma parameters (electron and ion temperatures and densities) are known. It also provides a basic analytic framework through which modifications to charging behaviour can be explored. The effects of gradients in plasma conditions or fluctuations in charging currents can be examined by allowing the plasma and dust properties to be functions of position or time. Modifications to plasma currents in non-Maxwellian systems like beams or background drifts can be derived by substituting new distribution functions into the integration with the cross-sections shown in (1.1) and (1.2). The effect of additional charging or discharging effects (like thermionic, photoelectric or secondary electron emission) can also be introduced by inserting them into the floating current condition:

1.2. Force balance
An alternate approach for estimating the charge of the dust grains is to consider the forces acting on them. When considering the dynamics of dust in a weakly ionized plasma there are, predominantly, four forces to consider – the gravitational and electrostatic forces on the grains, the neutral drag resisting the motion of the dust through the gas, and the interaction between positive ions and the negatively charged dust which we refer to as the ion drag. The gravitational and electrostatic forces are straightforward:


The gravitational force is trivial to estimate if the density, size and monodispersivity of the dust are known, but can be more challenging for polydisperse samples. The electrostatic force requires accurate potential measurements to determine the background electric field.
The effect of the neutral atoms on the dust can be modelled using the Epstein drag equation (Epstein Reference Epstein1924). For spherical dust with velocity, $v_d$ , moving through a stationary gas with mass $m_n$
 , temperature $T_n$
 , thermal velocity $v_{tn} = \sqrt {k_B T_n/m_n}$
 and a negligible background flow,

For negatively charged dust, the ion drag acts in opposition to the electrostatic force as ions are accelerated out along the electric field. A simplified model was introduced in Barnes et al. (Reference Barnes, Keller, Forster, O'Neill and Coultas1992) which breaks down the transfer of momentum into two components – a collision force produced by ions impacting the surface of the dust grain, and an orbital force produced by Coulomb collisions from scattered ions. Like the OML charging model, the Barnes ion drag model is appropriate for making a preliminary estimate of the drag effects on the dust, but also requires many assumptions and approximations.
Accurate modelling of the ion drag is still very much an open question in dusty plasmas due to the complexity of modelling the processes of momentum transfer between the ions and dust, and the difficulty in determining the upper and lower bounds to use for the integration of the cross-sections. Numerous improvements have been made on the Barnes model, with most relying on quasi-analytic solutions or results from numerical simulations. Most of these different treatments will generally produce expressions for the ion drag that are of similar orders of magnitude, so for the work described in this paper we will apply the model for the orbital force developed in Khrapak et al. (Reference Khrapak, Ivlev, Morfill and Thomas2002) and the collisional drag force developed in Uglov & Gnedovets (Reference Uglov and Gnedovets1991) and Hutchinson (Reference Hutchinson2003, Reference Hutchinson2004, Reference Hutchinson2006). A summary of both models can also be found in Hall & Thomas (Reference Hall and Thomas2016). In brief, for ions in a weakly ionized plasma with mobility, $\mu _i$ , we can define a drift velocity, $v_{Di} = \mu _i E$
 , and drift thermal Mach number, $M_{Di}=v_{Di} / v_{ti}$
 . For a shifted Maxwellian distribution and a more complete model of the momentum transfer, one can derive expressions for the components of the ion drag force, which can be written in the form


where $\ln {\varLambda }$ is the Coulomb logarithm, and $G$
 and $H$
 are unitless scale functions for the orbital and collisional fluxes (here, $F(x)$
 is the error function),


If we include the neutral and ion drag forces along with the particle's mass and acceleration then we can express the full force balance (FFB) as

which, like the charging model, can be solved numerically to estimate the equilibrium charge. In our analysis we will use three methods for estimating the dust charge – the classical OML charging model shown in (1.6), a simple force balance model (SFB) which considers only the gravitational and electrostatic forces from (1.8) and (1.9), and the FFB model shown above.
1.3. Photo-discharging
Photoelectric or photocurrents are generated when dust is illuminated by a light source with a photon energy, $E_p$ , which exceeds the work function, $W$
 , of the dust material and the electrostatic potential energy at the surface. For negatively charged dust, it can be assumed that all photoelectrons emitted at the surface will escape from the dust and be lost. For spherical dust with a photoelectron or quantum yield, $Y_p$
 , illuminated by a light source with intensity, $S_{p}$
 , and absorbed with efficiency, $Q_{ab} \sim 1$
 , the photo-discharging current can be estimated (Shukla & Mamun Reference Shukla and Mamun2002) as

Photocurrents are not a novel or unfamiliar feature in dusty plasmas; photocurrents represent the dominant charging process for the types of dusty plasmas found in the low plasma densities of interplanetary and interstellar space (Spitzer Reference Spitzer1941; Goertz Reference Goertz1989), and a few experiments (Sickafoose et al. Reference Sickafoose, Colwell, Horányi and Robertson2000) have observed evidence of photo-discharging under similar conditions. The use of photocurrents as a mechanism for deliberately controlling the dust charge in high pressure LTPs has been long proposed (Rosenberg, Mendis & Sheehan Reference Rosenberg, Mendis and Sheehan1996), but rarely pursued.
For the purposes of our research, photo-discharging represents an ideal tool for trying to control the dust charge: a discharging current which is introduced externally, is highly controllable, is largely independent of the plasma properties and can be introduced in a way which maximizes the impact on the dust while minimizing the impact on the surrounding plasma.
2. Experimental set-up
2.1. Basic apparatus
The dusty plasma experiment (DPX) device consists of two, electrically grounded, stainless steel, six-way ISO-100 crosses; one cross provides gas, vacuum and optical access, while the other contains the active experimental and diagnostic components (Thomas & Watson Reference Thomas and Watson1999). A roughing pump maintains a base pressure around 1 mTorr. Argon is introduced into the chamber through a mass flow controller (known as MFC) which holds the neutral pressure at 120 mTorr. The DC glow discharge argon plasmas are produced in the DPX device between a circular anode and a confining electrode. The anode is a solid aluminium disk 2.8 cm in diameter located approximately 3 cm above the geometric centre of the chamber. The top and sides of the anode are covered by a thin Delrin cap to help confine plasma production to the side facing the centre of the chamber. The anode is powered using a Glassman EH Series high voltage (HV) power supply operated in current-limited mode using a current of 2 mA at a discharge voltage that generally ranges from 220 to 230 V at this pressure. A confining electrode is used to create a potential well for trapping the dust and is formed from a copper gasket with an 8.3 cm outer diameter and a 6.4 cm inner diameter, located roughly 3 cm below the geometric centre of the chamber. The confining electrode is biased using an Instek GPR-30H10D laboratory power supply and was held at 0 V for this experiment. Approximately 0.5 cm below the confining electrode is a 7.6 cm diameter aluminium disk mounted in an 8.9 cm diameter Delrin mount. This disk serves as the dust tray and was left electrically floating in this experiment. A 0.5 cm hole in the middle of the dust tray allows a Langmuir probe to be inserted vertically through the centre of the chamber. The Langmuir probe is a tungsten cylindrical probe 0.3 mm thick and 7 mm long, insulated by an alumina tube. When the plasma is ignited, the dust particles become trapped between the two powered electrodes, with an unperturbed equilibrium position located near the geometric centre of the chamber. A schematic of the electrode arrangement is shown in figure 1, as well as a photograph of the interior of the vacuum chamber. The $x$ (horizontal) and $z$
 (vertical) axes lie in the plane of the image, and the $y$
 -axis follows the camera's line-of-sight looking into the chamber. The camera is level with the chamber, which is also level with the ground (gravitational acceleration is $-g\hat {z}$
 in this coordinate system). The origin is located at the geometric centre of the vacuum chamber and the white box indicates the ROI for the dust videos.
A simplified schematic of the experiment (a) showing placement of the anode, confining electrode, dust tray and probe. A photograph of the interior taken during probe measurements (b) shows the probe positioned near the centre of the chamber (the anode and confining electrode are just out of frame). The cross indicates the geometric centre of the chamber, the $x$ (horizontal) and $z$
 (vertical) axes lie in the image plane, and the $y$
 -axis follows the camera's line-of-sight looking into the chamber. The camera is level with the chamber (which is level with the ground) so gravitational acceleration is $-g\hat {z}$
 . The white box indicates the region of interest (ROI) for the dust videos, and is offset slightly from the geometric centre.

2.2. Optimization
The ‘proof-of-concept’ experiment discussed in this paper had two main objectives: (1) to determine if an ultraviolet (UV) source can produce a measurable discharge of dust in an LTP; and (2) to determine if this can be accomplished with a minimal perturbation to the background plasma. These objectives imposed two conditions for optimizing the design of the experiment. First, in order for the photo-discharging to have measurable effect on the dust equilibrium, the photocurrent must be comparable in magnitude to the incident plasma currents,

From the models for the currents in (1.4)–(1.16), that means that for a given set of plasma parameters we need to maximize both the intensity of our light source and the quantum yield of our dust material. Second, in order to minimize the effect on the background plasma we need to ensure that the light source is not generating photocurrents from other parts of the experiment (the chamber walls, the electrodes, the probes, etc.). So, the photon energy of the light source must be less than that of the work functions of the various parts of our apparatus, and that the work function of the dust material must, obviously, be less than the photon energy of our source,

For our light source, we settled on a Solis 365-C high-intensity LED microscopy source. The source emits at 365 nm (3.4 eV) with a 4.8 cm aperture, a typical collimated output power of 4 W and an irradiance of $\sim$ 2.8 kW m$^{-2}$
 at 20 cm. To increase the intensity even further, a UV-coated converging lens with a focal length of 25 cm was added in front of the source. Using a nearly collimated solid-state source allowed for higher intensities, faster response times, and more precise control than a discharge lamp (which typically have long warm-up and cool-down times, and variable intensities) would have been able to provide. The solid-state source also allows the UV output to be pulsed, enabling highly repeatable ‘shots’ whose effect on the plasma and dust could be analysed.
Conventional dust materials were rejected because of their relatively high work functions and generally poor quantum yields (Kimura Reference Kimura2016). Lanthanum hexaboride ($\textrm {LaB}_6$ ) was eventually selected for its low work function ($\sim$
 2.7 eV) (Torgasin et al. Reference Torgasin, Morita, Zen, Masuda, Katsurayama, Murata, Suphakul, Yamashita, Nogi and Kii2017); $\textrm {LaB}_6$
 also has a high electroemissivity and is regularly used as a base material for cathodes. This selection of material satisfied our optimization criteria, however, it also introduced a new obstacle. Whereas most conventional dust materials can be obtained in highly regular, highly monodisperse samples, $\textrm {LaB}_6$
 cannot. In order to produce usable samples for our experiment, raw $\textrm {LaB}_6$
 powder was filtered into a range of sizes using a Gilson GA-6 sonic sifter and a series of electroformed test sieves. The sample used in our ‘proof-of-concept’ experiment was to have a nominal range of 10–20 $\mathrm {\mu }$
 m. The samples were examined under a SEM and the cross-length, $L_d$
 , (which we define as the length of a randomly oriented line spanning the particle) was measured for several hundred dust grains. An image of the dust under the SEM and the histogram of cross-lengths can be seen in figure 2. The SEM results show that the particles filtered by the sonic sifter have an irregular, gravel-like appearance and are also highly polydisperse. The mean cross-length, $L_d$
 , of the particles was 10.77 $\mathrm {\mu }$
 m with a standard deviation of 5.42 $\mathrm {\mu }$
 m. The irregularity and polydispersivity of the dust are more thoroughly discussed in the discussion section.
(a) One of the $\textrm {LaB}_6$ samples filtered using the sonic sifter, as seen under the scanning electron microscope (SEM). The sieved grains have an irregular, gravel-like appearance and a high polydispersivity. (b) A histogram of particle cross-lengths, $L_d$
 , (lengths of randomly oriented lines spanning each particle) for the sample shown in the SEM image. The mean cross-length of the sample particles was 10.77 $\mathrm {\mu }$
 m with a standard deviation of 5.42 $\mathrm {\mu }$
 m.

2.3. Measurements and analysis
Because probes are inherently disruptive to dusty plasmas (Thomas, Avinash & Merlino Reference Thomas, Avinash and Merlino2004), the dust and plasma measurements are performed separately. The dust measurements are performed first, since achieving satisfying dust equilibrium requires the most fine-tuning and since the settings used can be readily duplicated for the dustless plasma environment. The dust is injected by arcing the confining ring (increasing the magnitude of the bias on the electrode until it begins to randomly discharge to the dust tray and other nearby conducting surfaces) in order to launch dust up into the plasma. The bias is then adjusted until a satisfying equilibrium is obtained.
A 532 nm laser that is passed through a cylindrical lens, which expands the beam into a vertical sheet, illuminates a two-dimensional cross-section of the dust cloud. A Ximea MQ042MG-CM camera, recording at 100 frames per second (f.p.s.) and oriented perpendicular to the laser sheet, records the particles and their response to the UV light. For each dust injection, a first measurement is made with the UV source off, in order to establish a baseline for the equilibrium behaviour of the cloud. A second measurement is then made with the UV source pulsing at maximum intensity at a frequency of 1 Hz with a 50 % duty cycle (0.5 s on, 0.5 s off). The recorded frames of the individual pulses can be summed to look for evidence of periodic responses in the dust to the UV pulses, and identify potential targets for particle tracking.
After the dust measurements are made, the chamber is thoroughly cleaned to remove any residual dust and the system is reassembled with a Langmuir probe inserted through the middle of the dust tray. The probe is a tungsten wire, insulated by an alumina rod, with an exposed tip 7 mm long and 0.3 mm in diameter. The probe can access the entire vertical gap between the anode and confining electrode. A Keithley 2400 Model SourceMeter is used to sweep the bias voltage on each probe tip and measure the collected current. The five sweeps are performed with and without the UV source activated, pulsed under the same conditions as the dust.
3. Experimental results
As indicated above, measurements are performed of both the dust and plasma response to the applied UV pulses. These measurements will show that the pulsed UV has a negligible impact on the plasma parameters, but has a definite and reproducible impact on the dust particles. These measurements will be used to make estimates of the dust grain charge as described in §§ 1.1 and 1.2.
3.1. Probe measurements
A simple cylindrical Langmuir probe inserted vertically through the centre of the chamber, measured plasma parameters vertically (with some deviation in the horizontal direction). The total two-dimensional region accessed by the probe within the same plane illuminated by the laser in the dust experiments spans $\sim$ 0.5 cm across and $\sim$
 6 cm high, approximately centred at the geometric centre of the chamber.
Since the positions accessible by the probe are limited, we cannot measure the plasma parameters at the precise equilibrium positions of every dust particle in our experiment; empirical models fitted to our data for the floating potential, ion density and electron temperature are used to estimate the charge using the methods previously described. Figure 3 shows the projections of the probe measurements onto the vertical axis. These projections indicate that the systematic variation in the structure in all three plasma parameters is predominantly oriented in the vertical direction, and that any systematic variation along the horizontal direction (at least in the region we could measure) is negligible in comparison. Therefore, for the purposes of our analysis, the three parameters are modelled as functions of the vertical position. The light blue lines in the vertical position plots in figure 3 show the functional floating potential, ion density and electron temperature with and without the UV pulse.
Vertical ($z$ axis) projections of the Langmuir probe measurements of floating potential (a), ion density (b) and electron temperature (c) with and without the UV source on. The origin corresponds to the approximate geometric centre of the chamber and the thick black lines indicate the typical vertical extent of dust clouds formed during our experiments. The light blue lines show the fitted functions used for modelling the properties as functions of vertical position.

3.2. Dust response
In the absence of the UV pulse we can characterize the equilibrium conditions of the dust cloud when injected into the plasma. The exact size and shape of the clouds varied from one injection to another, but generally the dust clouds took on an elliptical or triangular shape 0.5–1.0 cm across, with densities around $10^9\ \textrm {m}^{-3}$ and a bottom edge located at or slightly below the centre of the chamber. Isolated particles could also often be found below or beside the main cloud.
Figure 4 shows the behaviour of the dust with and without the UV source. Both images are a sum of 100 frames (1 s) of video; the image in figure 4(a) shows the cloud without the UV, while the image in figure 4(b) shows the same cloud with the UV source pulsing at 1 Hz (0.5 s on, 0.5 s off). The dynamics of the individual dust particles can be broken down into three broad, qualitatively distinguishable types of behaviour: small, random motion about an equilibrium point in the absence of the UV pulse is classified as type I; large, random motion in response to the UV pulse is classified as type II; large, quasi-periodic motion in response to a UV pulse is classified as type III. Figure 5 shows displacement data for examples of type I, type II and type III motion taken from various dust injection trials. Whether a particle's behaviour in response to the UV more closely resembles type II or type III motion (or falls somewhere in between) appears to be highly sensitive to the magnitude of the type I behaviour the particle exhibits in the absence of the UV. The qualitative and quantitative analysis of this relationship will likely be the subject of a future paper, but will not be considered for the purposes of this ‘proof-of-concept’ experiment.
A dust cloud without the UV (a) and with the UV (b), pulsing at 1 Hz with a 50 % duty cycle (0.5 s on, 0.5 s off). Each image is a sum of 100 frames (1 s) of video. The dust response can be broken into three broad, qualitatively distinct categories: small, random displacement in the absence of the UV (type I), large, random displacement in response to the UV (type II) and large, quasi-periodic displacement in response to the UV pulse (type III).

Examples of particle displacement (change from initial position) for type I (a), type II (b) and type III motion (c). Each figure shows the particle's horizontal and vertical displacement over the course of 100 frames (1 s) of video. Type I motion is characterized by small, random displacements in the absence of the UV. The inset in panel (a) shows the type I motion magnified and emphasizes the ordinarily small magnitude of this type of motion. Type II motion is characterized by large, random displacements in response to the UV. Type III motion is characterized by quasi-periodic displacements in response to the UV pulse.

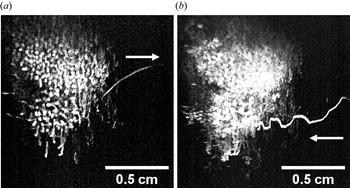
The magnitude of the dust's response to the UV (both type II and type III motion) appears to be intensity dependent; the lower the UV intensity, the lower the magnitude of both the random and quasi-periodic dust motion. The horizontal motion of the particles appears to be independent to the direction of the UV light. Particles in multiple trials were seen moving towards the source, away from the source, normal to the source, etc. In one particularly peculiar trial (see figure 6), when the UV pulse was turned on a particle was ejected from the right-hand side of the cloud (travelling away from the UV source) and then a few moments later another particle (or quite possibly the same particle) was seen re-entering from the right-hand side (travelling towards the UV source) while simultaneously exhibiting drops in vertical equilibrium consistent with type III motion. This suggests that any horizontal particle motion observed is likely due to indirect effects such as motion dictated by plasma gradients or interactions with neighbouring particles, rather than an induced radiation pressure force from the UV.
A particularly striking example of the dust's response to the UV. A particle is ejected from the cloud (a) and travels away from the UV source (0.3 s elapsed). A moment later (0.4 s), another particle (or possibly the same particle) re-enters the cloud (b) travelling towards the UV source while exhibiting drops in vertical position in sync with the UV pulse (3.7 s elapsed). This example clearly illustrates the dust's response to the UV, and because the particles do not exhibit any preference for moving away from the UV source when it is active, radiation pressure can be eliminated as an explanation for the effect.

There is also motion in and out of the plane illuminated by the laser. Since the plane itself is only a few millimetres thick, particles that are displaced enough will ‘appear’ in or ‘disappear’ from the image. This can complicate particle tracking over long periods (especially particles exhibiting type II motion), as there is little to conclusively determine whether a particle that leaves the plane at one position is the same particle that re-enters the plane at another.
For the purposes of our ‘proof-of-concept’ experiment, an ‘ideal’ example was selected for analysis; a dust particle which remained within the plane illuminated by the laser for the entire duration of two recording sessions (with and without the UV). Figure 7 shows the particle's behaviour with and without the UV. Without the UV, the test particle exhibited minimal type I motion for $\sim$ 20 s. With the UV, the test particle followed a nearly identical, cyclical path in response to the pulse (type III motion) for another $\sim$
 20 s. This meant we could overlap the results of many pulses in order to determine an average position, velocity and acceleration of the particle over the course of the pulse, as demonstrated in figure 8.
The ‘ideal’ test particle selected for our analysis (circled). When the UV pulse is off (a), the particle exhibits type I behaviour. When the pulse is turned on (b), the test particle exhibits type III behaviour. Each image is a sum of $\sim$ 2000 frames ($\sim$
 20 s of video). The top-right inset in each image shows the particle's motion magnified.

The test particle's horizontal and vertical position over time. The $\sim$ 20 s worth of data from each video is divided into 1 s segments and superimposed to illustrate the periodicity (or lack thereof) of the dust's motion with (w/) and without (w/o) the UV. Without the UV (a), the particle exhibits only some minor fluctuation in the horizontal direction (likely the result of interactions with neighbouring particles). With the UV (b), the particle exhibits quasi-periodic (type III) motion in sync with the pulse (0.5 s on, 0.5 s off).

4. Discussion and summary
Our ‘proof-of-concept’ experiment had two main objectives: the first was to determine whether a UV source could produce a measurable discharge of dust in an LTP. The second was to determine whether this could be accomplished with a minimal perturbation to the background plasma.
4.1. Minimal plasma perturbations
Figure 9 shows the results for each plasma parameter with the 1 Hz UV pulses on, plotted against the results with the source off. The results are highly correlated, with coefficients of $r = 0.9997$ for the floating potential, $r = 0.9999$
 for the ion density and $r = 0.9716$
 for the electron temperature. We can also characterize the relative change between the results with the UV, compared with without the UV, defining $\delta _f=\Delta f/f_o$
 , for the floating potential ($\delta _V$
 ), ion density ($\delta _n$
 ) and electron temperature ($\delta _T$
 ). The average relative changes were $\delta _V = 0.16$
 %, $\delta _n = 1.57$
 %, $\delta _T = 1.32$
 %. Based on these measurements, we conclude that the pulsed UV has a minimal effect to the background plasma.
Comparison of the floating potential (a), ion density (b) and electron temperature (c) with and without the UV. The results are highly correlated; the average relative difference was ${<}2\,\%$ for ion density and electron temperature, and ${<}0.2\,\%$
 for floating potential. The light blue line shows where the measurements would fall if the results were exactly equal.

While the results above are promising, we also made measurements to determine the effects, if any, of prolonged, constant exposure to the UV on the background plasma. Figure 10 shows the relative change in the ion current, $\delta _I$ , as measured by the Langmuir probe, positioned at the centre of the chamber and held at a particular bias voltage while exposed to constant UV. The black lines indicate the UV source being turned on and off. The response is similarly small compared with the pulsed UV results, appears to saturate after several minutes of exposure, and dissipates quickly once the UV is turned off. It is unclear at this time whether this effect is an actual change in plasma conditions or some kind of charging effect on the probe related to the UV exposure. However, it should be noted that no measurable current was detected by the probe when exposed to UV in a vacuum, so we are confident that this is not a photoelectric current on the probe itself.
Relative difference in ion current, $\delta _I$ , measured by the Langmuir probe at a fixed bias voltage in response to long-term constant UV exposure. The black lines indicate when the UV source was turned on and turned off. Even with constant UV exposure for over several minutes, the probe measured a ${<}2\,\%$
 change in the collected current.

4.2. Determining dust discharge
The polydispertivity of the dust proved a significant challenge to the effort to estimate the dust charge. While we were able to statistically estimate a characteristic cross-length and standard deviation for the particle size in the sample (see figure 2), it is not possible to know the exact shape and size of the particles that are suspended in the plasma. For this reason we confine the analysis in this paper to the relative discharge of the dust, ${\delta }_{Q}$ , since (to zeroth order, at least) the ratio is only weakly dependent on the particle size in all three models and error analysis is overwhelmingly dominated by the uncertainty in the particle's average position (see figure 8) rather than by its size.
The particle is treated as spherical so that we can utilize the models outlined in §§ 1.1 and 1.2. The effective radius of the particle is estimated as half of the mean cross-length of the particles, $r_0 = L_d/2$ , as determined from the measurements in figure 2. Using this radius with the OML charging model yields a numerically estimated initial charge, $Z_0\sim 16900\pm 8500$
 (which illustrates the large aforementioned uncertainty in estimating absolute charge which results from the wide size dispersion of the particles).
With the results we obtained for the response of the dust's position over time (again, see figure 8) to the UV source, combined with our probe measurements for the floating potential (from which we can estimate the electric field), ion density and electron temperature (see figure 3), we can estimate how the dust charge of our ideal test particle responds to the UV pulse. Figure 11 shows the relative change in charge, ${\delta }_{Q}$ , as a function of time using the different methods discussed in the introduction: the classical OML charging model from (1.6), the SFB between the gravitational (1.8) and electrostatic (1.9) forces, and the FFB from (1.15), which incorporates the neutral and ion drag. The different methods produced different discharge estimates, with the OML model indicating a $\sim$
 2 % discharge, the SFB model $\sim$
 48 % and the FFB model $\sim$
 28 % of the initial charge.
The relative change in charge, $\delta _Q$ , over the period of each pulse using several different methods. The different methods produced different discharge estimates (OML $\sim$
 2 %, SFB $\sim$
 48 % and FFB $\sim$
 28 %). Note the asymmetry in the discharging and recharging portions of the plot, reinforcing the conclusion that an additional process is present in the former.

We believe that the OML model underestimates the discharging effect; at these plasma densities the particle charge from the OML model is determined primarily by the electron temperature, which remains relatively constant across the region where the test particle moves (see figure 3). We also believe the SFB model overestimates the discharging effect, as it only takes the change in electric field at the particle's position into account. For these reasons, the OML and SFB models can be regarded as the extreme upper and lower bounds, respectively, of the discharging effect. The more complete FFB model is probably the most physically relevant of the three estimates, even though it has the largest relative error.
In this paper we have proposed a proof-of-concept experiment for demonstrating controlled photo-discharging of dust particles suspended in a plasma. We have explained how careful selection of a UV source and dust material may allow for such an effect to not only be demonstrated in a high pressure, LTP environment, but do so with an only marginal impact on the background plasma. We have built and performed the proposed experiment and confirmed that this can be done; high-intensity, near-UV light can produce a significant change in the behaviour of $\textrm {LaB}_6$ particles, the qualitatively and quantitatively consistent with a large photoelectric discharge of the particles, and the UV has a negligible effect on the plasma. It is our hope that this result will lead to future applications in research and industry; the relatively simply set-up and requirements make the apparatus ideal for incorporating into existing experiments (for example, studying the effects of photo-discharging in a microgravity environment or a wave experiment), and more specialized sources or optics could allow the discharging to be used for higher work function dust materials.
Acknowledgements
I would also like to thank my family and friends for their support, Dr. U. Konopka for his helpful consultation, and the invaluable assistance of MPRL's technician, D. Artis.
Editor William Dorland thanks the referees for their advice in evaluating this article.
Funding
This work was supported by the National Science Foundation EPSCoR program (grant number OIA-1655280); and by the US Department of Energy (grant number DE-SC0019176).
Declaration of interests
The authors report no conflict of interest.