INTRODUCTION
Radiocarbon (14C) is one of the most important cosmogenic radionuclides for building reliable chronologies for various materials and archives for the study of environmental and climatic changes over the past 50 ka. 14C is also employed as a powerful tracer of the carbon cycle and climatic systems. In particular, 14C in carbonate archives (e.g., marine carbonates and speleothems) is used for the study of ocean circulation and its temporal variations (Druffel Reference Druffel1997; Hua et al. Reference Hua, Woodroffe, Smithers, Barbetti and Fink2005, Reference Hua, Webb, Zhao, Nothdurft, Lybolt, Price and Opdyke2015; Grottoli and Eakin Reference Grottoli and Eakin2006; Yu et al. Reference Yu, Hua, Zhao, Hodge, Fink and Barbetti2010), soil-to-speleothem carbon transfer dynamics through the cave system (Genty and Massault, Reference Genty and Massault1999; Fohlmeister et al. Reference Fohlmeister, Kromer and Mangini2011; Noronha et al. Reference Noronha, Johnson, Southon, Hu, Ruan and McCabe-Glynn2015; Bajo et al. Reference Bajo, Borsato, Drysdale, Hua, Frisia, Zanchetta, Hellstrom and Woodhead2017), and past climatic and environmental changes (Guilderson and Schrag Reference Guilderson and Schrag1998; Bondevik et al. Reference Bondevik, Mangerud, Birks, Gulliksen and Reimer2006; Griffiths et al. Reference Griffiths, Fohlmeister, Drysdale, Hua, Johnson, Hellstrom, Gagan and Zhao2012; Lechleitner et al. Reference Lechleitner, Baldini, Breitenbach, Fohlmeister, McIntyre, Goswami, Jamieson, van der Voort, Prufer, Marwan, Culleton, Kennett, Asmerom, Polyak and Eglinton2016; Hua et al. Reference Hua, Cook, Fohlmeister, Penny, Bishop and Buckman2017). However, the standard high-precision 14C analysis (∼0.3% precision) by accelerator mass spectrometry (AMS) is time-consuming and costly. The full process requires a number of steps in sample preparation including sample pre-treatment, CO2 conversion (hydrolysis) and graphitization, and finally reasonable time for AMS measurement.
Recently, there have been a few publications on direct carbonate measurement by AMS 14C, which offers much lower analytical cost albeit with lower precision of ∼1–2% (Bush et al. Reference Bush, Santos, Xu, Southon, Hines and Adkins2013; Longworth et al. Reference Longworth, Robinson, Roberts, Beaupre, Burke and Jenkins2013; Welte et al. Reference Welte, Wacker, Hattendorf, Christl, Fohlmeister, Breitenbach, Robinson, Andrews, Freiwald, Farmer, Yeman, Synal and Günther2016). The methods applied in these papers require only minimal effort in sample preparation and less time of AMS measurement, allowing quick and inexpensive analysis of many more samples within a given project budget for a number of different purposes. They include survey of deep-sea coral ages for their population dynamics and past bio-geography (Longworth et al. Reference Longworth, Robinson, Roberts, Beaupre, Burke and Jenkins2013), age distribution of fossil corals collected at a study site (McGregor et al. Reference McGregor, Hellstrom, Fink, Hua and Woodroffe2011; Bush et al. Reference Bush, Santos, Xu, Southon, Hines and Adkins2013; Grothe et al. Reference Grothe, Cobb, Bush, Cheng, Santos, Southon, Edwards, Deocampo and Sayani2016), high-resolution and continuous records of young-speleothem 14C (Welte et al. Reference Welte, Wacker, Hattendorf, Christl, Fohlmeister, Breitenbach, Robinson, Andrews, Freiwald, Farmer, Yeman, Synal and Günther2016) and 14C-based calibration of amino acid racemization (AAR) ages (Domignuez et al. Reference Dominguez, Kosnik, Allen, Hua, Jacob, Kaufman and Whitacre2016; Kosnik et al. Reference Kosnik, Hua, Kaufman, Kowalewski and Whitacre2017).
In this paper, we present our investigation on the possibility of direct AMS 14C measurement of carbonate samples at ANSTO using the STAR 2 MV tandem accelerator from High Voltage Engineering (HVE) and its 846 Cs sputtering ion source. Applications of calibration of AAR ages and quantifying time-averaging of fossil assemblages using direct AMS 14C carbonate data are also presented.
MATERIALS AND METHODS
Since calcium carbonate is not conductive, we mixed it with various metal powders to ensure the normal behavior of the sputtering source. Three metal powders currently available in our laboratory were used in the investigation, including iron (Fe, Cerac, -325 mesh, 99.9% purity), niobium (Nb, ESPI, -325 mesh, 99.5% purity) and silver (Ag, ESPI, -325 mesh, 99.9999% purity). These metals were chosen because Fe is employed in our graphite targets, while mixing Nb or Ag powder with our oxide targets for actinide and 10Be analyses improve conductivity and beam currents (Fink et al. Reference Fink, McKelvey, Hannan and Newsome2000; Child et al. Reference Child, Hotchkis, Whittle and Zorko2010; D. Child (personal communication)). Carbonate reference materials used in the study include IAEA-C1 Carrara marble free of 14C and IAEA-C2 travertine of 41.14 pMC (Rozanski et al. Reference Rozanski, Stichler, Gonfiantini, Scott, Beukens, Kromer and van der Plicht1992). As there are currently no carbonate reference materials younger than IAEA-C2, known-age bivalve shells from Sydney Harbour, whose 14C level of ∼47–92 percent modern carbon (pMC) was determined by the standard high-precision 14C analysis, were also used in our study.
Each carbonate sample was powdered using a clean pestle and mortar, and mixed with metal powder in a pre-baked Pyrex glass tube (6 mm OD × 60 mm) using a vortex mixer, before being rear-pressed into a 1.60-mm-diameter recess using a steel pin, integral to an aluminum target holder or cathode (Smith et al. Reference Smith, Petrenko, Hua, Southon and Brailsford2007). The surface of pressed carbonate and metal mixture in all cathodes, independent of mass, had the same level and was 300 μm below the cathode surface. AMS measurements were performed using 846 HVE Cs sputtering ion source with cathode voltage of 7 KV and a typical cathode current of 500 μA. 12C–, 13C– and 14C– were injected continuously with a recombinator system, and δ13C was measured on-line. We used Ar gas stripper and 3+ carbon ions charge state for AMS measurement, and the overall transmission efficiency was 40% at the operating terminal voltage of 1.98 MV (Fink et al. Reference Fink, Hotchkis, Hua, Jacobsen, Smith, Zoppi, Child, Mifsud, van der Gaast, Williams and Williams2004).
AMS measurement was carried out for two different modes: “with panning” and “without panning.” In the panning mode, the cathode is moved against the sputtering Cs ion beam in a continuous pattern covering most of its surface to ensure uniform consumption of material pressed in the cathode recess. This mode is routinely used on our graphite samples. For the “without panning” or fixed mode, the cathode is positioned motionless against the Cs incident beam focused on the center of the recess.
RESULTS AND DISCUSSION
Metal Selection and Optimal Carbonate Mass
Metal mass in carbonate targets was kept constant (∼5 mg; Bush et al. Reference Bush, Santos, Xu, Southon, Hines and Adkins2013), while carbonate mass varied between 0.3 and 3.1 mg. The performance of the three metal powders in direct carbonate measurement was investigated using the observed 12C currents at high energy (HE) and blank levels. It is worth noting that we did not measure 12C and 13C currents at low energy (LE) due to the setup of our STAR accelerator as mentioned above.
The highest 12C currents of targets prepared from IAEA-C1 and IAEA-C2 were observed for Nb mixed with a carbonate mass of 1.5–2.0 mg (Figure 1). These currents were 4.3 μA for “with panning” mode and 5.5 μA for “without panning” mode, and were ∼8–11% of typical current obtained from graphite targets of standard size (>0.5 mg C) of ∼50 μA. The highest beam currents for Fe and Ag were 2.7–3.0 and 0.8–1.8 μA, respectively (Figure 1).
12C (HE) currents vs. carbonate mass for IAEA-C1 (a) and IAEA-C2 (b). Each data point depicts an average 12C+3 current for a measurement time of 1080 s. All 12C+3 currents plotted in this diagram are observed currents multiplied by the chopper ratio.

Figure 2 shows blank levels measured from IAEA-C1 free of 14C mixed with Nb and Fe. It is noted that no blank data from Ag are shown in Figure 2 because they might not be reliable due to their low currents. The results indicated (1) blank values for targets using Nb (0.22–0.86 pMC in “without panning” mode and 0.22–1.57 pMC in “with panning” mode) were much lower than those using Fe (0.76–2.67 pMC in “without panning” mode and 0.57–2.98 pMC in “with panning” mode), and (2) the lowest blank values of 0.22–0.62 pMC were observed for targets using Nb with a carbonate mass of 1.0–2.6 mg when “without panning” mode was employed.
14C level vs. carbonate mass for IAEA-C1. Each data point indicates an average pMC value for a measurement time of 1080 s. Error bars are 1σ.

Based on the above results, of the three high-purity metal powders used in our investigation, Nb was found to be the best metal and “without panning” was the most relevant mode of AMS carbonate measurement. It is because they delivered higher beam currents and lower background. We also found that the optimal carbonate mass range was 1.5–2.0 mg, in which the highest beam currents (see Figure 1) with the lowest blank levels (similar to those of 1.0–1.4 mg and 2.1–2.6 mg; see Figure 2) were observed.
Typical performance of a carbonate target (using Nb and “without panning” mode) through time is depicted in Figure 3, showing the target provides good output for more than an hour in the ion source. In addition, measured 14C/12C ratio of the carbonate target was similar and reliable during the measurement although its beam current varied substantially (e.g., the beam current changed more than 4 times between the highest and lowest currents). This feature is similar to that reported in Longworth et al. (Reference Longworth, Robinson, Roberts, Beaupre, Burke and Jenkins2013).
Typical performance of a carbonate target within the optimal carbonate mass of 1.5–2.0 mg over time. The horizontal line indicates the weighted mean of 14C/12C ratio of all measurements. Error bars indicate 1σ uncertainties associated with individual 14C/12C ratios obtained for every measurement time of 270 s. All 12C+3 currents plotted in this figure are observed currents multiplied by the chopper ratio.

Carbon Contamination and Background Correction
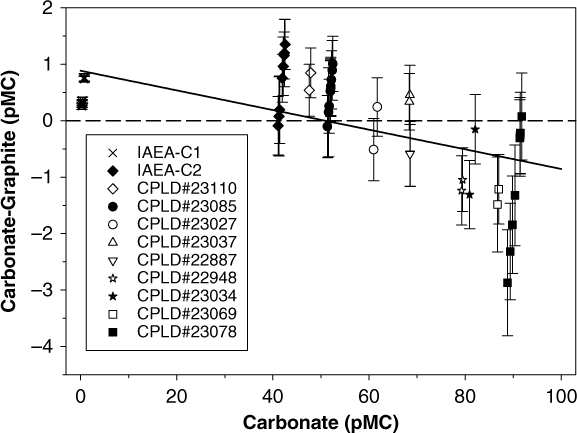
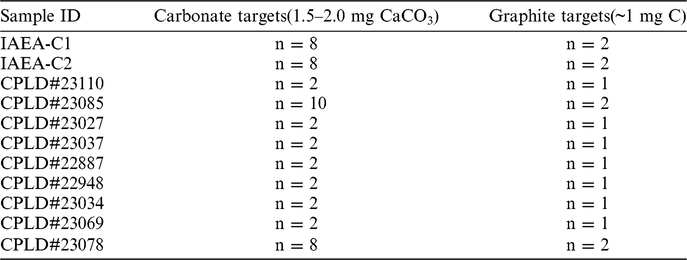
Following the approach described in Longworth et al. (Reference Longworth, Robinson, Roberts, Beaupre, Burke and Jenkins2013), carbon contamination incorporated into carbonate targets was estimated by comparing the measured 14C values of this method after correction for fractionation using on-line δ13C with the background-corrected 14C values obtained from high-precision analysis of graphite targets (∼0.3% precision) derived from known-age shell samples (47–92 pMC) and reference carbonate materials IAEA-C1 and IAEA-C2 (Figure 4). Table 1 shows number of carbonate targets containing of 1.5–2.0 mg (the optimal carbonate mass) and graphite targets containing ∼1 mg of carbon employed for the estimation of carbon contamination as depicted in Figure 4.
Difference in pMC between carbonate and graphite targets vs. measured pMC of carbonate targets for the optimal carbonate mass of 1.5–2.0 mg. The solid line depicts linear fit to all the data. Each error bar depicts 1σ uncertainty associated with the offset between pMC value measured in a carbonate cathode and the background-corrected pMC of the associated sample determined by graphite analysis of either one or two cathodes (see Table 1).

Number of carbonate and graphite targets used for the estimation of carbon contamination

The extraneous carbon is determined by the following equations:
 $${m_m}{F_m} = {m_s}{F_s} + {m_c}{F_c}$$
 $$\hskip-5.5pt{m_m} = {m_s} + {m_c}$$
where m is carbon mass, F is pMC, and subscripts s, c and m denote the sample, contaminant and matrix material of the sample carbonate target.
From (1) and (2)
 $${F_m} - {F_s} = {{{m_c}{F_c}} \over {{m_s}}} - {{{m_c}} \over {{m_s}}}{F_m}$$
The linear regression to all data shown in Figure 4 has a form similar to (3)
 $${F_m} - {F_s} = a + b{F_m}$$
where a and b are constant
From (3) and (4)
 $$a = {{{m_c}{F_c}} \over {{m_s}}}$$
 $$b = - {{{m_c}} \over {{m_s}}}$$
From (5) and (6)
 $${F_c} = - {a \over b}$$
The 14C level of extraneous carbon incorporated in our system Fc is 51 ± 14 pMC, which is the intercept of the linear regression line in Figure 4 with the x-axis. Possible sources of extraneous carbon include atmospheric CO2 absorbed by carbonate powder, carbon traces in Nb metal, and contamination during sample handling and cathode loading. The last source of extraneous carbon is negligible as all tools used in sample handling and cathode loading were cleaned beforehand to remove possible carbon contamination (e.g., clean pestle and mortar, clean stainless-steel spatulas and tweezers, and pre-baked Pyrex glass tubes). pMC value of carbon traces in Nb was also determined by AMS analysis of a couple of cathodes containing only Nb (∼5 mg), although the 12C beam currents obtained from these cathodes were not high (∼0.4 μA). The combination of measured carbon traces in Nb of ∼30 pMC and atmospheric CO2 of ∼100 pMC might explain the determined Fc in our system of 51 pMC as mentioned above.
The size of the carbon contamination is related to the slope b of the regression line in Figure 4. Based on Equation (6), the mass of extraneous carbon incorporated in our system is 3.7 ± 0.9 μg of carbon.
From (3) and (6),
 $${F_s} = {F_m} + b\left( {{F_c} - {F_m}} \right)$$
The uncertainty associated with Fs is determined by the following equation:
 $${\sigma _{{F_s}}} = {\rm{}}\sqrt {{\sigma _{{F_m}}}^2 + {\rm{}}{{\left( {\left( {{F_c} - {F_m}} \right){\rm{}}{\sigma _b}} \right)}^2} + {\rm{}}{{\left( {b{\rm{}}{\sigma _{{F_c}}}} \right)}^2} + {{\left( {b{\rm{}}{\sigma _{{F_m}}}} \right)}^2}} $$
where σx is uncertainty associated with value x
Equations (8) and (9) were used for blank correction for all measured Fm values.
Accuracy of Direct Carbonate Analysis
After correcting for fractionation using on-line δ13C values and for extraneous carbon using Equations (8) and (9), pMC values of all test carbonate samples (shell samples and reference material IAEA-C2 shown in Figure 4) agreed well with their associated values obtained from graphite targets within 2σ uncertainties. Background-corrected pMC values of carbonate targets vs. those of their associated graphite targets for several of test samples were shown in Figure 5. Typical precision of this rapid method (direct carbonate analysis by AMS 14C) was ca. 1% (1σ) for samples <8 ka.
Background-corrected pMC values of carbonate targets vs. those of the associated graphite targets. Symbols (with 1σ error bars) and box plots represent values of carbonate targets. The same symbols employed in Figure 4 are used in this figure. Solid and dashed lines within each box mark the median and mean values, respectively. Thick solid and dashed lines represent mean pMC and 1σ uncertainties of graphite targets, based on either one or two cathodes (see Table 1), whose numerical values are shown below the sample IDs.

TIME-AVERAGING OF FOSSIL SHELL ASSEMBLAGES COLLECTED FROM SYDNEY HARBOUR
Palaeoecological studies and taphonomic analyses are often concerned with the range of ages found within a stratigraphic layer and/or fossil assemblage. To quantify time over which an assemblage formed, time-averaging, a dozen or more ages are typically required, making graphite target AMS 14C ages cost prohibitive for most researchers. Many studies have used 14C-calibrated AAR to determine the age of shell as the cost per date is favourable despite lower precision (e.g., Kosnik et al. Reference Kosnik, Hua, Kaufman, Kowalewski and Whitacre2017). Even with relatively imprecise age estimates the age variability in a fossil assemblage is much larger than the uncertainty of the ages (e.g., Dominguez et al. Reference Dominguez, Kosnik, Allen, Hua, Jacob, Kaufman and Whitacre2016). Here we reanalyze the same specimens used to quantify time-averaging from a 5-cm layer at 1.60-m depth of a subaqueous excavation of Sydney Harbour to examine the influence of the dating method on estimates of time-averaging (Dominguez et al. Reference Dominguez, Kosnik, Allen, Hua, Jacob, Kaufman and Whitacre2016). See Dominguez et al. (Reference Dominguez, Kosnik, Allen, Hua, Jacob, Kaufman and Whitacre2016) for the details of estimating dates using 14C-calibrated AAR.
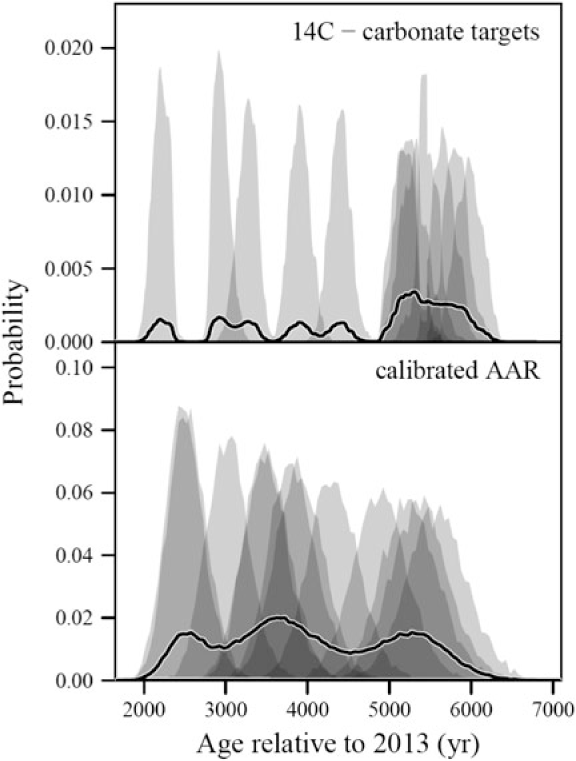
Reanalysis of the same 12 shells in the layer, previously dated by Dominguez et al. (Reference Dominguez, Kosnik, Allen, Hua, Jacob, Kaufman and Whitacre2016), using carbonate-target AMS yielded a similar age range, with the 95% quantile of the combined probability distribution being 2153–6089 yrFootnote 1 for carbonate target AMS and 2280–5915 yr for calibrated AAR ages. The similarity of the total assemblage age range masks some important differences in the two assemblage-level age distributions (Figure 6). The carbonate target ages have a strong mode composed of seven shells with median ages older than 5000 yr whereas the AAR dates are more uniformly spread across the age range with only three shells with median ages older than 5000 yr (Figure 6). As a result, the estimated median age of the shell assemblage is notably older for the carbonate target AMS method, 5155 yr, in comparison to that of the calibrated AAR dating method, 3890 yr.
Calendar age probability distributions for individual shell specimens (shaded) and assemblage (black line) for 14C carbonate targets and calibrated AAR ages. Replicate carbonate target and AAR data have been averaged by specimen. 14C age estimates are in 5-yr bins whereas AAR age estimates are in 50-yr bins due to the difference in the precision of the two ages.

While the median age estimate for the fossil assemblage differs by ∼28%, the time-averaging estimates from the two dating methods are not notably different (the interquartile range differs by 10% and the 95% confidence level by 8%). The carbonate-target assemblage age distribution suggests 8–10% more time-averaging than the AAR age distribution. A key difficulty of quantifying time-averaging is that the uncertainty associated with dating a specimen artificially inflates time-averaging estimates, and this effect is correlated with assemblage age. Attempts to correct time-averaging estimates for the uncertainty associated with the dating method make differences between the two time-averaging estimates bigger as the carbonate target ages have uncertainty estimates between 40 and 45% of the AAR age estimates.
Carbonate target AMS ages with higher precision than AAR ages at comparable cost are at an advantage. Unlike carbonate target AMS ages, AAR ages require calibration against absolute ages (e.g., Allen et al. Reference Allen, Kosnik and Kaufman2013), and the calibration is only applicable to specimens of the same taxon with the same thermal history. However, paired 14C and AAR analyses open the possibility of detailed studies of thermal history.
CONCLUSION
Our experimental results indicated that quick, direct AMS 14C analysis of carbonate samples at ANSTO was reliable with the following features: (1) 12C (HE) currents for carbonate targets, containing 1.5–2.0 mg, of ∼4μA on average were ca. 8% of those obtained from graphite targets of standard size (>0.5 mg C) of ∼50μA, (2) measured blank for Carrara marble (IAEA-C1) of ∼40 ka was obtained, (3) all background-corrected pMC values of carbonate targets agree well with those of their associated graphite targets within 2σ uncertainties, and (4) typical precision of this rapid method was ∼1% (1σ) for samples <8 ka.
The 14C-calibrated AAR dating method is usually employed for the study of time-averaging of fossil shell assemblages where a large number of dates are required. With higher precision compared to the calibrated AAR ages at comparable cost, carbonate target AMS ages are useful for such studies in particular, and for palaeobiological and palaeoecological research in general.
ACKNOWLEDGMENTS
This work was supported by ANSTO Portal project 10062. We acknowledge the financial support from the Australian Government for the Centre for Accelerator Science at ANSTO through the National Collaborative Research Infrastructure Strategy (NCRIS). We also thank Andrew Jenkinson for help with AMS measurement, and two anonymous reviewers and Associate Editor Christine Hatté for their useful comments.